You need to see your private equity investments clearly. A private equity dashboard lets you watch and understand your portfolio. With a dashboard, you can view all your data together. Modern dashboards like FineReport by FanRuan give you smart ideas from your data. You can make quick choices and react fast to changes. These tools help you use hard data to take actions that get results.
Understanding the Private Equity Dashboard
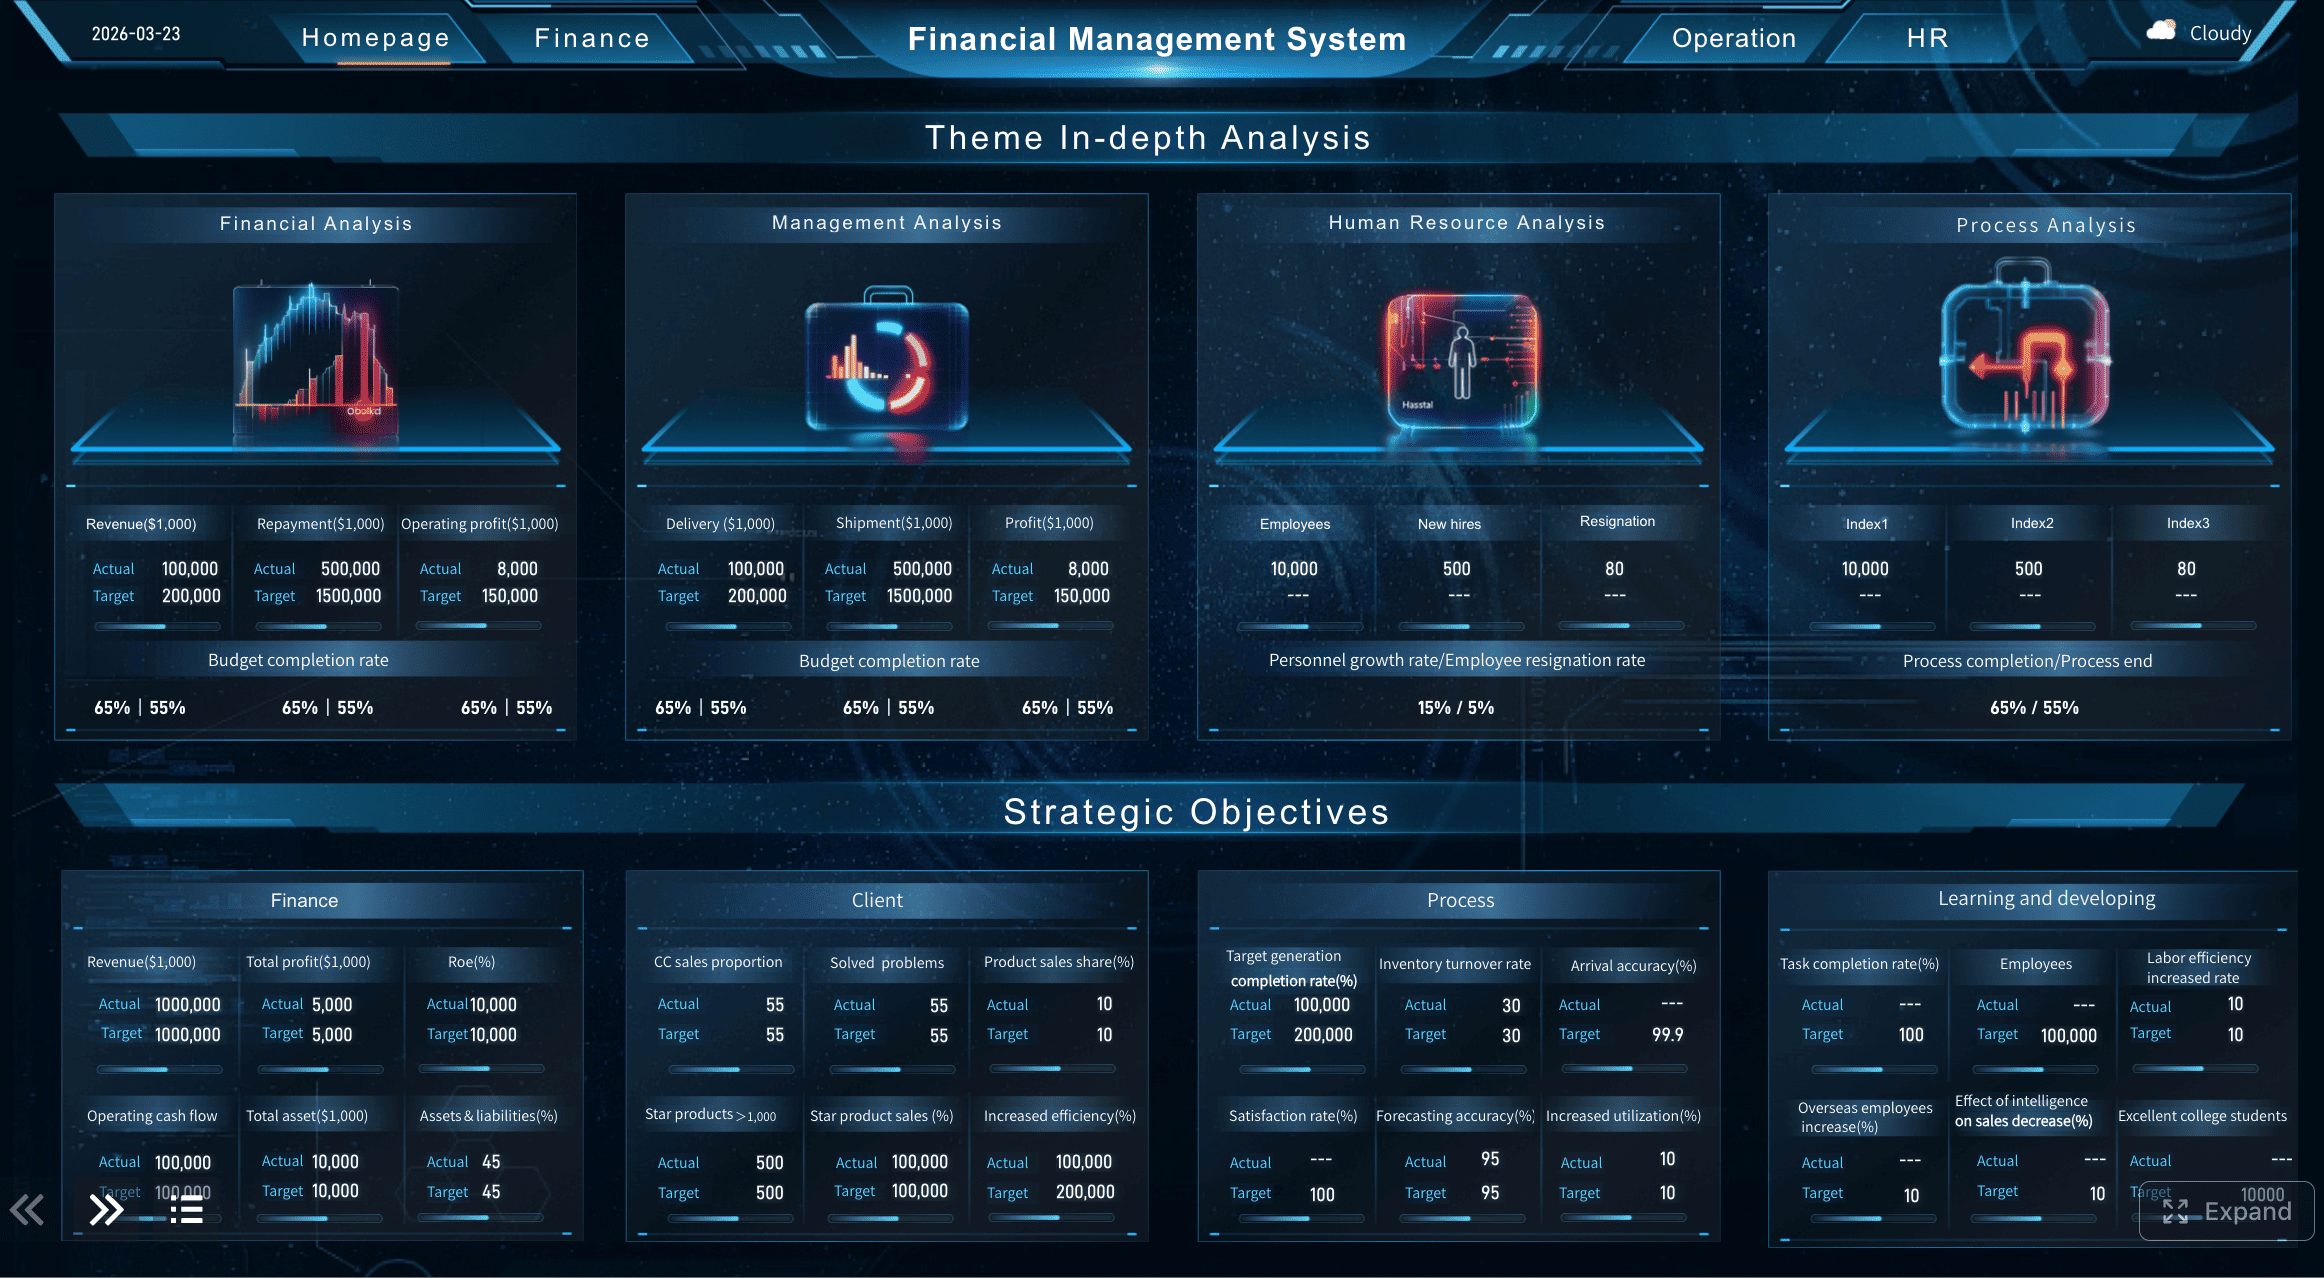
What Is a Private Equity Dashboard?
You need to see your investments clearly to do well in private equity. A private equity dashboard helps you do this. It puts all your data in one spot. You can check your investments, watch how they do, and notice trends right away. This tool makes hard information easier to understand. You do not have to look through lots of reports or spreadsheets. Everything you want is on one screen.
A normal private equity dashboard has many important parts:
Time-based analysis shows how commitments change over time.
Scenario models let you try out different results.
Role-based access controls keep your data safe.
Clear metric definitions help everyone know what numbers mean.
Tracking of key performance indicators like EBITDA, CAGR, and gross margin.
Automated benchmarking lets you compare how things are going.
Real-time data access means you can always check your data.
Unified communication tools help everyone talk and share.
These features help you know more about your private equity portfolio. You can see where you are and what you should do next.
FineReport help you make this kind of dashboard for private equity. FineReport connects to many data sources and brings your information together. You can make your own dashboards with drag-and-drop tools. You do not need to know how to code. FineReport lets you see your data in charts, tables, and graphs. You can also use your dashboard on your phone or tablet, so you always know what is happening.
How It Supports Private Equity Firms
A dashboard for private equity does more than just show numbers. It helps you at every step of private equity investing. You can use it to manage your private equity portfolios, track deals, and report to investors. The dashboard helps you see trends early. You can fix small problems before they get big.
Here is how a private equity dashboard helps your firm:
It is more than just reporting. You get a full system that helps you make good choices and create value.
Centralized data and real-time monitoring give you better ideas about your investments. You can compare deals and find ways to do better.
Continuous monitoring helps you spot problems early. You do not have to wait for monthly or quarterly reports.
Technology like FineReport helps you give investors fast reports and clear data. You spend less time finding data and more time using it.
Data analytics has changed how you manage private equity. You can automate jobs like deal sourcing and portfolio monitoring. This saves time and helps you make fewer mistakes. Advanced analytics and AI help you work smarter. You can use data to plan exits and do better.
Now, private equity firms use real-time data to show how they create value. You can track KPIs and show your results to investors. This builds trust and helps you stand out from others.
FineReport works well in this new way of doing things. It gives you tools to collect, study, and share data. You can make dashboards that fit your needs. You get a clear view of your private equity portfolio and can make better choices every day.
Key Features of a Private Equity Dashboard
Real-Time Data and Integration with FineReport
You need to know about your portfolio management right away. Real-time reporting lets you see changes as they happen. With FineReport, you can connect to many data sources and see updates fast. You do not have to wait for old reports anymore. You can check your investments and make choices quickly.
FineReport brings all your data together in one place. You can use advanced analytics to watch performance and find trends. Real-time reporting helps you react to market changes and new risks. You can use data from different systems without extra steps. This saves time and lets you focus on portfolio management.
Portfolio Oversight and Analytics
A good dashboard gives you a clear look at your portfolio management. You can use analytics to compare your companies to others in the industry. This helps you see who is doing well and who needs help. You can track changes, watch for risks, and report to investors with confidence.
Here is a table that shows important analytics for portfolio management:
Feature
Description
Baseline Assessments
Score each company against peers and standards.
Peer Benchmarking
Compare companies to industry data across 1,200+ firms.
Remediation Tracking
Monitor fixes and make sure improvements last.
Portfolio Reporting
Give clear updates to investors and boards, showing where the biggest risks are.
You can use advanced analytics to turn raw data into ideas. This helps you make smart choices and improve portfolio management. Dashboards let you track KPIs, cash flow, and compliance. You can see all your data in one spot and act fast.
Customization and Mobile Access
Every private equity firm is different. You need dashboards that fit your needs. FineReport lets you change your dashboard for your team, your investors, or your brand. You can pick how data looks and what analytics you see. This makes portfolio management easier for everyone.
Custom dashboards help you keep all your deal data in one place. You can use the same dashboard on your phone, tablet, or computer. Mobile access means you can check your portfolio management data anywhere. You do not have to be in the office to make smart choices.
Customization lets you show data in the way that works best for you.
Mobile dashboards help you manage deals and track analytics on the go.
Consistent formats make it easy for everyone to understand the data.
With FineReport, you get dashboards that work for you. You can use advanced analytics, real-time reporting, and mobile access to stay ahead in portfolio management.
You need to make good choices fast in private equity. A private equity dashboard gives you tools to use data for decisions. You can see all your investment data in one spot. This helps you notice trends and act quickly. You do not waste time looking for numbers or making reports by hand.
Dashboards put data from many places together. You save a lot of time and work. You get real-time reports, so you always know how your investments are doing. You can use advanced analytics to test different ideas and see what could happen. This helps you find new chances and avoid mistakes.
Feature
How It Helps You
Comprehensive Data
Saves time by putting all investment data in one dashboard.
Advanced Analytics
Lets you test ideas and spot trends before others do.
Real-time Reporting
Gives you up-to-date performance numbers for every investment.
Private equity business intelligence tools give you real-time numbers. You can track how things are going and find new deals. These tools help you stay ahead in a fast industry. You can look at lots of data and make better choices. This makes your daily work easier and helps your firm grow.
Dashboards also help you watch key performance indicators for your teams. You can see how each investment is doing. This helps everyone stay responsible and focus on results. You can use dashboards to show investors clear ideas they can use. This builds trust and shows your value.
Risk Management and Value Creation
Every investment has risks. A private equity dashboard helps you handle these risks. You can set up a deal-to-exit risk plan. This means you check for risks all the time, not just once. You can do your own risk checks and pick who will watch each risk. This keeps your investments safe and stops surprises.
Good risk management is not just one job. You need to keep watching and use data to make choices. Dashboards help you see problems early. You can act before risks hurt your returns. You can also check rules and safety for every investment. This protects your firm and your investors.
Dashboards help you make more value, too. You can use them to make things work better and get more returns. Some firms use dashboards to manage rebates and make up to 10% more profit. Others use AI dashboards to cut reporting time from days to hours. You can use private equity business intelligence to track cash flow, IRR, and EBITDA right away. This gives you ideas you can use for every investment.
Firms with strong private equity business intelligence do better than others. They make more value and get better returns. You can use dashboards to share data, follow rules, and make smarter choices. This keeps your portfolio strong and helps you grow.
Private equity business intelligence is the key to growing smart. You can use data to find new chances, handle risks, and get good returns. A private equity dashboard gives you the ideas you need to lead in the industry.
Choosing the Right Private Equity Business Intelligence Solution
Evaluation Criteria for Dashboards
You want to find the best dashboard for your private equity firm. First, look at what matters most in investment management. Use this table to compare your choices:
Evaluation Criteria
Description
Revenue Growth & EBITDA
Shows how well your investments do and how much profit they make.
Customer Metrics (LTV, CAC, Churn)
Tells you how well you keep and get customers, which helps your business grow.
Operational Efficiency Metrics
Measures how smoothly your companies work, which affects cash flow and risk.
Checks how your investments do with environmental, social, and governance rules.
Return on Invested Capital (ROIC)
Shows how much you earn from your investments and helps you plan exits.
When you pick a private equity dashboard, look for features that help you track progress right away. You need dashboards that let you set goals for each market and show custom reports for leaders. Make sure you can work with your team, set user permissions, and connect to feedback tools. You also want dashboards that can grow with your firm and do tasks automatically.
Implementation Best Practices with FanRuan
You might have problems when you set up a new dashboard for private equity. Data can be in many different places. You may worry about connecting systems, matching your plans, or following rules. Use this table to see common problems and how to fix them:
Challenge
Solution
Data fragmentation
Bring all your data together with IT experts for clear ideas.
Integration issues
Use skilled IT teams to connect all your systems easily.
Aligning portfolio company strategies
Plan with IT partners to match your technology needs.
Innovation and risk management
Try new tools with IT support to handle risks.
Evolving investor and portfolio expectations
Use IT solutions to give better digital experiences.
Legal and financial risks
Follow IT rules to stay safe and meet laws.
Loss of investor trust
Check your IT often to protect data and keep trust.
Data breaches and cyberattacks
Meet IT standards to lower risks and avoid legal trouble.
Operational disruptions
Stay ahead of rules to avoid problems with your operations.
FineReport by FanRuan gives you a strong tool for private equity. You can connect all your data, make custom dashboards, and keep your investment management on track. FineReport helps you follow rules, protect your data, and make better choices every day.
You need a private equity dashboard to help your firm stay ahead. When all your private equity data is together, you can see trends fast. FineReport by FanRuan lets you use this data to make better choices. You get real-time monitoring and alerts for your private equity investments. Look at this table to see how dashboards change your data:
Aspect
Before Analytics
After Analytics
Portfolio Monitoring
Quarterly board meetings, lagging data
Real-time dashboards, leading data, predictive alerts
With a private equity dashboard, you can do many things. You can track data and find risks early. You can compare your performance to others. You can use data to find value and get better returns. You can keep all your data in one place for teamwork. You can see deals clearly and manage relationships. You can work better with your team by sharing data. You can make decisions using clear data. You can spot assets that are not doing well. You can use real-time data to give out resources. You can upgrade your tools to get better results.
Check your current dashboard and see if your data is enough. Upgrading to FineReport by FanRuan can help your firm grow by using data in smarter ways.
Product Trial
FineReport
Pixel-perfect reports · Interactive dashboards · Easy data entry · Digital twins
Access a wealth of case studies, industry insights, and solution guides to accelerate digital transformation.
FAQ
What is a private equity dashboard?
A private equity dashboard puts all your investment data together. You can watch how your investments are doing. You can see trends and make choices fast. It helps you understand everything without looking through lots of reports.
How does FineReport help private equity firms?
FineReport lets you connect to many kinds of data. You can make dashboards with easy drag-and-drop tools. You get updates right away and can see your data on any device. This makes your work quicker and more correct.
Can I use FineReport on my phone?
Yes! You can look at dashboards and reports on your phone or tablet. FineReport lets you use mobile access, so you always know what is happening.
What data sources can FineReport connect to?
FineReport connects to more than 100 data sources, like:SQL databases, Excel files, Cloud platforms, JSON and XML files.You can bring all your data together to study it easily.