A customer experience dashboard should help different teams act on the same customer reality without forcing everyone to work from the same screen. Executives need a high-level view of loyalty, churn risk, and revenue impact. Support leaders need service bottlenecks and ticket trends. Product teams need usage signals and friction points. Marketing needs to know whether acquisition and onboarding promises match the actual experience. If your organization is still relying on scattered reports, delayed survey summaries, or one generic CX dashboard, decisions will be slower, ownership will stay unclear, and customer issues will spread before anyone intervenes.
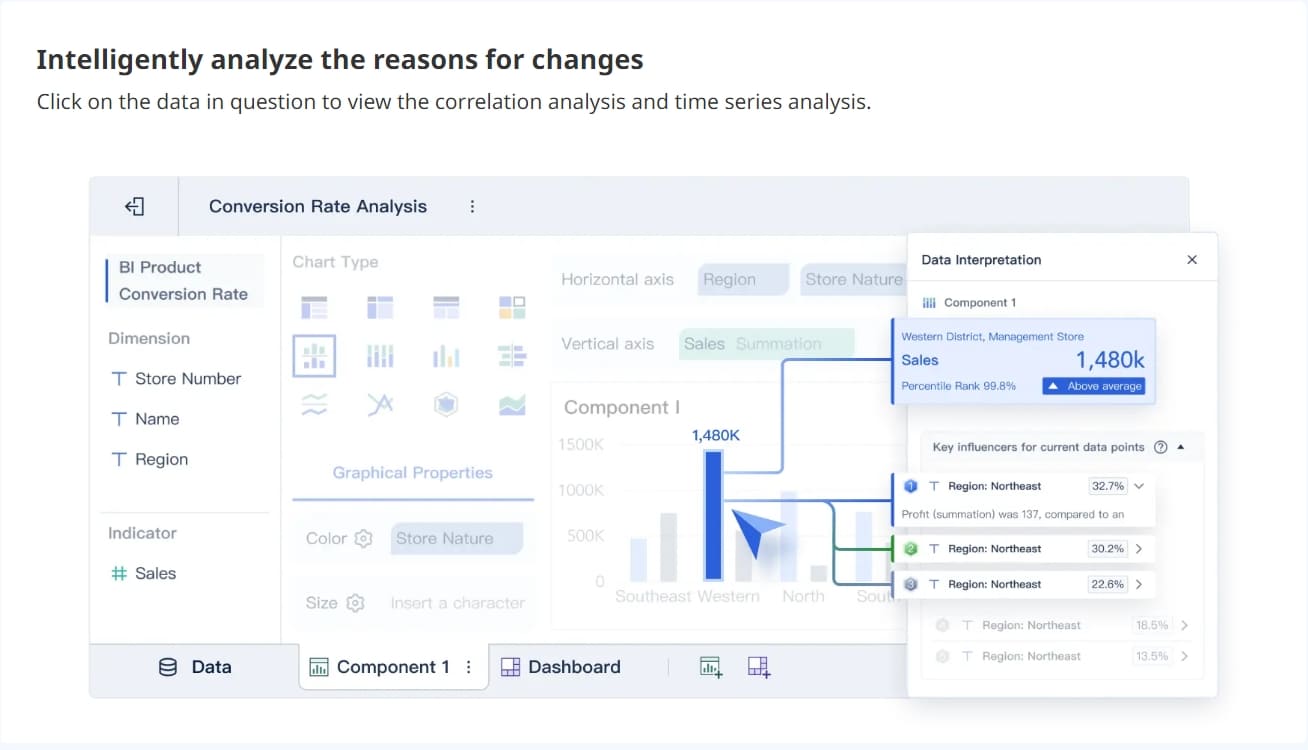
All dashboards in this article are built with FineBI.
What a Customer Experience Dashboard Should Do for Each Team
A strong customer experience dashboard creates a shared operating model for customer insight. It brings together feedback, operational performance, product behavior, and business outcomes so teams can see what customers are experiencing now, what is changing, and where action is needed next.
But a single company-wide dashboard is rarely enough.
Executives, support managers, product leaders, and marketers all make different decisions on different time horizons. A CEO may review retention risk monthly. A support manager may need hourly backlog and SLA visibility. A product manager may track onboarding drop-off daily. A marketing leader may compare campaign cohorts weekly to identify expectation gaps. If all of them use one overloaded dashboard, the result is clutter, weak adoption, and inconsistent action.
The better model is a shared CX measurement layer with role-based views. That means every team works from the same baseline definitions—such as NPS, CSAT, churn, or onboarding completion—while seeing a different level of detail, drill-down, and alert logic based on what they control.
Why team-specific CX views matter
Team-specific views improve speed without breaking alignment. They help each function answer practical questions:
Executives: Are customer experience problems becoming revenue problems?
Support: Where are service delays, repeat issues, and avoidable escalations increasing?
Product: Which behaviors predict adoption, frustration, or churn?
Marketing: Are campaigns bringing in the right-fit customers, and do early journey signals support retention?
This approach preserves a common customer experience baseline while making the dashboard useful in real operations.
Key Metrics (KPIs) every customer experience dashboard framework should define
Below is the core KPI structure most organizations need before splitting views by team:
Net Promoter Score (NPS): Measures customer loyalty and likelihood to recommend.
Customer Satisfaction Score (CSAT): Measures satisfaction with a specific interaction or touchpoint.
Customer Effort Score (CES): Measures how easy it was for the customer to complete a task or get support.
Retention Rate: Percentage of customers who stay over a defined period.
Churn Rate: Percentage of customers who leave or cancel.
Customer Lifetime Value (CLV): Estimated long-term revenue contribution of a customer.
First Response Time (FRT): Time between customer contact and first reply.
Average Resolution Time: Time needed to fully resolve an issue.
First Contact Resolution (FCR): Percentage of issues solved in the first interaction.
Backlog Volume: Number of unresolved tickets or open issues.
Escalation Rate: Share of cases that require higher-level intervention.
Feature Adoption Rate: Percentage of users engaging with a key product capability.
Activation Rate: Percentage of new users reaching the defined value milestone.
Time to Value (TTV): Time it takes a new customer to achieve first meaningful success.
Review or Sentiment Score: Aggregated customer tone from reviews, comments, or feedback themes.
Conversion Quality: Whether acquired customers show healthy onboarding, usage, and retention behavior.
Advocacy Signals: Referrals, reviews, community participation, or repeat purchase behavior indicating loyalty.
How to Build a Customer Experience Dashboard by Team
Building a useful customer experience dashboard is less about visual design and more about operating discipline. The best dashboards are tied to decisions, not just reporting.
Start with shared business goals and customer journey stages
Begin by mapping customer experience metrics to the customer journey:
Acquisition
Onboarding
Usage
Support
Retention
Advocacy
This prevents teams from optimizing isolated touchpoints while missing the full customer story. For example, marketing may celebrate low acquisition costs while support and product teams absorb low-fit customers with higher complaint rates and lower retention.
Next, define the decisions each team makes weekly and monthly. This is where many dashboard projects fail. If a metric does not influence a decision, it likely does not belong on the main view.
Support platforms for tickets, backlog, SLA, escalations
Product analytics for adoption, activation, errors, usage
CRM systems for accounts, renewals, revenue, churn
Marketing platforms for campaign, onboarding, engagement, conversion quality
Review and feedback channels for sentiment, themes, advocacy
Assign an owner for every KPI. Not just the dashboard admin—the metric owner. Someone must define calculation logic, data quality rules, thresholds, and review cadence.
Keep the dashboard simple, actionable, and role-based
A customer experience dashboard should reduce noise, not display everything available.
Use these design rules:
Show only the KPIs that trigger action
Use benchmarks and targets next to each major metric
Favor trends over isolated snapshots
Add filters by segment, product, channel, region, and cohort
Build drill-down paths instead of stuffing details onto one page
Highlight exceptions, not just averages
This is where FineBI can be especially useful for enterprise teams. With role-based dashboards, drill-through analysis, and integrated views across operational and business data, teams can move from high-level CX reporting to root-cause analysis without rebuilding reports for every department.
Executive Customer Experience Dashboard KPIs: What Leadership Should See
Executives need a strategic customer experience dashboard that answers one core question: Is the company improving customer loyalty and reducing revenue risk?
They do not need a wall of operational detail. They need the few indicators that reveal whether customer experience is strengthening or weakening business performance.
Business-level customer experience indicators
Leadership dashboards should track the customer outcomes most connected to financial health and strategic priorities:
NPS trend: Indicates brand loyalty and future advocacy direction
CSAT trend: Shows whether recent service and product interactions are improving
Retention rate: Measures ability to keep customers over time
Churn rate: Highlights lost customers and potential revenue leakage
Repeat purchase rate: Useful for subscription, SaaS, ecommerce, and loyalty-driven models
Customer lifetime value: Connects customer experience to long-term economics
The goal is not just to report these metrics independently, but to connect them. For example, a drop in CSAT plus rising complaint volume plus reduced renewal intent is more actionable than any single score on its own.
Operational signals that reveal emerging issues
Executives also need a few early warning signals that indicate friction before it hits churn or revenue:
Support backlog
First response time trend
Escalation rate
Major complaint themes
Journey-stage friction by customer segment
Top accounts or regions at risk
These metrics matter because they reveal whether customer problems are isolated or systemic. A rising escalation rate tied to onboarding issues, for example, may point to a product usability gap, a documentation problem, or poor expectation-setting in marketing.
Support and Service Customer Experience Dashboard KPIs: What Frontline Teams Should See
Support teams need the most operationally active customer experience dashboard. Their view should help supervisors and service leaders manage volume, speed, quality, and customer sentiment in near real time.
Service efficiency and resolution metrics
These KPIs tell support teams whether service operations are keeping up with demand and resolving issues effectively:
First response time
Average resolution time
Ticket volume
Open backlog
SLA attainment
First contact resolution
Escalation rate
Together, these metrics show where workflows are breaking. For example:
High volume plus rising backlog suggests capacity or routing issues
Fast first response but poor FCR suggests superficial handling
Strong SLA performance but low CSAT suggests a quality problem hidden behind speed metrics
Quality and customer sentiment metrics
Speed matters, but support teams also need quality measures that reflect the customer’s perspective.
Track:
CSAT by channel, team, and issue type
Customer Effort Score
QA review scores
Reopen rate
Top contact reasons
Negative sentiment trend
Recurring issue categories
Trend analysis is essential here. A temporary spike after an outage should not trigger the same response as a recurring increase in billing complaints, onboarding confusion, or product defect reports.
Best practices for support dashboard design
A seasoned CX consultant would typically recommend these steps:
Separate live queue management from weekly quality review. One dashboard should support intraday operations; another should support coaching and process improvement.
Tag contact reasons consistently. Without disciplined tagging, trend analysis becomes unreliable.
Pair speed metrics with quality metrics. Never optimize response time alone.
Create alert thresholds for volume spikes and SLA breaches. This enables proactive staffing and escalation.
Feed support themes into product and marketing reviews. Support data is one of the earliest sources of customer friction insight.
Product and Marketing Customer Experience Dashboard KPIs: What Growth Teams Should See
Product and marketing teams shape expectations before and after purchase. Their customer experience dashboard should show whether users are finding value quickly, engaging meaningfully, and staying aligned with the promise made during acquisition.
Product metrics tied to customer experience
A product-focused customer experience dashboard should track the behavioral signals most connected to success and frustration:
Product teams should compare customer feedback with actual behavior. If users report confusion and the dashboard shows slow activation plus low use of a core feature, the prioritization case becomes clear.
Marketing metrics that shape customer expectations and loyalty
Marketing has a major influence on customer experience long before a support ticket appears. If campaign promises overstate value, target the wrong audience, or create unrealistic onboarding expectations, downstream CX metrics will suffer.
Key marketing-facing KPIs include:
Conversion quality
Onboarding engagement
Campaign-to-retention performance
Review sentiment
Referral and advocacy signals
Message-to-experience alignment
Segment-level retention by source or campaign
This helps marketing answer critical questions:
Are we attracting customers who actually fit the product?
Does onboarding behavior support long-term retention?
Are negative reviews tied to expectation gaps created in campaigns?
Which channels produce loyal customers rather than just cheap leads?
Best practices for product and marketing implementation
For most organizations, these are the highest-impact actions:
Define activation with precision. It should reflect meaningful customer value, not just account creation.
Track cohorts by acquisition source. This reveals whether marketing quality affects product adoption and retention.
Overlay feedback themes on behavior data. Do not separate qualitative and quantitative insight.
Monitor releases and campaigns against CX shifts. Product launches and message changes should have measurable post-launch tracking.
Review dashboard metrics together monthly. Product and marketing should jointly evaluate whether promise, onboarding, and usage are aligned.
Customer Experience Dashboard Examples and Best Practices
The most effective customer experience dashboard programs share a common architecture but vary the presentation by role. That is the difference between alignment and overload.
Example dashboard views by team
A mature organization often uses four linked views:
These views should share core metrics such as NPS, CSAT, churn, retention, and top complaint themes, but each should drill into different causes and actions.
Even well-funded dashboard projects fail when teams overload the design or ignore governance. Avoid these common problems:
Vanity metrics: High traffic or ticket counts without business context
Too many KPIs: If everything is important, nothing is actionable
Unclear metric definitions: Teams stop trusting the dashboard when numbers conflict
No ownership: Metrics without owners become stale and disputed
No action thresholds: Users see data but do not know when to intervene
No review rhythm: Dashboards become passive displays instead of management tools
No evolution: CX priorities change as products, channels, and customer expectations change
A good dashboard is not finished at launch. It should be reviewed quarterly to refine definitions, remove unused metrics, add new friction signals, and improve team relevance.
Final Recommendation: Build One Customer Experience System, Not One Generic Dashboard
If you want your customer experience dashboard to drive results, build it as a shared system with role-based views. Start with common business goals, standard KPI definitions, and customer journey stages. Then tailor the dashboards to the decisions each team owns.
That model gives executives strategic clarity, support teams operational control, product teams behavioral insight, and marketing teams a direct view of expectation quality and loyalty impact. It also creates the one thing most organizations are missing: a trusted customer experience baseline that every department can act on.
FineBI is a strong fit for this approach because it supports multi-source integration, role-based dashboard design, interactive drill-downs, and enterprise-ready governance—exactly what cross-functional CX programs need to turn fragmented data into action.
Most CX dashboards should include loyalty and satisfaction metrics like NPS, CSAT, and CES, along with operational and business KPIs such as churn rate, retention, first response time, resolution time, and customer lifetime value. The right mix depends on which team will use the dashboard and what decisions they need to make.
Different teams act on different parts of the customer journey, so they need different levels of detail and update frequency. Role-based views keep everyone aligned on the same core definitions while making the dashboard practical for daily use.
Start by linking metrics to business goals and customer journey stages, then map each KPI to a specific team decision. A useful dashboard focuses on what users can control, rather than showing every available metric.
A strong dashboard usually combines survey feedback, support ticket data, product usage analytics, CRM records, and marketing or campaign data. Bringing these sources together helps teams connect customer sentiment with operational issues and revenue outcomes.
Update frequency should match the speed of each team’s decisions. Support teams may need near real-time data, while executives, product leaders, and marketers often review trends daily, weekly, or monthly.
Product Trial
FineReport
Pixel-perfect reports · Interactive dashboards · Easy data entry · Digital twins