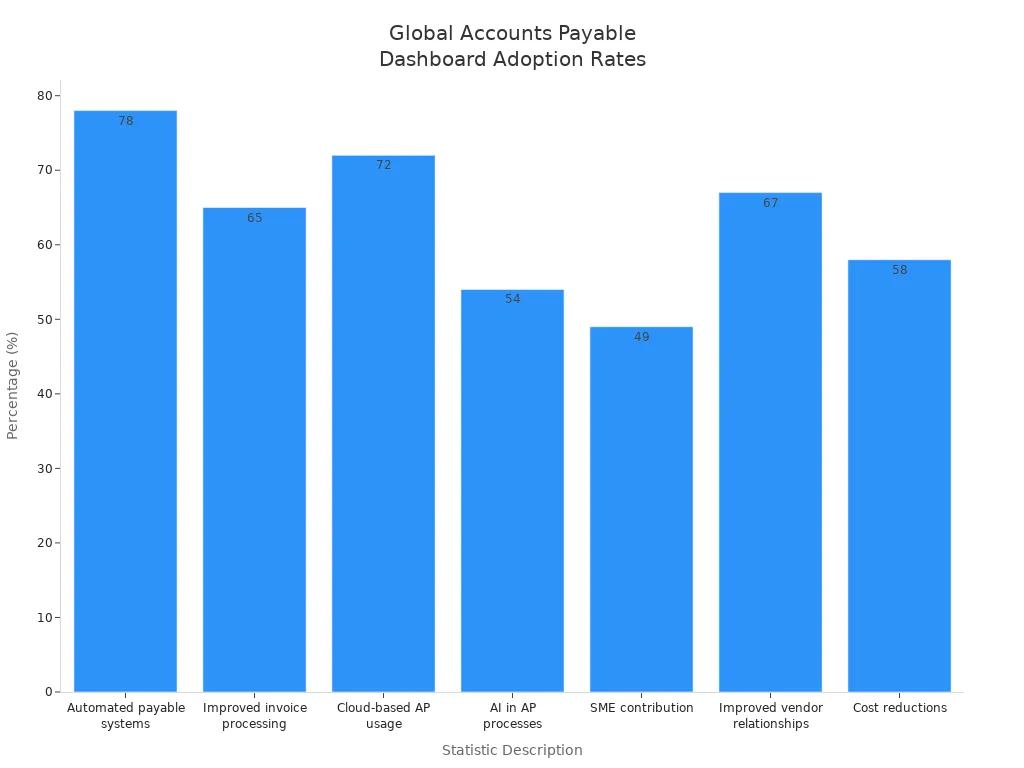
An accounts payable dashboard helps you see your company’s payments. You can look at all invoices, payments, and cash flow in one spot. Real-time updates let you make quick choices and find problems early. The chart below shows that 78% of big companies use automated payable systems. It also shows that 65% say invoice processing is better.
Modern tools like FineReport from FanRuan help you automate updates and set alerts. This helps you stay in charge and manage money better every day.
Key Point
Explanation
Immediate Access to Financial Data
You get fast access to important numbers, which helps you make good choices.
Unified View of Cash Flows
You can see all money coming in and out, so you do not miss anything important.
Automation of Data Updates
The dashboard always shows the newest numbers, so you can handle cash with confidence.
Predictive Analytics
You can spot cash problems early and get ready for them.
Custom Alerts
The system tells you about urgent problems, so you can act quickly.
Accounts Payable Dashboard Overview
What Is an Accounts Payable Dashboard?
An accounts payable dashboard lets you see your company’s bills and payments in one place. You can check all invoices, payment status, and cash flow on your screen. The dashboard uses charts, tables, and alerts to show important details. You do not need to look through paper files or spreadsheets anymore. Everything you need is easy to find.
You will usually see these main parts and visuals in an accounts payable dashboard:
Vendor payment status panels show if invoices are paid, waiting, or late.
Charts help you see trends in payables and vendor spending.
Reminders tell you about tasks that need to be done soon, like payment deadlines.
AP aging charts show which invoices are unpaid and how old they are.
Quick shortcuts help you get to reports and search for transactions fast.
Alerts let you know about chances to get early payment discounts.
Vendor performance summaries help you keep track of your best suppliers.
These features help you spot problems, save money, and pay on time. It is much easier to understand accounts payable when all the information is in one dashboard.
Core Purpose and Value
The main reason for an accounts payable dashboard is to help you manage your company’s money better. You can use it to keep cash flow steady, make fewer mistakes, and work well with vendors. The dashboard gives you real-time data, so you always know where your money goes.
Let’s see how an accounts payable dashboard is different from old accounts payable tools:
Feature
Traditional AP Management Tools
Accounts Payable Dashboards
Invoice Processing
Manual entry and paper-based
Automated with AI and OCR
Approval Routing
Manual routing to approvers
Smart, rule-based routing
Exception Handling
Manual resolution of issues
Real-time alerts for discrepancies
Payment Processing
Manual checks and ACH
Electronic payments scheduled
Visibility & Analytics
Limited reporting capabilities
Comprehensive dashboards for insights
With a dashboard, you can:
Pay monthly invoices at the best times to keep cash flow steady.
Spread out payments so you always have enough money for daily needs.
You also get these benefits:
Make the approval and payment process faster, so you can pay early and skip late fees.
Build good relationships with vendors by paying on time.
Avoid costly penalties and get discounts for paying early.
The dashboard also shows key numbers that help you see how well you are doing. For example, you can track how long it takes to process invoices, how much each invoice costs, how often mistakes happen, and how many days it takes to pay suppliers. These numbers help you see how your team is doing and where you can do better.
Time taken to process invoices, showing efficiency.
Cost per Invoice
Total cost for processing each invoice.
Error Rate
Frequency of mistakes in invoice processing.
Days Payable Outstanding (DPO)
Average days to pay suppliers.
Captured Discounts
Discounts gained by paying early.
When you use an accounts payable dashboard, you get a full view of your company’s financial health. You can make better choices, save money, and keep your business running well.
How a Meaningful Accounts Payable Dashboard Works
Data Integration and Real-Time Sync with FineReport
Your accounts payable dashboard should always show the newest numbers. FineReport from FanRuan helps by linking to your ERP or accounting software. You do not need to type in data by hand or move numbers between systems. FineReport gathers information from many places and puts it all together. This way, you always see the latest invoices, payments, and cash flow.
To set up smooth data integration, you should:
Pick a tool that works with your current systems. This saves you from extra work.
Make sure the software connects easily to your ERP or accounting tools.
Choose a platform that can connect to more than one ERP at once.
Look for real-time data sync, so everyone sees the same numbers.
FineReport keeps your dashboard up to date with real-time sync. When you add a new invoice or make a payment, the dashboard changes right away. This helps you catch mistakes and spot problems early. You can also let the system enter data for you, which lowers errors and fraud. With all your financial data in one place, you have better control and can see everything clearly.
FanRuan‘s tools help you break down data silos. You do not have to search through lots of spreadsheets or systems. Everything is in your dashboard. This makes it easier to track spending, vendor performance, and cash flow. You can make smart choices because you have all the facts.
User Interaction and Customization
You want your dashboard to match what you need. FineReport lets you change your view and work with your data in many ways. You can sort and filter invoices by vendor, due date, or amount. Color-coded trackers show which payments are late, waiting, or done. Visual charts help you see cash flow and spot trends.
Here is a table of common customization options you can use:
Customization Option
Description
Sorting and Filtering
Organize invoices by vendor, date, or amount for easy review.
Visual Trackers
Use color codes to see payment status at a glance.
Cash Flow Projections
View charts that update with real-time data to plan ahead.
Vendor Efficiency Metrics
Track how quickly you pay vendors and spot missed discounts.
Data Categorization
Group invoices to find spending patterns.
Real-Time Data Updates
See the latest numbers without waiting for manual refreshes.
Filters
Focus on specific dates or payment statuses.
Drill-Down Functionality
Click on data points to see more details.
Alerts
Get notified when something important changes.
Mobile Accessibility
Check your dashboard from your phone or tablet.
You can also drag and drop widgets to build your own dashboard layout. This helps you focus on the numbers that matter most to you. If you need special reports, FineReport gives you tools to make custom dashboards.
User interaction features help you work faster and make fewer mistakes. Automation grabs invoice data and fills it in for you. Clear approval steps keep everyone on track. Centralized documents mean you do not lose important files. Data checks catch errors before they cause trouble. When everyone has the right amount of work, your team stays accurate and quick.
A good accounts payable dashboard gives you control, flexibility, and confidence. You see real-time data, work with your numbers, and change your view to fit your needs. With FineReport and FanRuan, you can turn hard financial data into clear, useful ideas.
Key Features of Accounts Payable Dashboards
Real-Time Monitoring and Alerts
You need to know what happens with your money right away. An accounts payable dashboard lets you watch everything as it happens. You can see each step of invoice processing in real time. If something is wrong, the dashboard sends you an alert. This helps you fix problems before they get bigger. You can spot late payments or missing documents fast. You also notice errors quickly. Real-time reports show spending patterns and anything strange. This makes it easier to follow rules and prepare for audits. You do not have to search through files. All your documents stay together, so you can show them to auditors when needed.
Automated Reporting and Scheduling in FineReport
FineReport is a strong tool for reporting and analytics. You can set up automatic reports to run every day, week, or month. The system sends these reports to your email or phone. You do not need to check the dashboard every day. Scheduled reports help you keep track of payments and cash flow. FineReport also automates three-way matching between purchase orders, invoices, and receipts. This lowers human error and helps you follow company rules. Automation saves time and makes your work more accurate.
Get reports sent to you on a schedule.
Cut down manual work with automatic data updates.
Make sure all your records match before you pay.
Customizable KPIs and Metrics
You can pick which kpi to track in your dashboard. This helps you focus on what matters most for your business. You can change your kpi list as your company grows or your goals change. The dashboard shows important numbers in a table like this:
KPI Name
Description
Days Payable Outstanding (DPO)
Average number of days it takes for a company to pay its bills. A higher DPO is desirable for cash flow.
Cost per Invoice
Average cost of processing a single invoice. High values indicate inefficiencies.
Invoice Cycle Time
Average time to complete the invoice payment cycle. High values can lead to late payment penalties.
Invoice Exception Rate
Percentage of invoices requiring manual intervention due to issues. High rates slow down the process.
Payment Error Rate
Measures accuracy of payments. High rates indicate problems in processes or staff.
Error Resolution Time
Time taken to correct identified errors. High values suggest inefficiencies in the resolution process.
Invoices Processed per Year per FTE
Efficiency indicator for accounts payable staff. Low values suggest room for improvement.
Accounts Payable Expense as a Percentage of Revenue
Indicates the cost of accounts payable relative to revenue.
You should match your kpi choices with your business goals. Check your metrics often to make sure they still help you. Change your dashboard as your business or technology changes. You can also track things like fraud detection rates and compliance audits. This helps you keep your accounts payable process safe and efficient.
Business Benefits of Accounts Payable Dashboards
Improved Efficiency and Accuracy
Using an accounts payable dashboard makes your work faster and more correct. You do not need to look through lots of invoices or worry about missing payments. The dashboard puts all your invoices in one place and updates them right away. You always see the newest numbers and payment statuses. You can find mistakes before they turn into big problems. The table below shows how dashboards help you do your job better:
Benefit
Description
Real-time Data Tracking
Lets you process invoices and payments faster, which helps cash flow.
Integration of Systems
Gives you a clear view of your money and keeps things accurate.
Helps you check how you are doing and fix issues quickly.
You save time because you do not have to type in data yourself. The dashboard checks for errors and helps you follow company rules. You can trust your invoices are right and paid when they should be.
Enhanced Financial Visibility and Decision-Making
An accounts payable dashboard gives you a clear look at your company’s money. You see which invoices are waiting, which are paid, and which need your attention. This helps you plan your cash flow and avoid paying late fees. You can make smart choices because you have the right information when you need it.
You see payment statuses and unpaid invoices easily, so you know what to do.
You use real-time data to make quick and good decisions.
You manage cash flow better by watching invoices and paying on time.
With this clear view, you can react fast to changes and keep your business running well.
Use Cases and Success Stories
Many companies get great results after using an accounts payable dashboard. Some businesses say they get back three to five times what they spend in the first year. One company that handled 1,000 invoices each month got a 269% return after switching to automation.
BOE, a big technology company, used FanRuan’s tools to fix problems with scattered data and slow invoice processing. After using FineReport, BOE lowered inventory costs by 5% and made their work 50% faster. The dashboard helped them track invoices, compare how factories were doing, and make better choices. You can get results like these by putting all your invoices and accounts payable work into one easy dashboard.
Common Metrics in Accounts Payable Dashboards
Invoice Status and Aging
You need to know where your invoices stand at all times. Accounts payable dashboards help you track invoices by showing their status—pending, due, or completed. You see which invoices need your attention right away. Most dashboards use tables to display this information clearly.
Method
Description
Vendor payment status dashboard
Tracks vendor payment statuses, categorizing them into pending, due, and completed payments.
Provides real-time visibility into accounts payable aging, overdue payments, and cash outflows.
You also see AP aging charts that group unpaid invoices by how old they are. These charts often use 30-day buckets, so you can spot overdue invoices quickly. This helps you avoid late fees and keeps your cash flow healthy.
Days Payable Outstanding (DPO)
Days Payable Outstanding, or DPO, tells you how long your company takes to pay suppliers. Most companies have a DPO between 30 and 90 days. You can use your dashboard to see if your DPO matches the industry average. The dashboard gives you real-time insights into your payment habits. You can compare your numbers to other companies and find ways to improve.
Track how long it takes to pay invoices.
Benchmark your DPO against industry standards.
Spot trends and make changes to pay on time.
When you keep an eye on DPO, you manage your cash better and build trust with vendors.
Payment Cycle Time and Early Payment Discounts
You want to know how long it takes to pay invoices from start to finish. The payment cycle time measures this process, from when you get an invoice to when you pay it. Dashboards show you the total invoice cycle time, so you can find slow steps and fix them. If you pay invoices early, you might get discounts from suppliers. Your dashboard tracks how many early payment discounts you capture. This saves your company money and makes suppliers happy.
See the full journey of invoices, from arrival to payment.
Find chances to pay early and save money.
Improve your process by watching these numbers closely.
Tracking these metrics helps you streamline your accounts payable process. You keep your cash flow strong and your vendors satisfied.
Who Uses Accounts Payable Dashboards
Finance Teams and Managers
If you work in finance, you use accounts payable dashboards. These dashboards help you watch cash flow and keep invoice costs low. You check important numbers and look for problems to keep payments smooth. You can get early payment discounts if you act quickly. Dashboards also help you get ready for audits by keeping things neat.
Managers use dashboards to make sure payments are on time. This helps you build good relationships with vendors. You see which invoices need help and avoid paying late fees. Dashboards show you patterns and help you find problems early.
Some people who use accounts payable dashboards are:
Accounts payable team members watch cash flow and invoices.
Managers make sure payments are on time and vendors are happy.
Auditors check dashboard records to see if rules are followed.
Financial analysts use dashboards to find patterns and make things better.
Integration with Broader Financial Systems
You connect accounts payable dashboards to other financial tools for better control. This lets you see all your company’s money in one place. You can see payments, invoices, and cash flow together. Real-time sync with ERP systems makes your data more correct and easy to see.
Feature/Benefit
Description
ERP integrations
Real-time sync with financial systems makes data more correct and easy to see.
Centralized reporting dashboards
Shows all your financial data in one place for better choices.
Invoice capture and digitization
Takes in invoices automatically, so you do less work and make fewer mistakes.
Approval workflows
Makes approvals faster and easier, so you follow rules and save time.
Audit trail
Keeps a clear record so you can check your work and follow the rules.
Cash flow visibility
Lets you track cash in real time for better planning.
Scalability
Handles more work as your company grows and works with your other systems.
You may have problems when setting up dashboards. Typing in data by hand takes a lot of time and can cause mistakes. Slow approvals can make you miss discounts. If you cannot see all your data, you might have cash flow trouble. If your records are not right, you could have compliance problems. Handling many vendors is hard without good systems.
To do well, try these steps:
Get your finance team to agree on using dashboards.
Pick someone to lead the dashboard project.
Connect dashboards to your current tools.
Use real-time numbers to watch how things are going.
Make a plan to keep your business running if something goes wrong.
Accounts payable dashboards help you run your finances better and make smarter choices.
Using a modern accounts payable dashboard changes how you handle money. You get touchless processing, all your data in one place, and can see spending right away:
Benefit
Description
Touchless processing
No manual entry means fewer mistakes and more free time.
Enhanced spend visibility
You see spending in real time, so you manage budgets better.
Improved accuracy
Trusted data helps you feel sure about your numbers.
FineReport from FanRuan gives strong data entry, teamwork tools, and real-time checks. Dashboards show KPIs fast, help you watch spending, and find slow spots quickly. You make better choices and work more efficiently every day.
Product Trial
FineReport
Pixel-perfect reports · Interactive dashboards · Easy data entry · Digital twins
Access a wealth of case studies, industry insights, and solution guides to accelerate digital transformation.
FAQ
What is an accounts payable dashboard?
An accounts payable dashboard shows you all your company’s bills and payments in one place. You can track invoices, see payment status, and watch cash flow. This tool helps you manage money better and avoid mistakes.
How does FineReport connect to my financial systems?
FineReport links directly to your ERP or accounting software. You do not need to enter data by hand. The dashboard updates in real time, so you always see the latest numbers.
Can I customize the dashboard for my team?
Yes! You can change the layout, choose which charts to show, and set alerts for important events. FineReport lets you build a dashboard that fits your team’s needs.
Who should use an accounts payable dashboard?
Finance teams, managers, and auditors use dashboards to track payments and spot problems. Anyone who needs to see company spending or manage invoices will find this tool helpful.