
ENTERPRISE REPORTING · NOW AI-READY WITH DORA
Reports Your Team Builds Once. Dora Delivers Forever.
Pixel-perfect formatting, any data source, any complexity — FineReport handles the hard stuff so your team stops rebuilding and starts deciding.
Free 30-day trial • No credit card required • Full features

Trusted by 43,000+ Enterprises Worldwide

benefits
Built to Report. Ready to Deliver.

Drag-and-Drop Simple
Build pixel-perfect reports visually — formatting, grouping, sorting, and calculations all included. No code, no IT ticket, no back-and-forth.
90% less IT dependency

Built Once, Delivered Forever
Schedule report generation and let Dora push results to every stakeholder — briefings, alerts, and summaries, delivered automatically to Slack, Teams, or email.
Zero manual distribution

Scale & Connect
Connect to any data source, handle millions of records, and embed reports directly into your existing business systems.
70+ data connectors
features
Everything You Need, Out of the Box
Flexible Report Designer
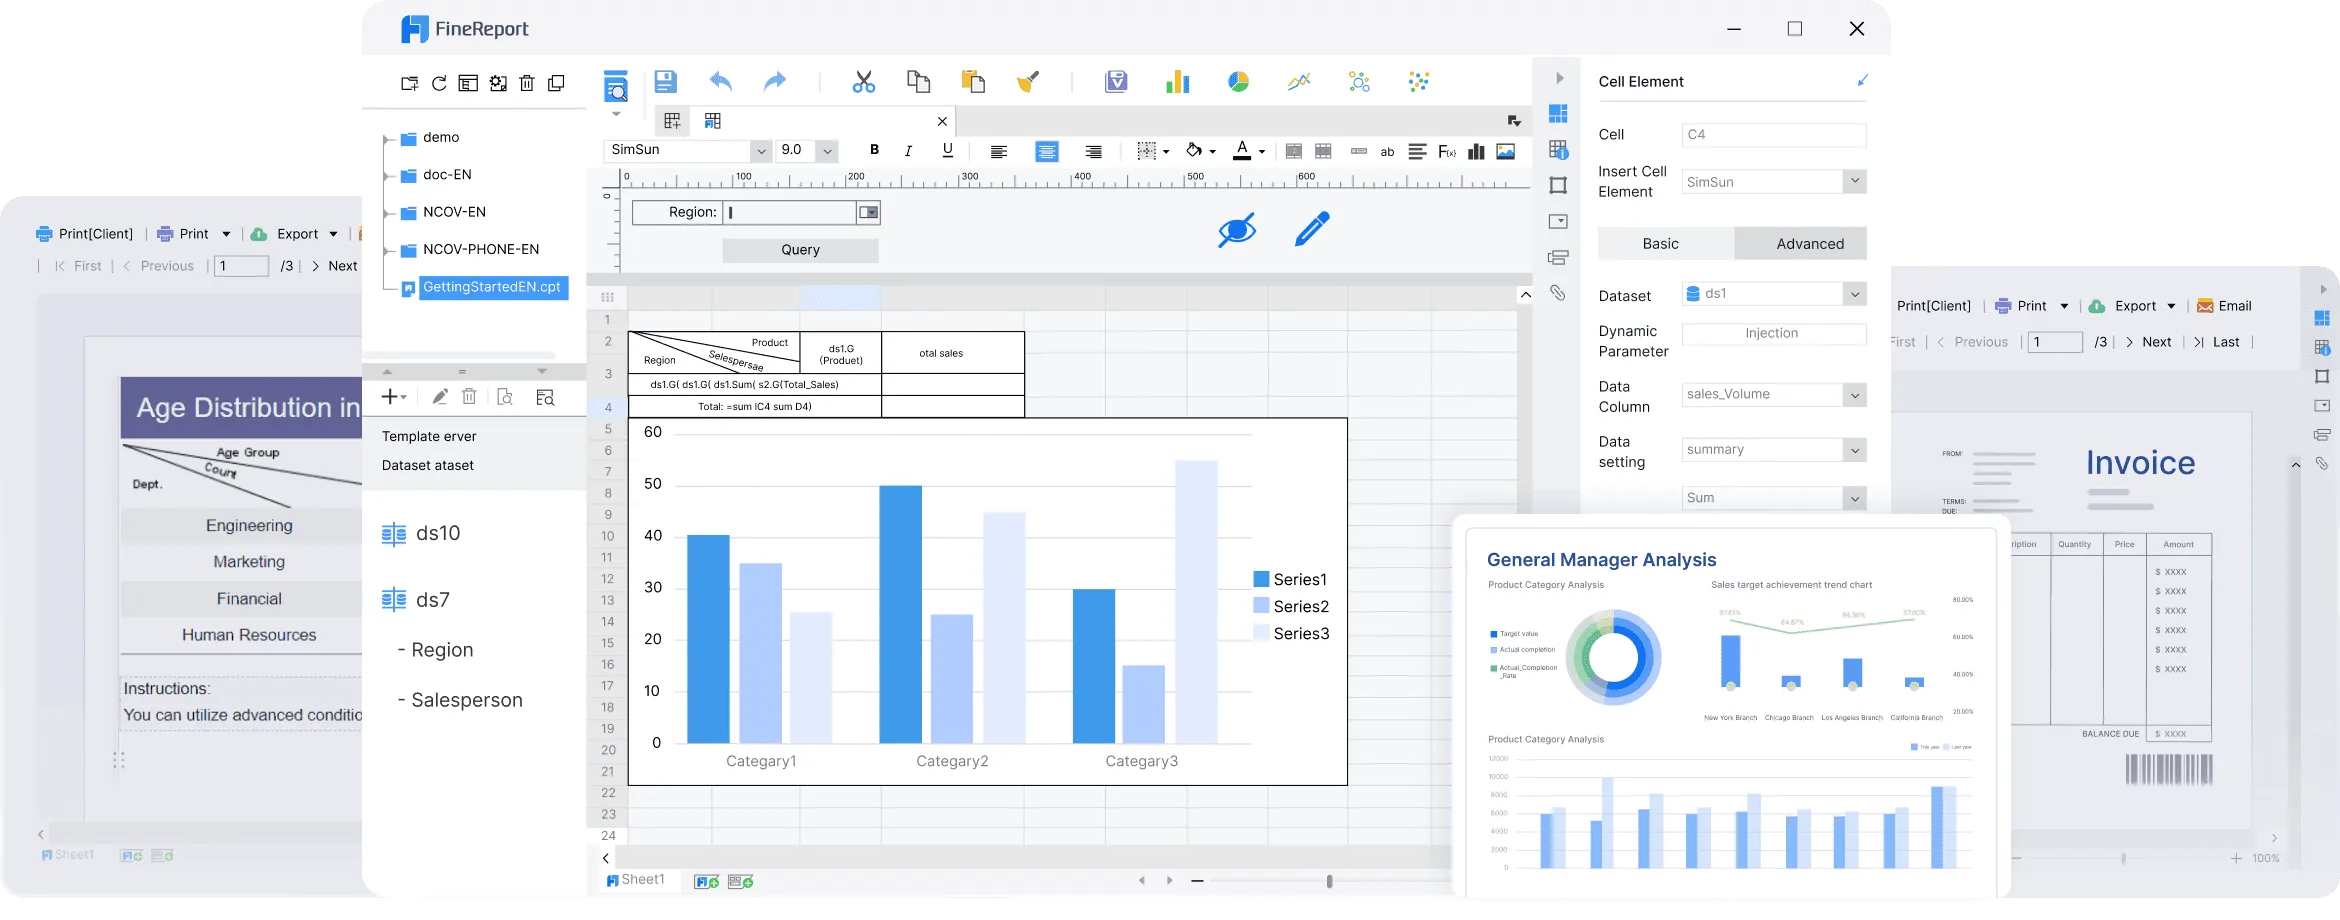
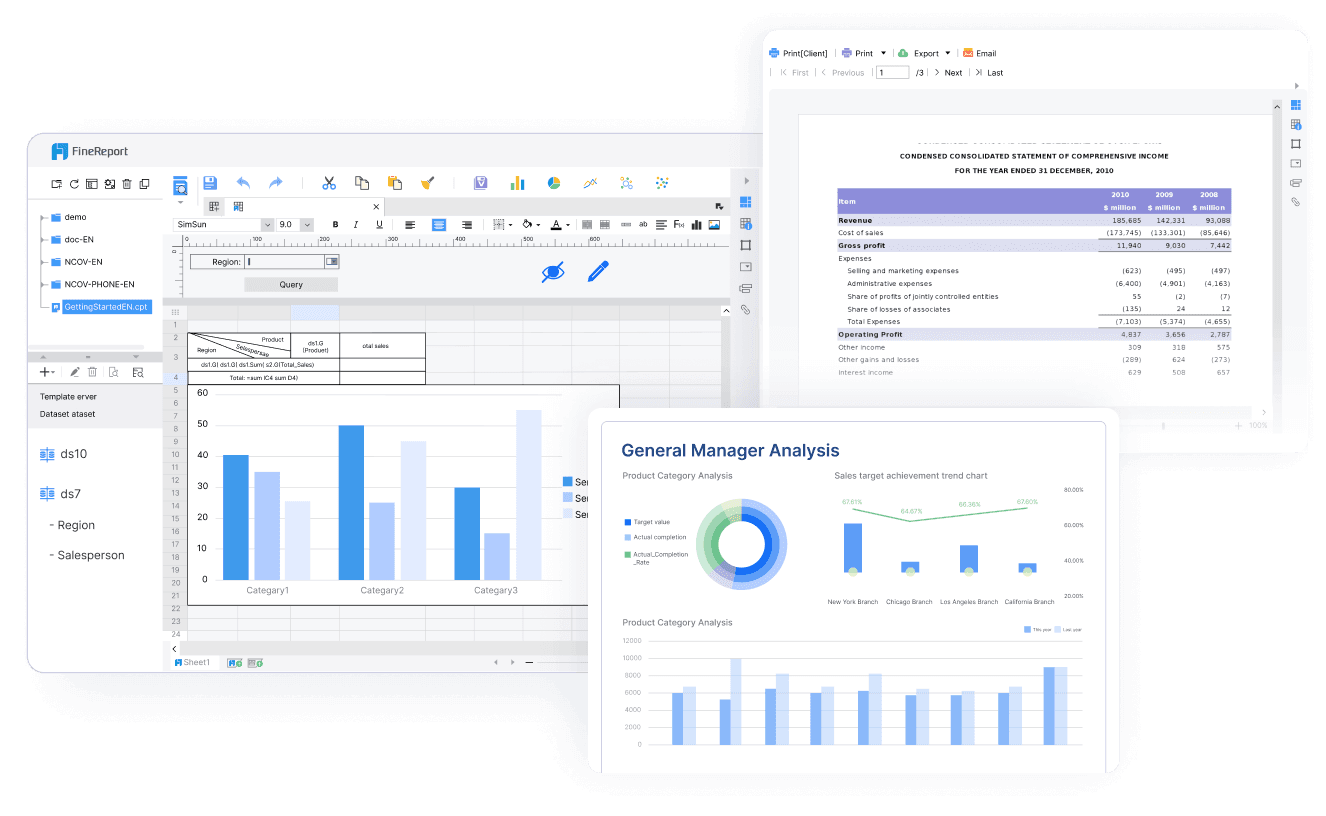
- Design any report visually — complex tables, formatted layouts, irregular structures — all drag-and-drop, no code required.
- Import existing Excel reports with formulas intact, or export directly to Word with charts and data embedded.
- Build once, reuse everywhere — templates, components, and layouts that scale across your organization.
Diverse Visualization Types
- 60+ chart types out of the box — from standard bar and line charts to flow maps, heat maps, and custom GIS and indoor building maps.
- Works everywhere your team works: PC, mobile, tablet, and LED video walls, all from the same report.
- Extend with third-party libraries like ECharts for even more visualization flexibility.
Interactive Analysis
- Let users filter, drill down, and explore data on their own — no analyst required, no new report needed.
- Dropdown, date picker, text search, tree filters — configure the controls your business actually uses.
- Cross-chart linkage and multidimensional drill-down turn static reports into live analysis tools.
Data Entry
- Collect data directly inside your reports — text, numbers, files, photos, scans, and NFC, all in one place.
- Batch import from Excel or capture data on mobile — no separate forms tool needed.
- Built-in validation and approval workflows keep data clean from submission to sign-off.
Deployment & Integration
- Deploy on Windows, Linux, or macOS — on-premise, private cloud, or hybrid, however your security team requires.
- Embed reports directly into CRM, ERP, OA, and other business systems via SSO and rich APIs.
- Bidirectional data transfer keeps your reporting system and business systems always in sync.
Decision-Making Platform
- One centralized portal for all reports, dashboards, and business themes — with role-based access control built in.
- Set data monitoring rules and receive automated alerts the moment something looks off.
- Want AI-powered monitoring? Pair with Dora to go beyond alerts — auto-generate summaries, push to stakeholders, and close the loop automatically.
Task Schedule
- Set it once — reports go out daily, weekly, monthly, or quarterly without anyone lifting a finger.
- Deliver to any channel: email, FTP, or mobile, with centralized task management to keep everything on track.
- Want smarter delivery? Pair with Dora to add AI summaries, anomaly alerts, and follow-up actions to every scheduled report.
Report Export & Printing
- Export to any format your stakeholders need — PDF, PPT, Excel, Word, CSV, SVG, PNG, JPG, and more.
- Batch print across any paper size or printer brand — invoices, delivery notes, and operational documents included.
- Full barcode support: 1D and 2D formats, ready for logistics, manufacturing, and compliance workflows.
Built for the Reports Your Industry Actually Needs
Every industry has its own reporting complexity — regulatory formats, operational cockpits, multi-level approvals, cross-system data. FineReport comes with industry-specific solutions pre-configured, so your team solves real business problems from day one instead of building from scratch.

Hospital Medication Management Solution
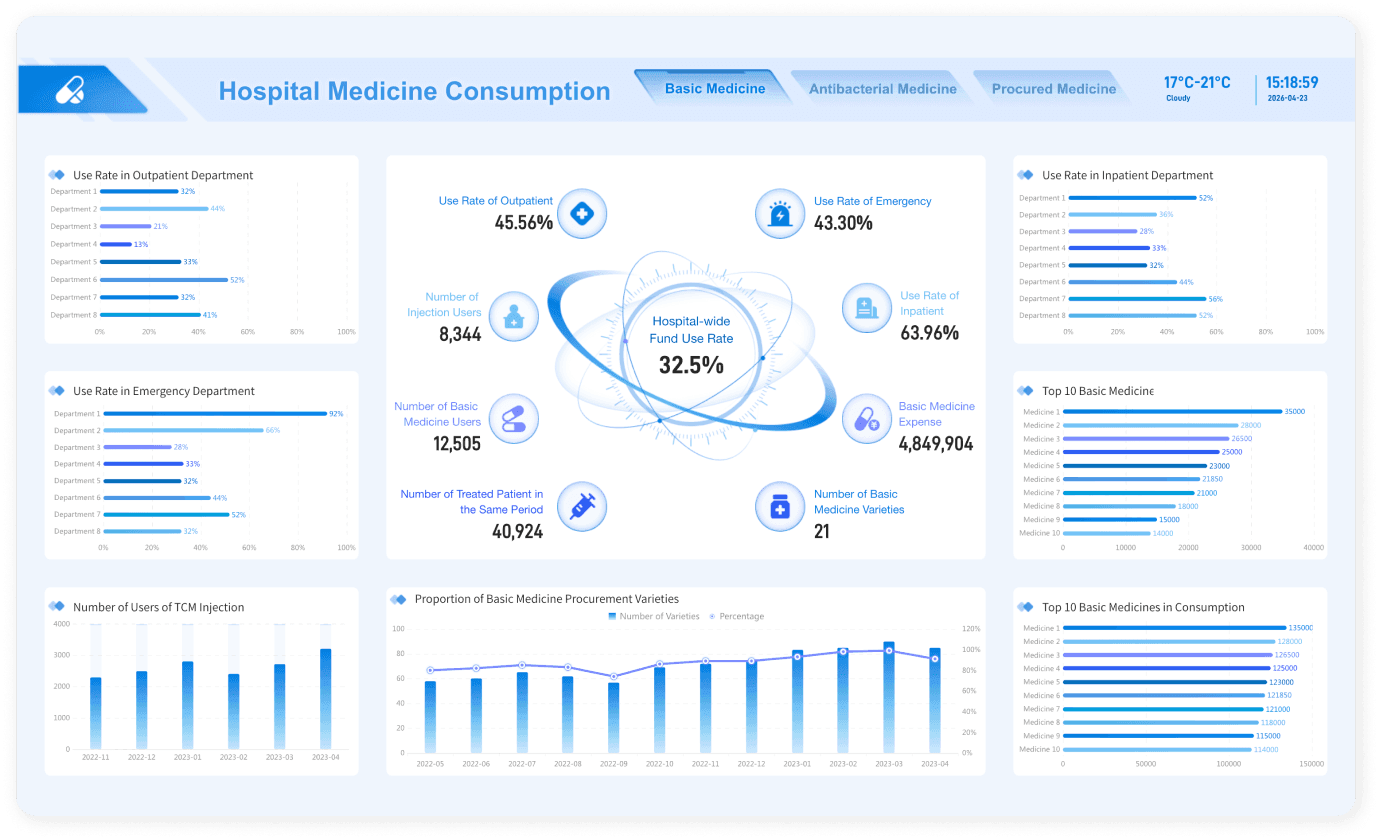
Monitor drug utilization across outpatient, inpatient, and emergency departments in one unified view. Track fund use rates, procurement varieties, and top-consumed medications — giving pharmacy directors and clinical administrators the visibility to act before issues escalate.
Regional Retail Network Solution
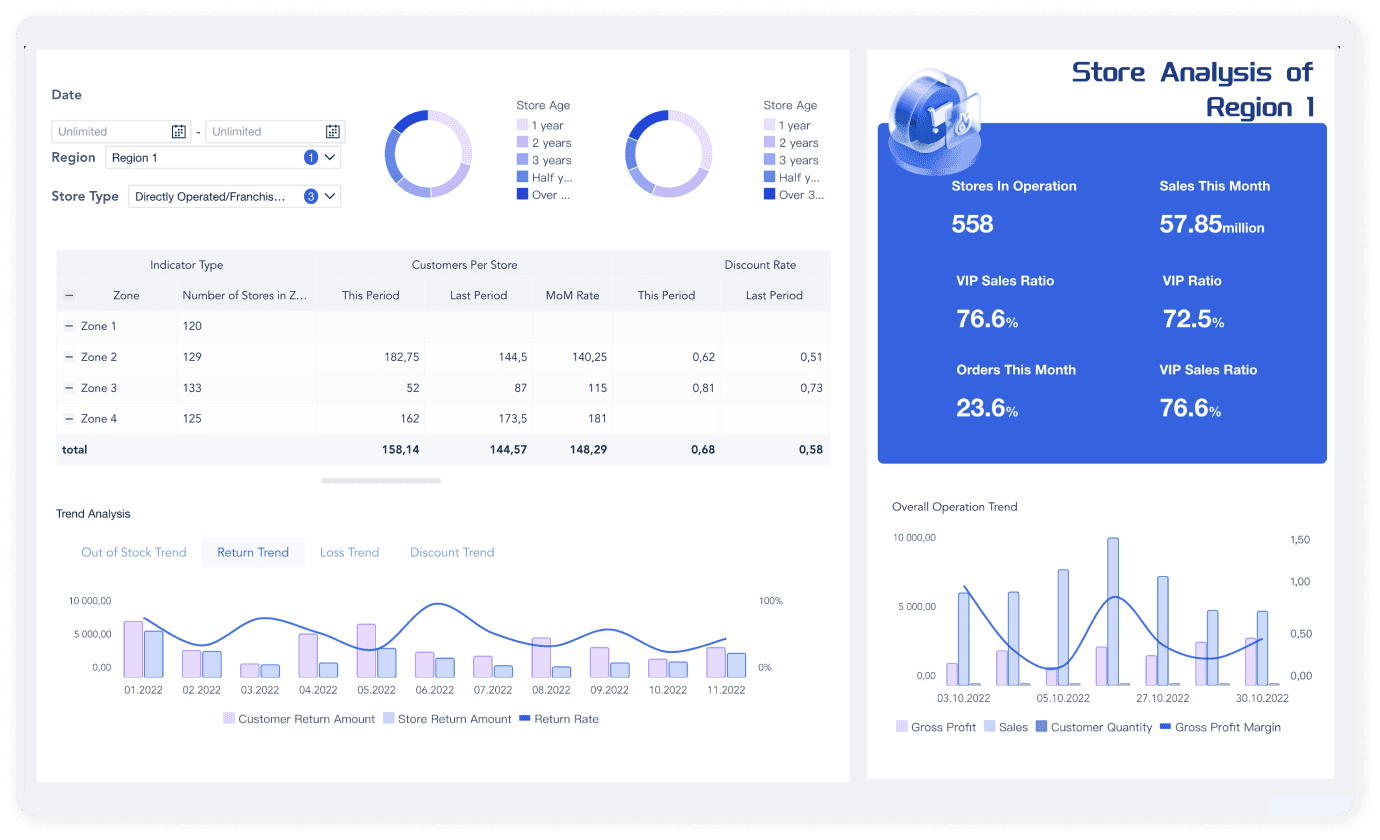
Compare performance across zones and store types — from directly operated to franchise locations. Track VIP sales ratios, return trends, discount impact, and monthly revenue shifts, giving regional managers and retail operations teams a single source of truth across hundreds of stores.
Multi-Branch Securities Operations Solution
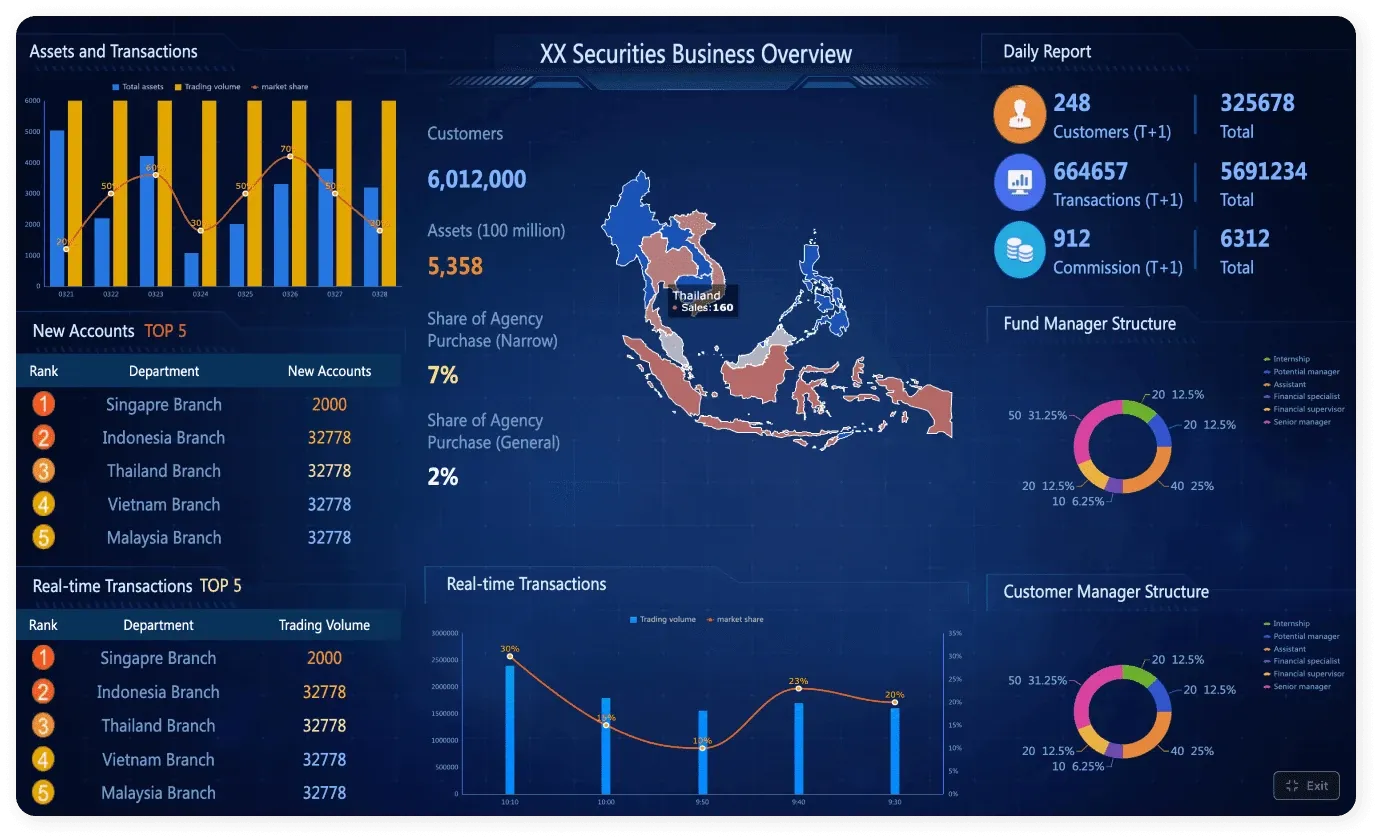
Oversee customer accounts, transaction volumes, and commission performance across regional branches — from Singapore to Vietnam — in a single real-time view. Track new account rankings, agency purchase ratios, and fund manager structures so brokerage heads and regional directors always know where the business stands.
Smart Amusement Park Operations Solution
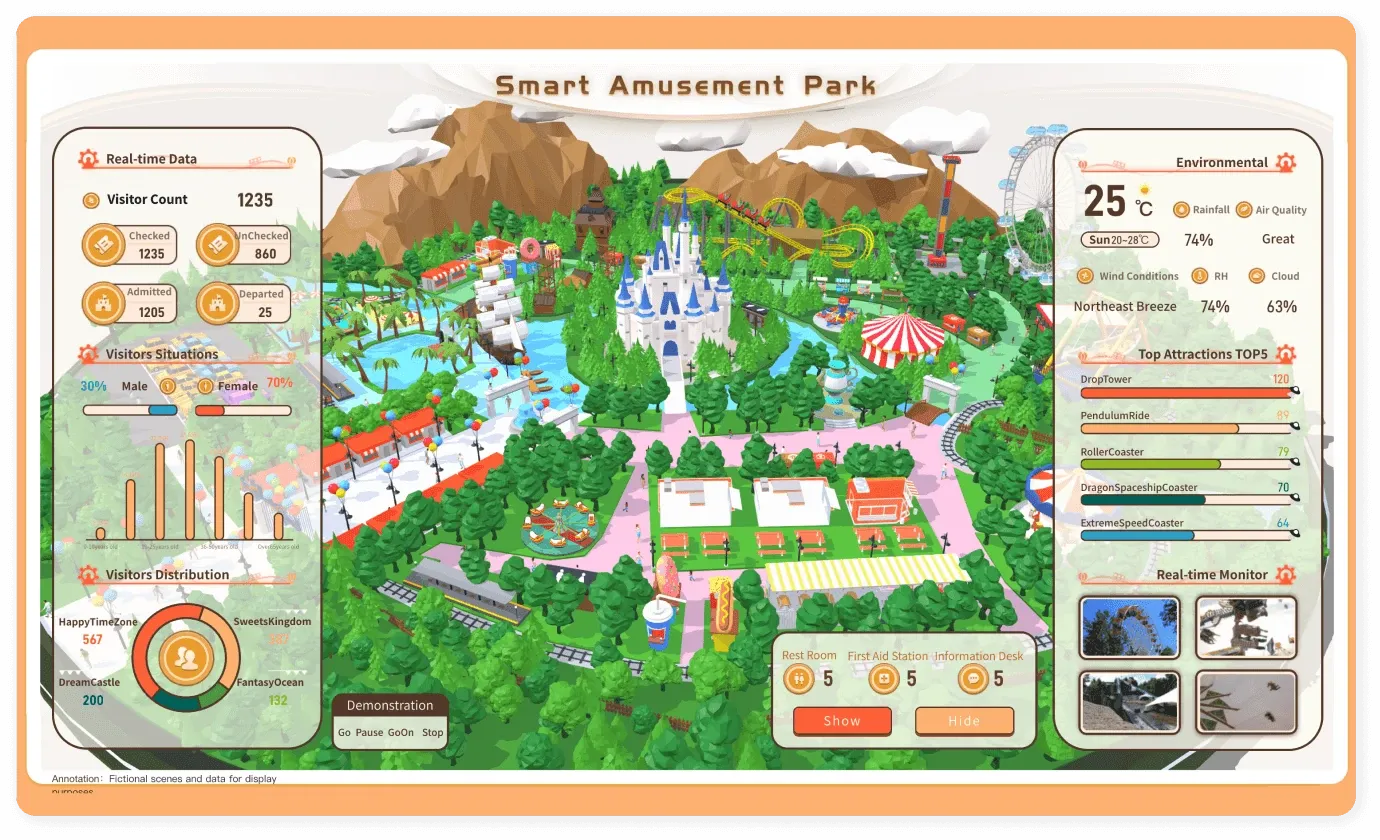
Monitor real-time visitor counts, crowd distribution across zones, and top attraction performance — all overlaid on a live 3D park map. With environmental conditions, facility status, and gender demographics tracked in one view, park operations managers can respond to surges, safety needs, and guest flow before they become problems.
Logistics Transportation Network Solution
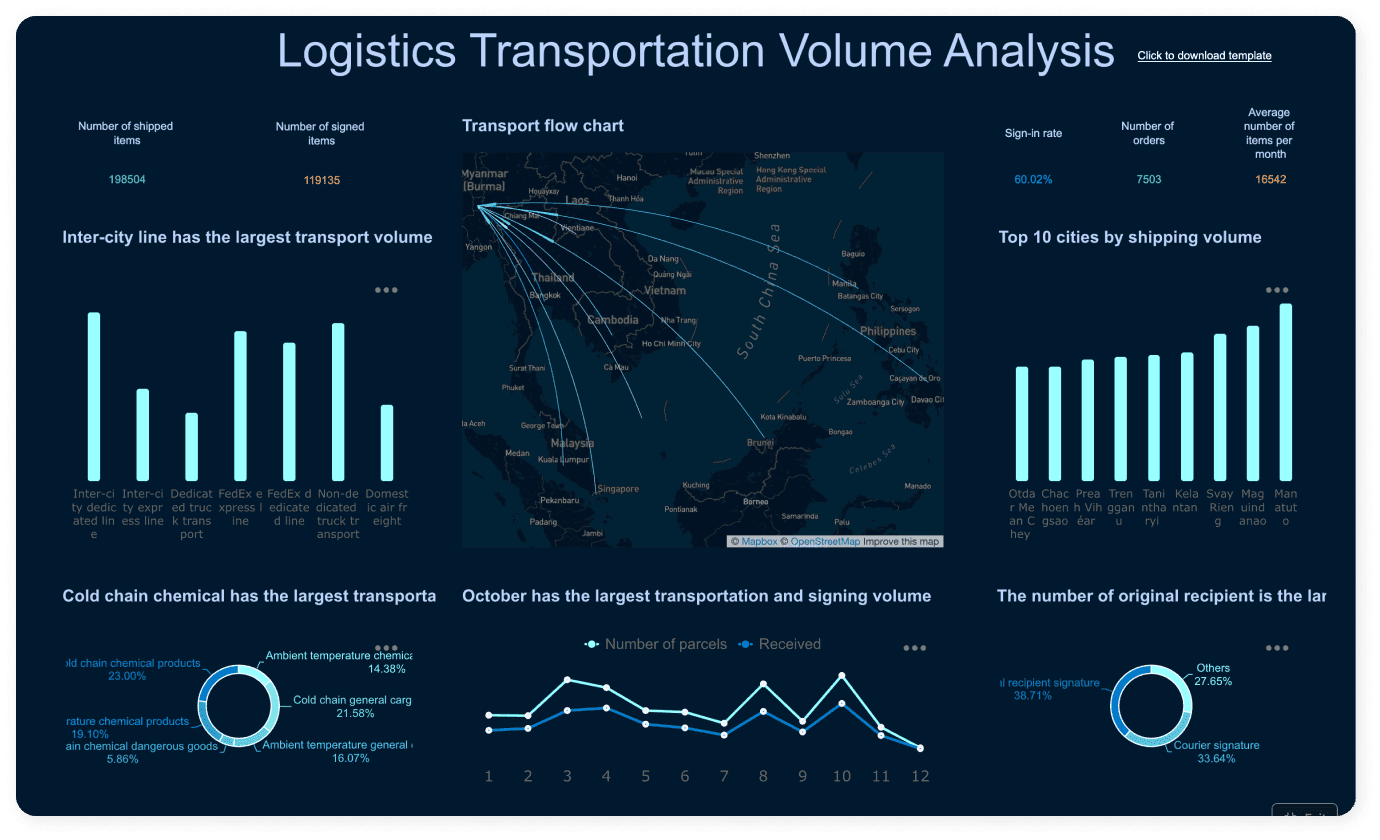
Analyze shipment volumes, sign-in rates, and transport flow across intercity routes and carrier types — from cold chain chemicals to standard cargo. Identify your top-performing cities, peak signing months, and recipient signature patterns so logistics directors and network planners can optimize routes and reduce fulfillment gaps.
Wind Farm Operations & Performance Solution
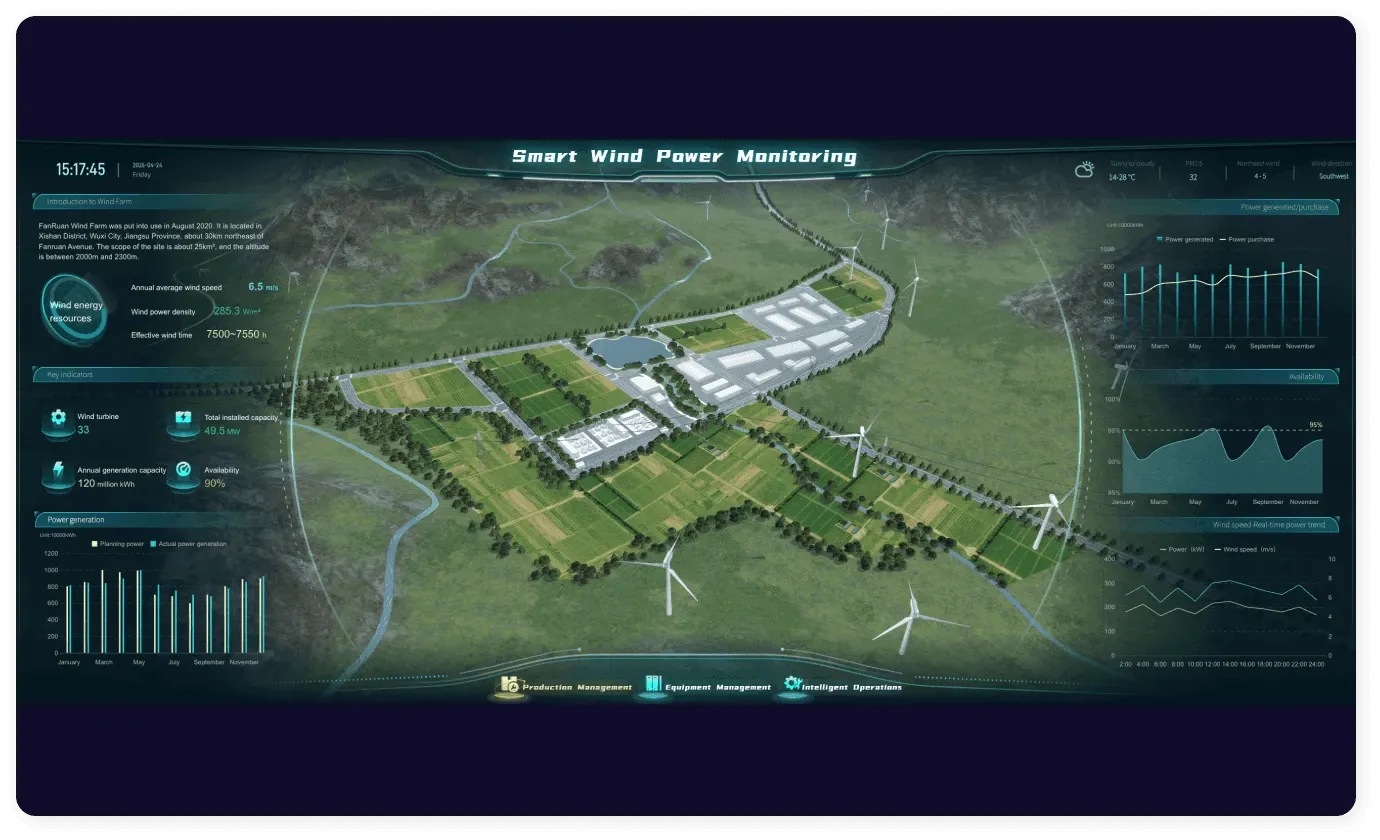
Track turbine count, installed capacity, availability rates, and power generation output across your entire wind farm — updated in real time. Monitor wind speed fluctuations, annual generation trends, and equipment status so asset performance engineers and farm operations teams can act on underperformance before it affects output targets.
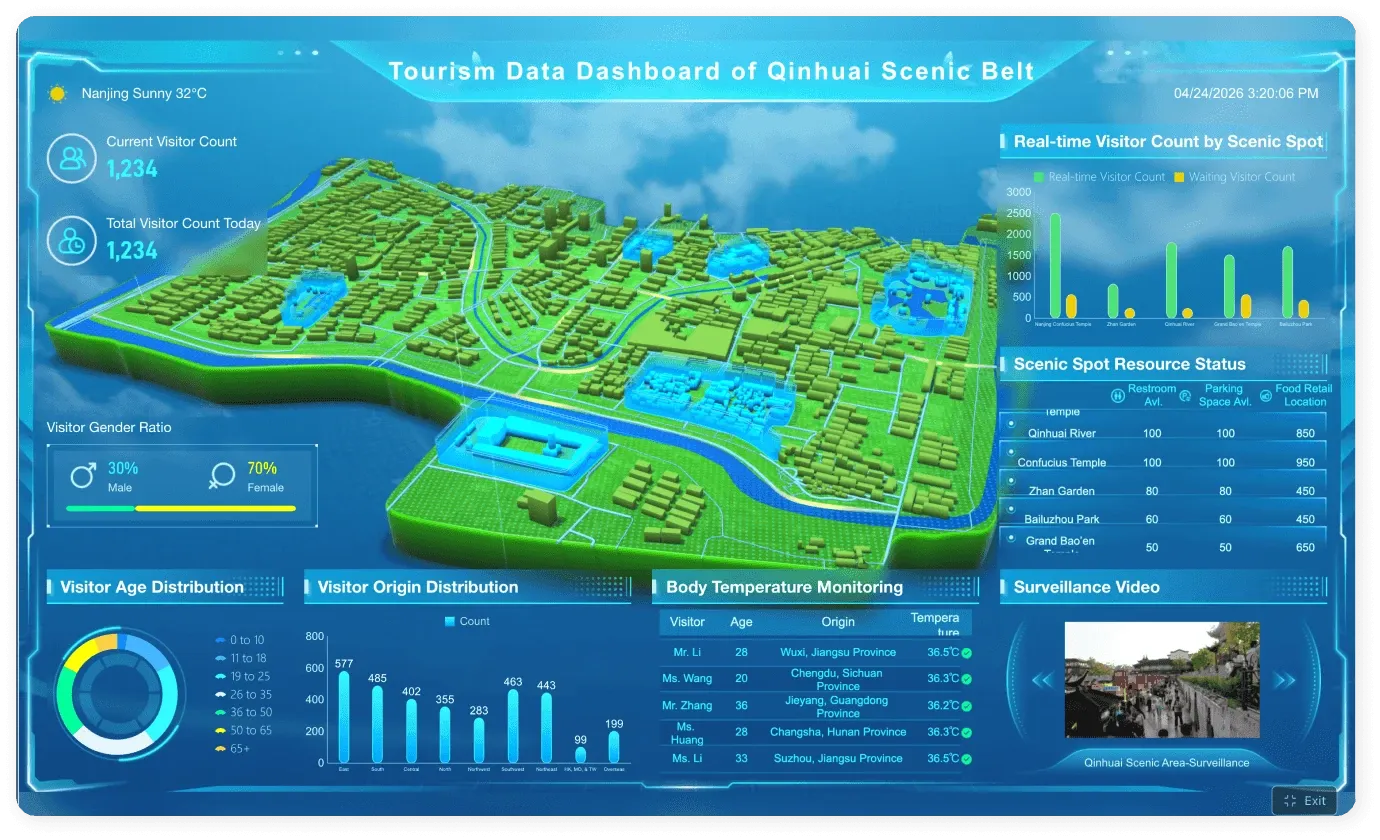
Scenic Destination Visitor Management Solution
Track real-time visitor counts, age and origin distribution, and scenic spot resource status — all mapped across a live 3D destination view. With body temperature monitoring and surveillance feeds integrated, scenic area administrators and tourism authorities have everything needed to manage crowd safety, allocate staff, and optimize the on-site experience.
The Proven Choice for 43,000+ Enterprises

“As you know when we engaged with FanRuan, they implemented very good solutions,which meet our requirement. It's the capital projects development system, the CPDS.”
Mohamed Sayyah AIMansoori
Director, Corporate Strategic Planning and Support Services of ADPIC
Read the story
“By enabling businesses to better understand the meaning behind their data and offering tailored solutions, it empowers organizations to unlock the full potential of their data.”
Hsien-Ju Wu
Senior Consultant, NTT Data Taiwan
Read the story
“With FineReport, production data on our KPI dashboard refreshes every six seconds — enabling real-time workshop monitoring and a 2.8% increase in operational efficiency.”
Wang ChunGuang
Danfoss
Read the story
“TXC Corporation will continue to build a digital collaboration ecosystem between business and IT, enabling data and business to drive each other and create limitless added value, ultimately achieving intelligent enterprise transformation.”
Chen Chhiu Lim
Deputy Manager, TXC Corporation
Read the story