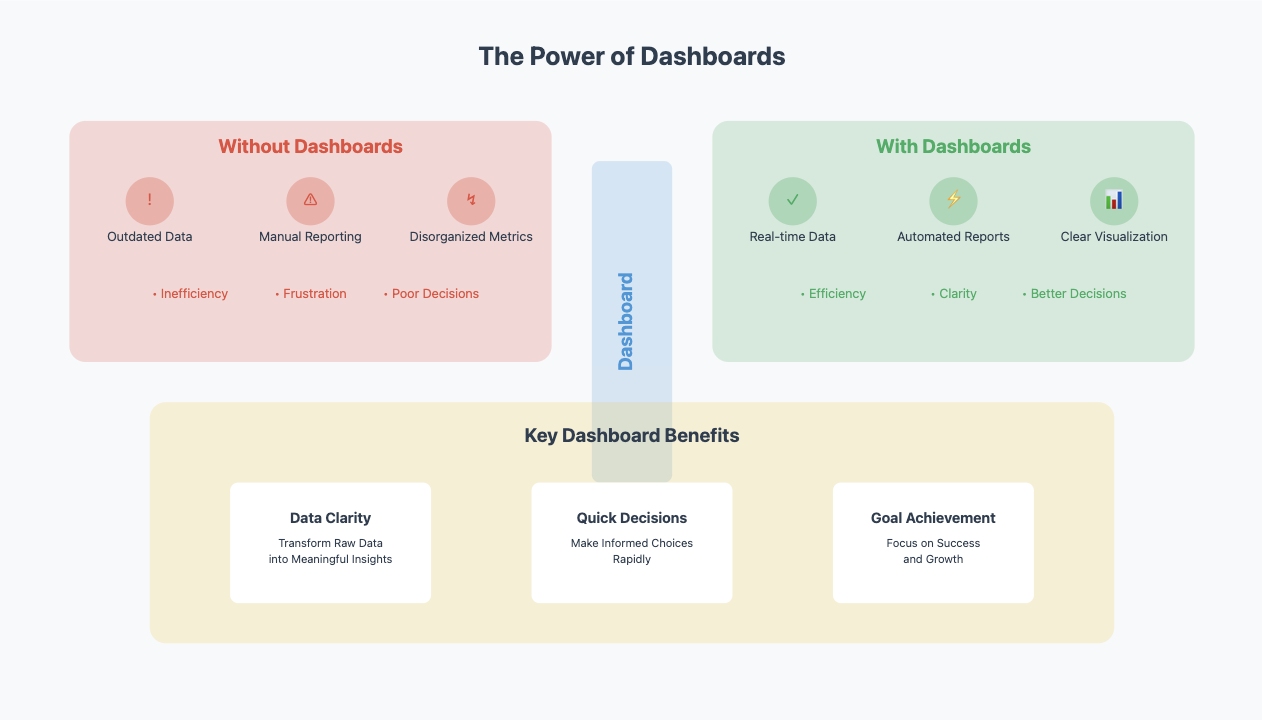
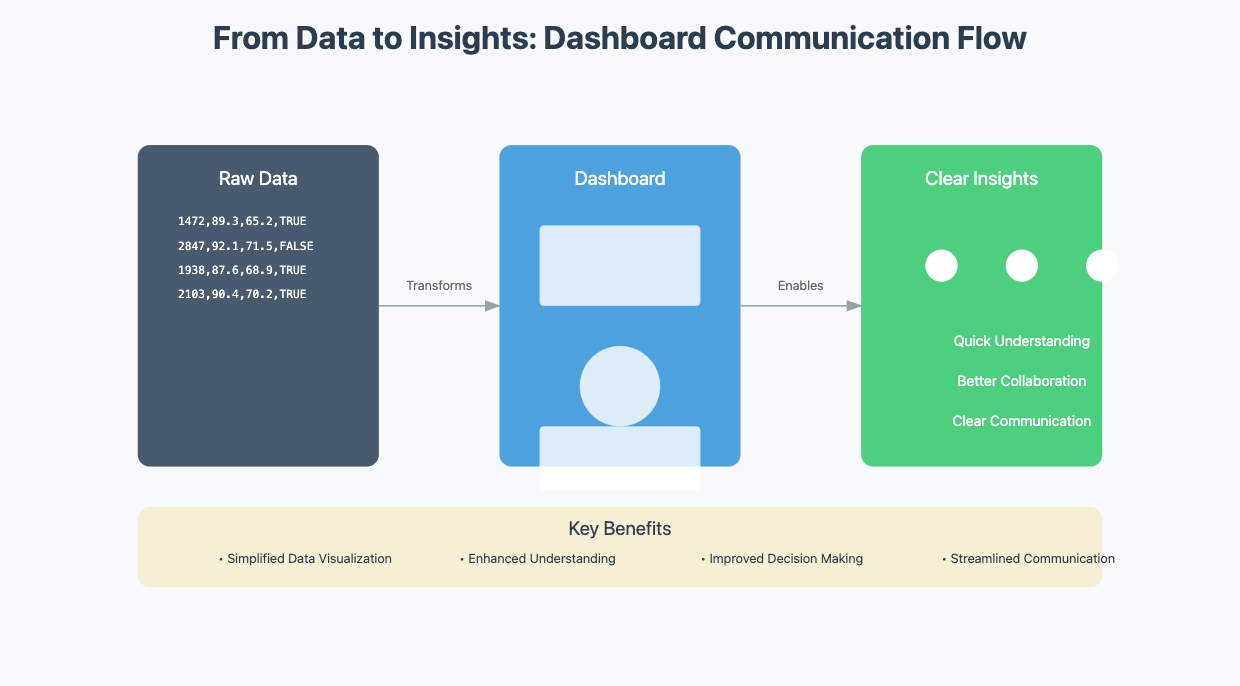
A dashboard, which is a tool that transforms raw data into meaningful visuals, answers the question of what is a dashboard by making complex information easier to understand. It plays a vital role in data visualization by presenting key metrics and trends in a clear, concise format. This helps you make informed decisions quickly. Without dashboards, organizations often face challenges like outdated or incorrect data, labor-intensive manual reporting, and disorganized metrics. These issues can lead to inefficiency and frustration. Dashboards simplify these processes, ensuring you can focus on achieving goals and driving success.
What is a Dashboard? An Overview
Definition and Purpose
A dashboard is a tool that organizes and presents data in a visual format, making it easier for you to interpret and act on. It serves as a centralized platform where you can monitor performance, analyze trends, and gain insights. By simplifying complex datasets, dashboards help you focus on what matters most. Their primary purposes include real-time performance tracking, facilitating decision-making, and enhancing transparency. Dashboards also promote accountability by aligning individual and team goals with organizational objectives. They improve efficiency by automating data collection and reporting, saving you time and effort.
Key Features of a Data Dashboard
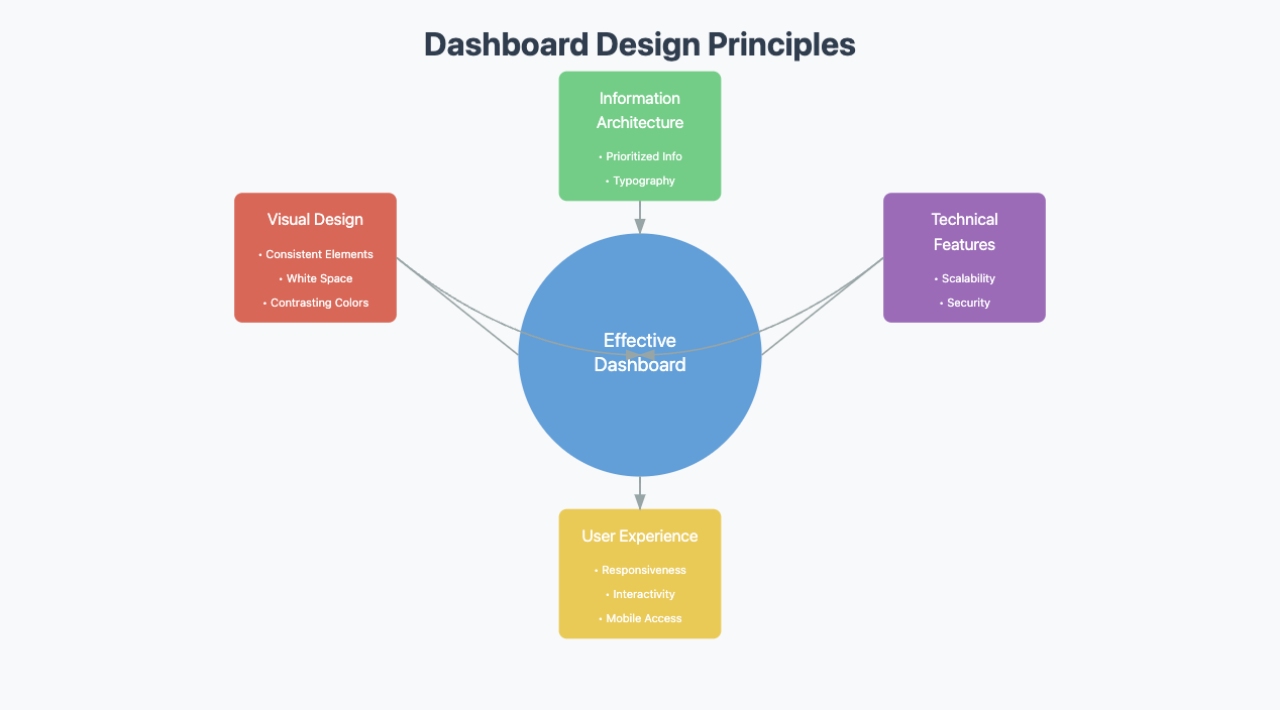
A well-designed data dashboard offers several features that enhance usability and effectiveness. These include:
Consistent design elements to create familiarity.
Prioritized information to highlight critical data.
Responsiveness to fit various screen sizes.
Effective use of white space for readability.
Contrasting colors to emphasize key metrics.
Easy-to-read typography with appropriate font sizes.
Interactive elements like drill-down capabilities for deeper analysis.
Customizability to tailor the dashboard to your needs.
Scalability to handle growing data and user demands.
Robust security to protect sensitive information.
Mobile access for convenience on the go.
These features ensure that dashboards remain user-friendly and efficient, even as your data needs evolve.
Importance in Data Visualization
Dashboards play a crucial role in data visualization by transforming raw data into meaningful visuals. They allow you to see patterns, trends, and relationships that might not be obvious in raw datasets. This simplification helps you make quick, informed decisions. Dashboards also improve communication by presenting data insights in a clear, concise manner. With their ability to highlight key information, dashboards empower you to focus on actionable insights rather than getting lost in the details.
In the healthcare industry, dashboards are used to monitor patient outcomes, hospital occupancy, and staff efficiency in real-time. For example, a hospital dashboard might show ER wait times and bed availability, helping hospitals allocate resources effectively. In retail, dashboards help monitor sales, inventory levels, and customer behavior, enabling businesses to optimize stock levels and improve customer satisfaction.
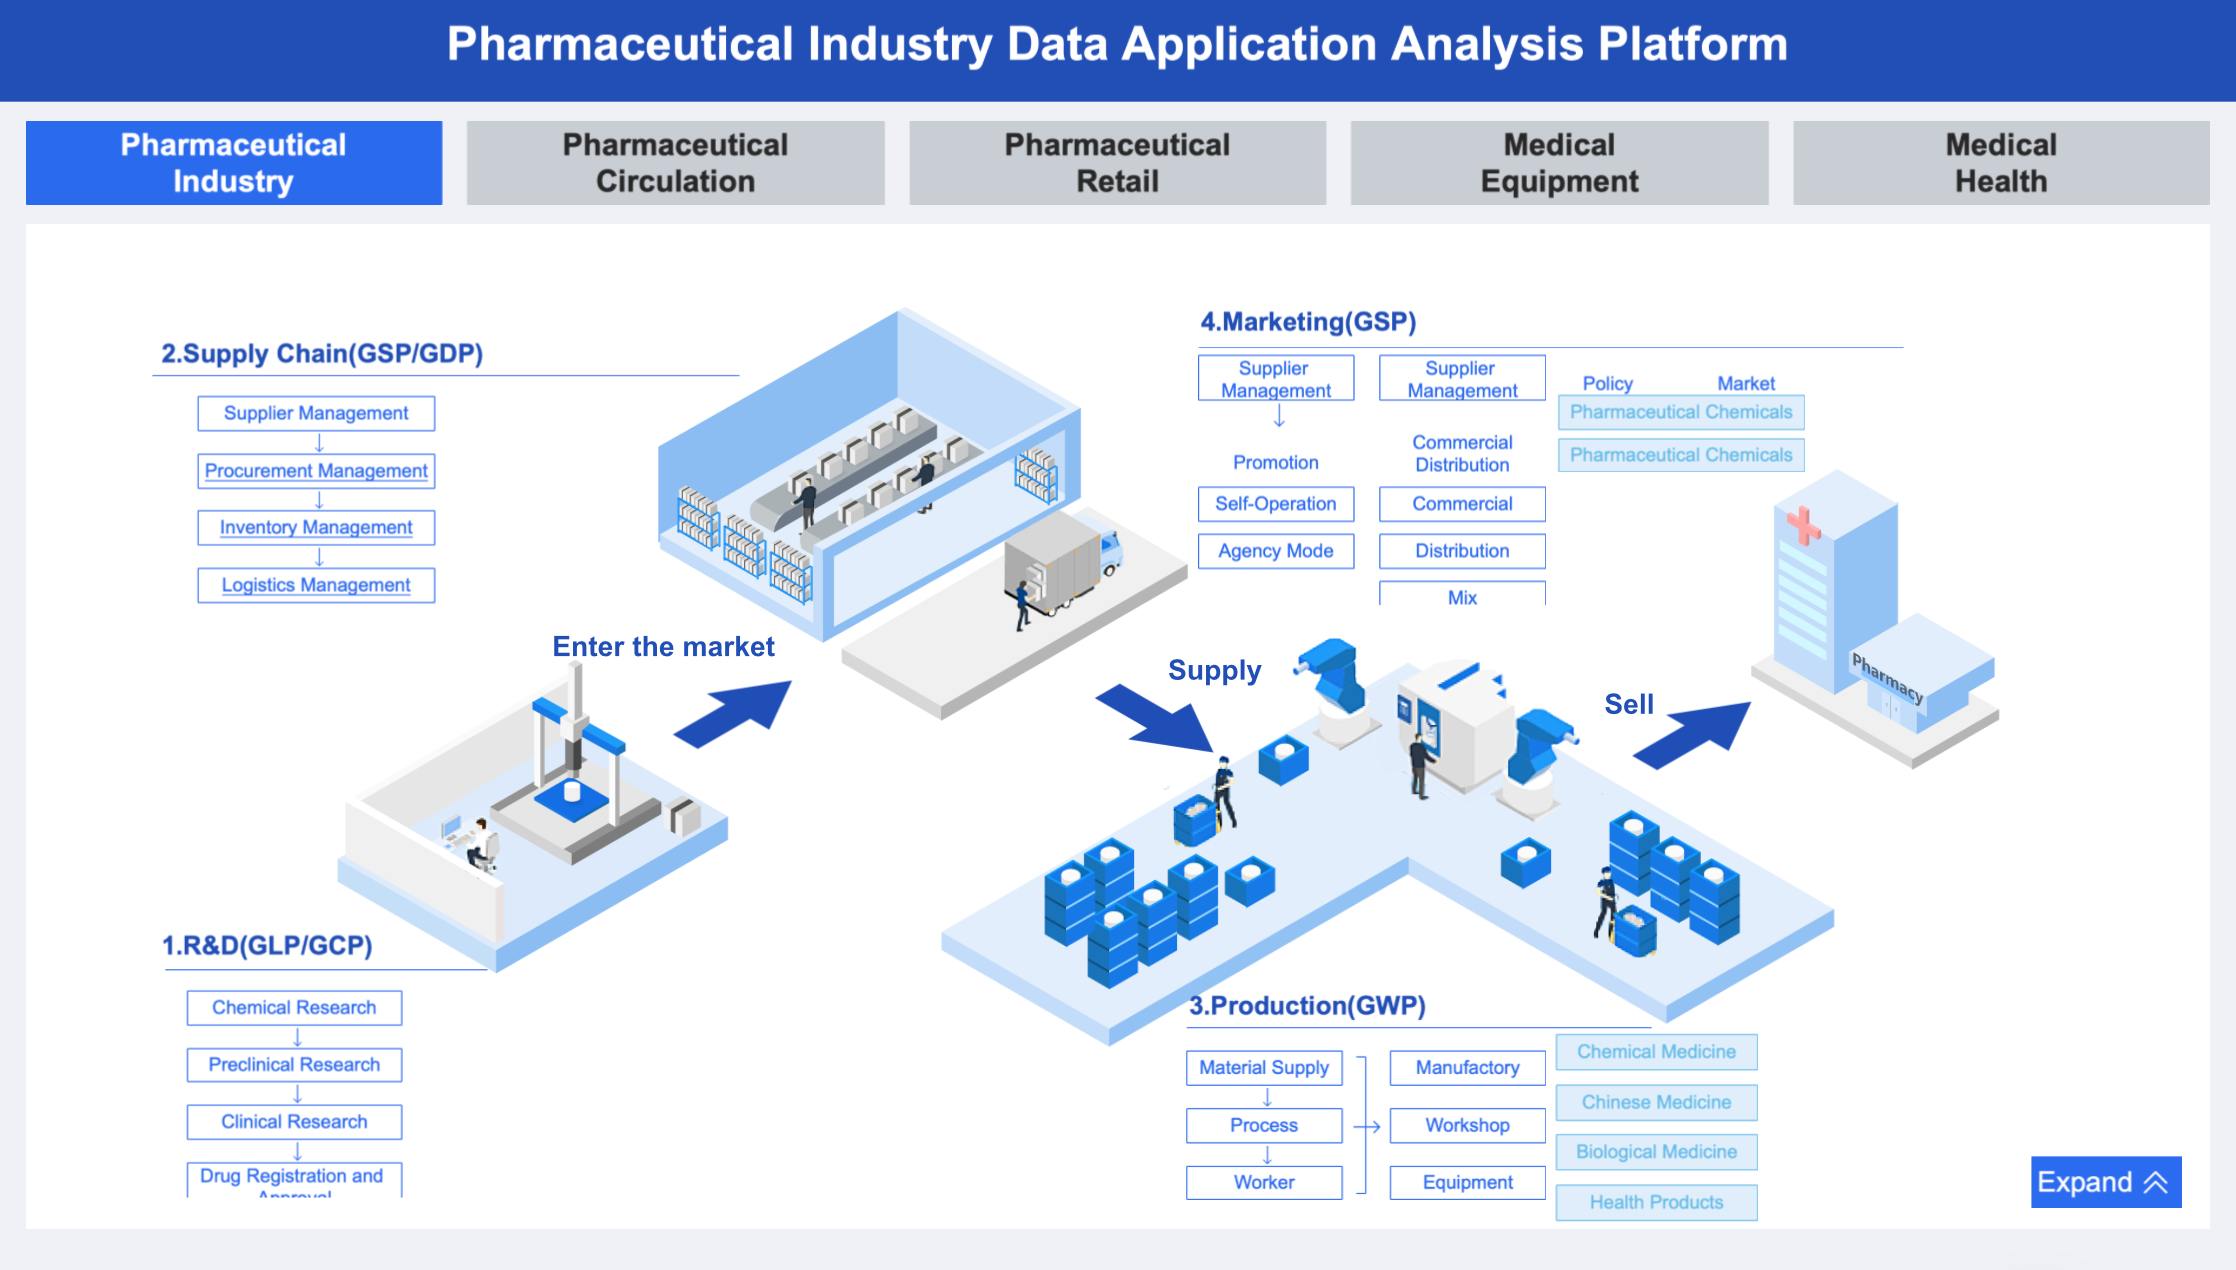
Pharmaceutical Industry Data Application Analysis Platform Created By FineVis
How Dashboards Work: What is a Dashboard’s Function?
Data Collection and Integration
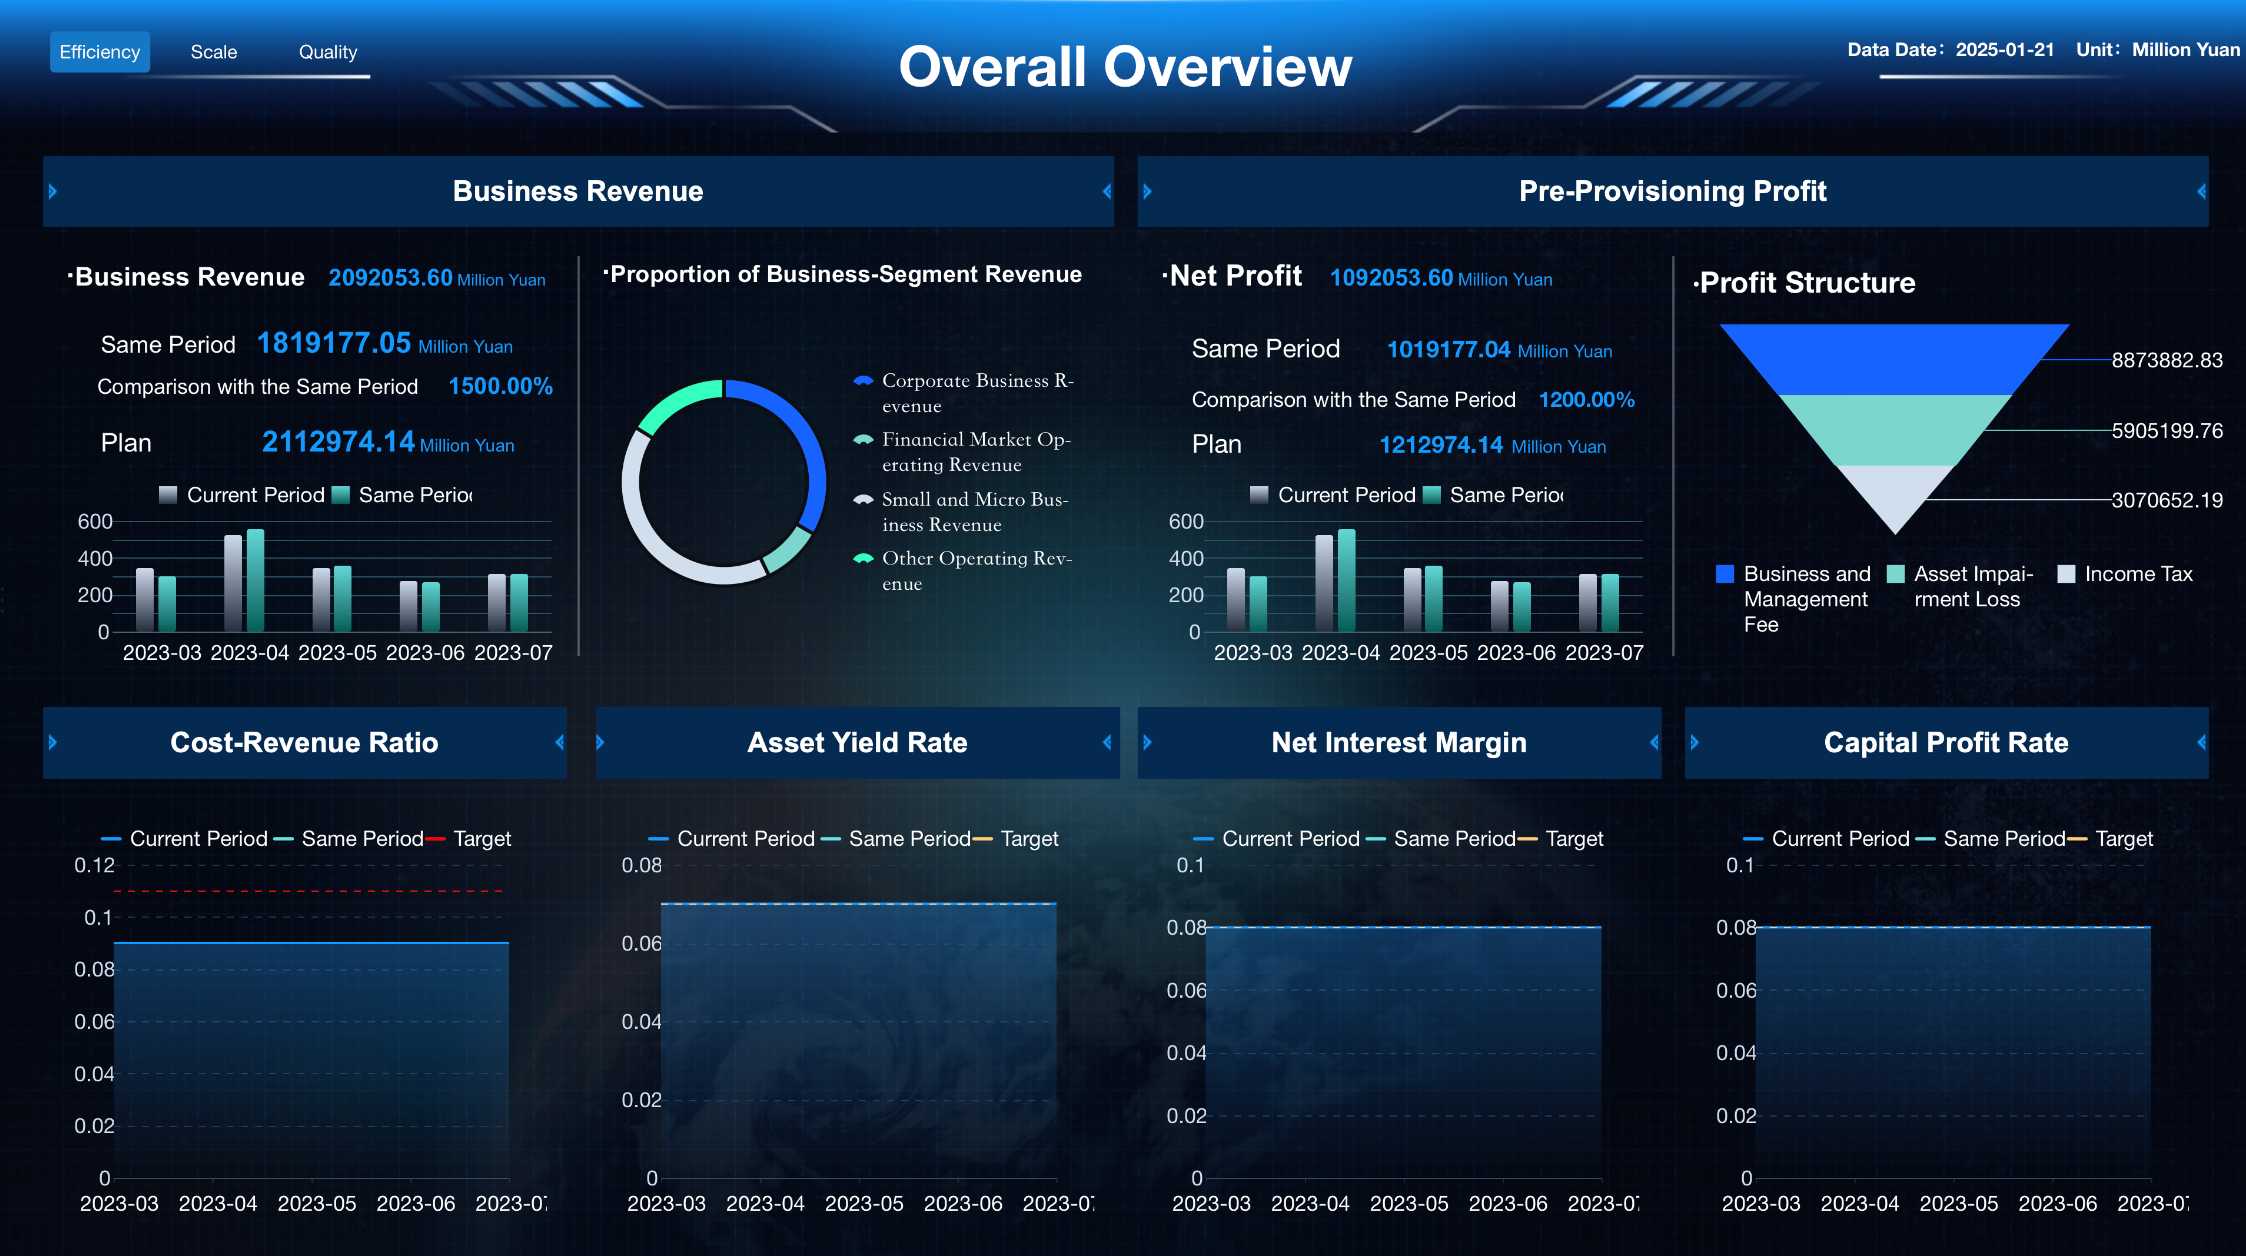
A dashboard collects and integrates data from multiple sources to provide a unified view of your business performance. In finance, dashboards are used to track cash flow, monitor investments, and identify potential risks. For instance, a financial dashboard might track profit margins, expenses, and revenue streams, providing real-time visibility into financial performance and helping businesses make informed decisions faster.
Overall Overview Dashboard Created By Finereport
For seamless integration, tools like FineDataLink by FanRuan can efficiently consolidate data from various sources into a central platform, ensuring accurate and real-time insights. It connects to both internal systems, like CRM or ERP software, and external platforms, such as Google Analytics or social media tools. This integration eliminates the need for manual data processing, saving you valuable time and reducing errors.
To achieve this, dashboards often use automated tools that review and maintain data accuracy. For example, you can build basic reports using tools like Microsoft Excel or Google Sheets. Alternatively, platforms like Databox or Domo centralize reporting into a single automated dashboard. These methods ensure flexibility, allowing you to adapt to changing business needs while exploring data sources in depth.
By consolidating data, dashboards improve operational speed and minimize the need for multiple logins. This comprehensive view helps you make informed decisions faster and more efficiently.
Data Visualization Techniques
Dashboards transform raw data into visuals that are easy to understand. Common visualization techniques include line charts, bar charts, and pie charts. Line charts, for instance, show trends over time, while bar charts compare categories. Pie charts illustrate proportions, making them ideal for understanding distributions.
Tools like FineVis from FanRuan provide advanced graphical elements and dynamic visualizations that help businesses create visually striking dashboards that are easy to interpret and analyze.
Other techniques, like scatter plots and histograms, help you identify patterns and frequency distributions. Area charts emphasize trends by filling the space below the line with color. These visuals simplify complex datasets, allowing you to focus on actionable insights.
Visualization Technique
Description
Line Chart
Shows correlations over time using a line between two axes.
Area Chart
Highlights trends by filling the area below the line with color.
Bar Chart
Compares categories using horizontal or vertical bars.
Histogram
Displays frequency distributions over intervals.
Scatter Plot
Identifies patterns between two variables using dots.
Pie Chart
Illustrates proportions by dividing a circle into sectors.
By using these techniques, dashboards make data interpretation faster and more intuitive.
Interactivity and User Engagement
Interactive features in dashboards enhance user engagement and make data exploration more dynamic. Filters allow you to narrow down data based on specific criteria, while sliders let you adjust variables within a range. Search functions help you locate specific data points quickly.
Other features, like drill-down capabilities, enable you to view detailed information from summaries. Brushing highlights related data points across multiple visualizations, and tooltips provide additional context when you hover over data points. These features make dashboards more user-friendly and adaptable to your needs.
Interactivity ensures that you can engage with data in meaningful ways, uncovering insights that static reports might miss. This level of engagement empowers you to make better decisions and stay aligned with your goals.
Benefits of Dashboards: What is a Dashboard’s Value?
Enhanced Decision-Making
Dashboards centralize vital data, giving you a clear view of performance metrics and trends. This visibility allows you to make informed decisions quickly. With tools like FineReport from FanRuan, users can generate real-time business reports with ease, enhancing decision-making capabilities across departments. By presenting data visually, dashboards help you identify patterns and correlations that might otherwise go unnoticed. For example, line charts can reveal sales trends over time, while bar charts compare performance across departments. These insights enable you to react swiftly to changes and seize opportunities.
Dashboards also reduce costs by highlighting inefficiencies. For instance, you can spot areas where resources are underutilized and reallocate them effectively. Additionally, they improve communication by providing a shared understanding of performance across teams. This alignment ensures everyone works toward the same goals, enhancing collaboration and accountability.
Benefit
Description
Cost Savings
Dashboards help identify inefficiencies, leading to cost savings and increased profitability.
Improved Communication
They provide a shared understanding of performance, enhancing communication and alignment across teams.
Improved Decision Making
Presenting data visually leads to more informed and effective decision-making.
Presenting data visually leads to more informed and effective decision-making.
Improved Efficiency and Productivity
Dashboards automate reporting, saving you time on data collection and analysis. This automation allows you to focus on strategic tasks rather than manual processes. Companies using dashboards report a 30% increase in productivity, as they can quickly identify trends and address operational issues.
Real-time insights further enhance efficiency. Dashboards provide immediate access to key performance indicators (KPIs), enabling you to monitor progress and adjust strategies as needed. They also promote accountability by making performance metrics visible to all employees. This transparency fosters a culture of responsibility and continuous improvement.
Benefit of Dashboards
Description
Real-time insights
Dashboards provide immediate access to key performance indicators, aiding quick decision-making.
Increased productivity
Companies report a 30% increase in productivity after implementing dashboards.
Enhanced efficiency
Dashboards help identify trends and patterns, allowing for swift reactions to operational issues.
Real-Time Monitoring and Goal Tracking
Dashboards excel at real-time monitoring, synthesizing complex data into easy-to-understand visuals. This capability allows you to track KPIs and progress toward goals effectively. By presenting updates in near real-time, dashboards enable you to detect issues early and take proactive measures.
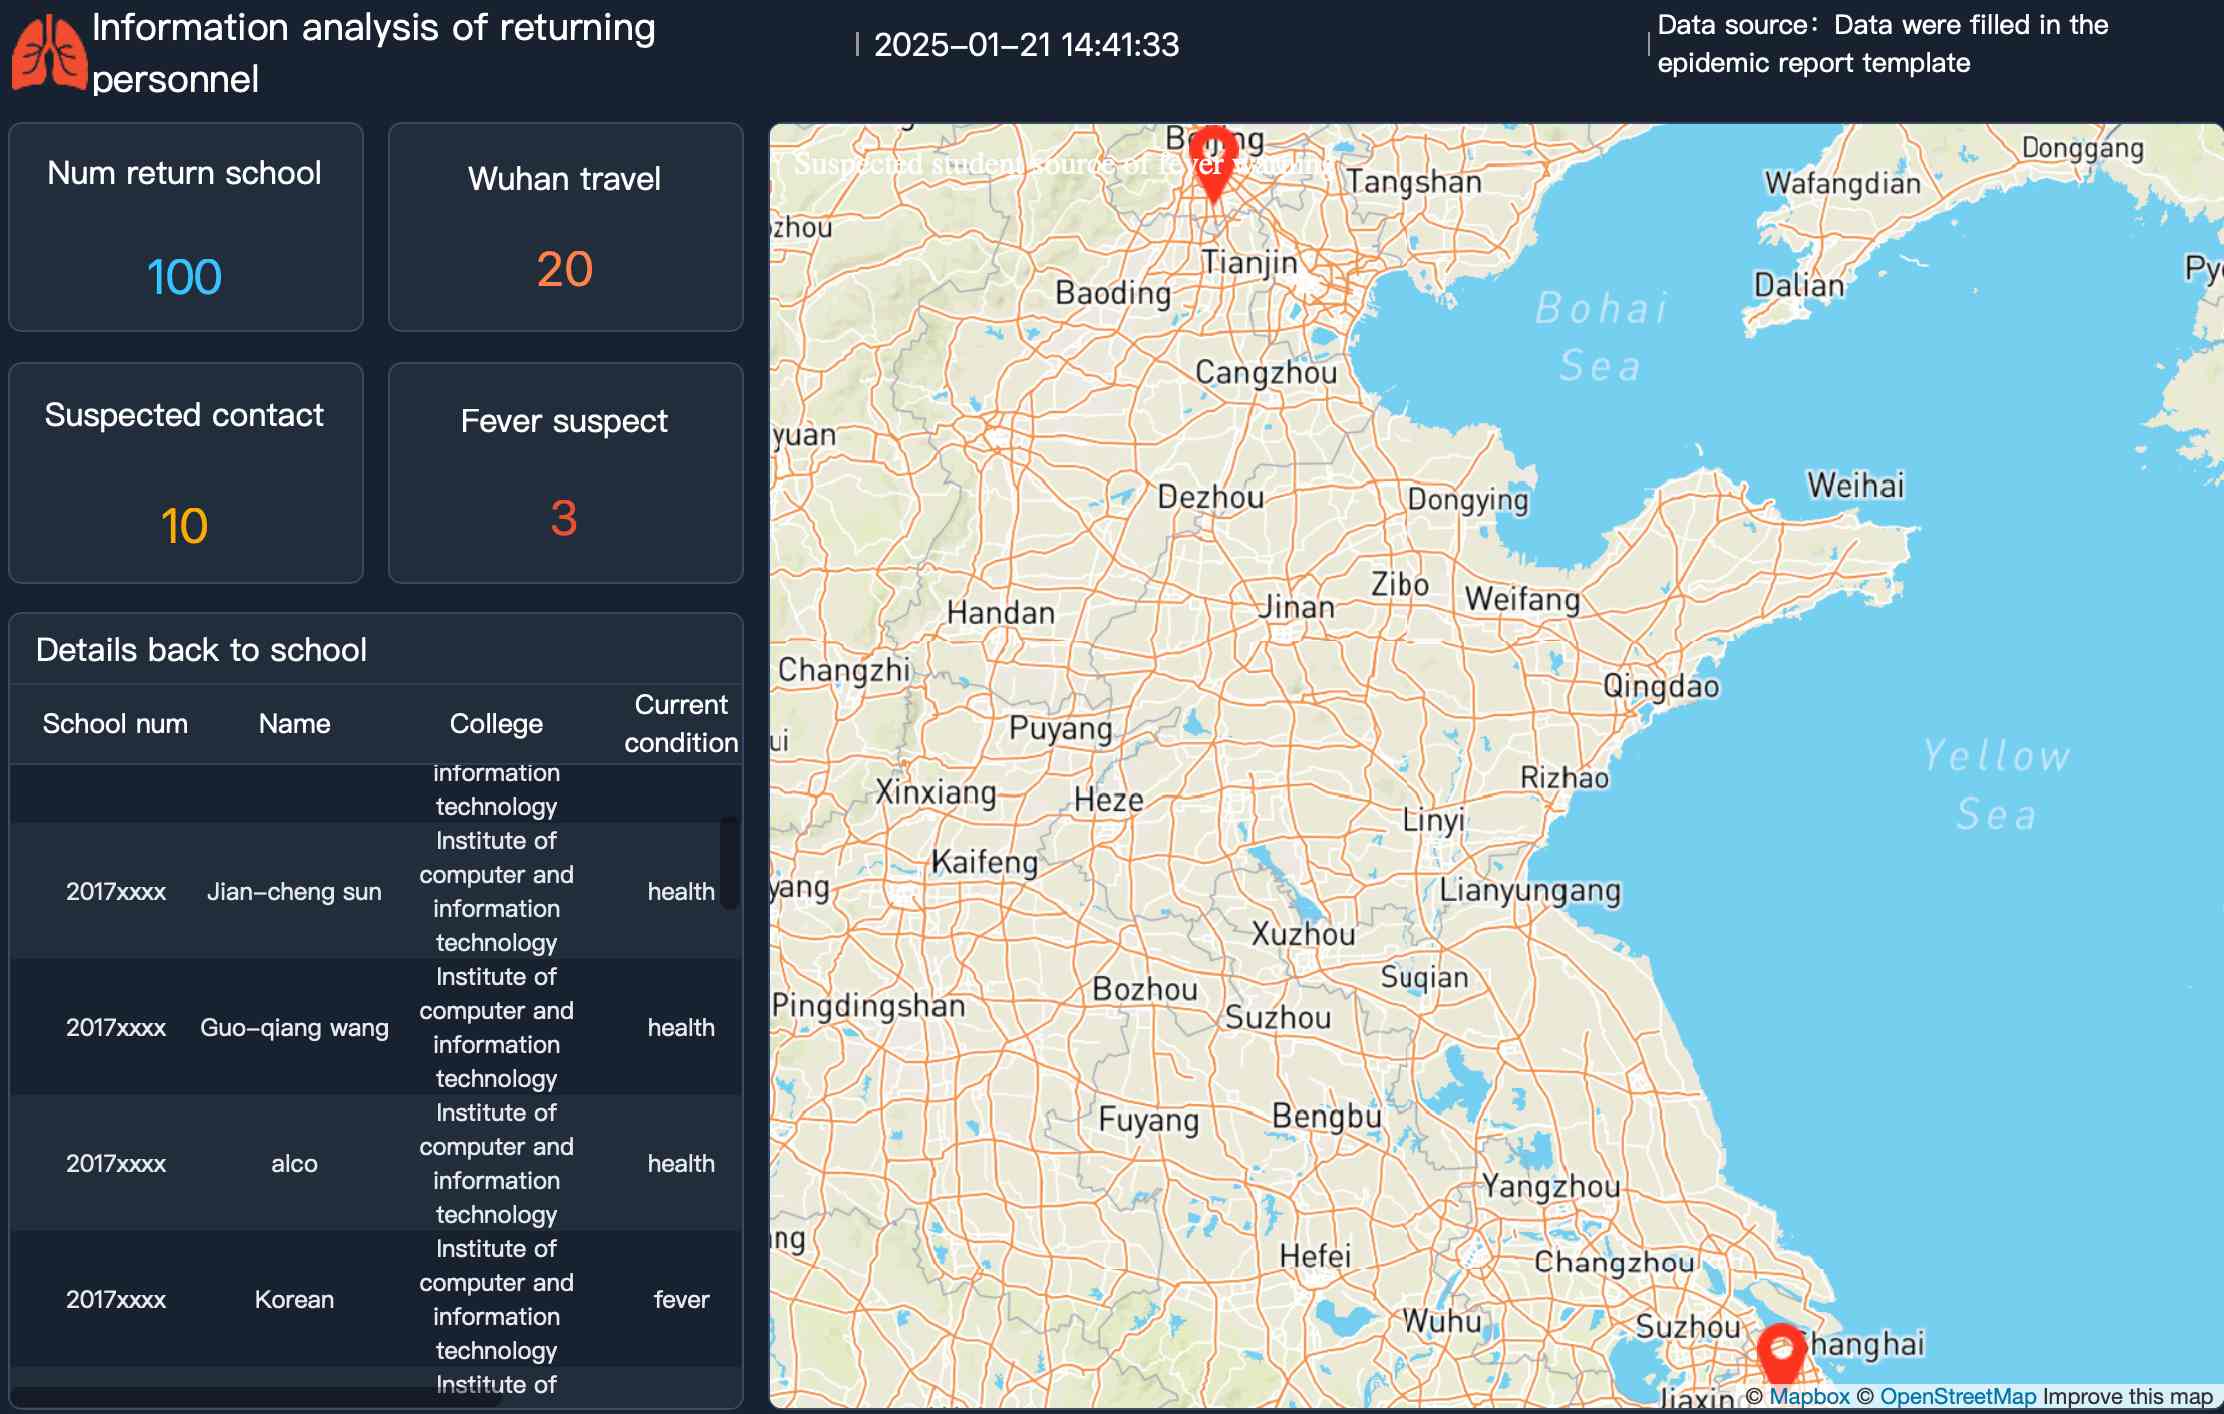
In education, dashboards help institutions track student attendance, test scores, and overall academic performance. A school dashboard might highlight students who need additional support, enabling teachers to intervene early and improve learning outcomes.
Information Analysis of Returning Personnel Created by FineReport
Tracking progress in real time keeps you focused and motivated. Dashboards highlight areas needing attention, ensuring you stay aligned with your objectives. They also encourage collaboration by providing a unified view of performance across departments. If strategies require adjustments, dashboards make it easier to implement changes quickly.
Dashboards help businesses track their progress toward goals or KPIs, improving focus and motivation.
They enable quick strategy adjustments if needed.
By tracking progress in real time, dashboards encourage proactive management and collaboration across departments.
Dashboards simplify complex data, making it actionable. This clarity ensures you can monitor performance, adapt strategies, and achieve your goals efficiently.
Simplified Communication of Data Insights
Dashboards make it easier for you to communicate complex data insights. They transform raw numbers into visuals that are simple to understand. This clarity ensures that everyone, from team members to stakeholders, can grasp the key points quickly. By presenting data in a structured and visually appealing way, dashboards eliminate confusion and foster better collaboration.
To simplify communication, you should follow a few best practices. First, choose the right visualization for your data. For example, use bar charts to compare categories or line charts to show trends over time. Second, keep the design simple. Avoid clutter and focus on the most important information. Third, use color effectively. Highlight critical data points without overwhelming the viewer. Fourth, provide context. Add labels and annotations to explain the significance of the data. Finally, test and iterate. Gather feedback from users to improve the dashboard’s usability.
Consistency also plays a key role in effective communication. Round numbers to make them easier to read. Stick to a limited color palette to maintain a clean look. Ensure that labels and data formatting remain consistent across the dashboard. These small adjustments can make a big difference in how well your audience understands the information.
Dashboards not only simplify data but also make it actionable. They allow you to focus on insights that drive decisions. By presenting information clearly, dashboards help you align your team and achieve your goals more efficiently.
Types of Dashboards: What is a Dashboard’s Variety?
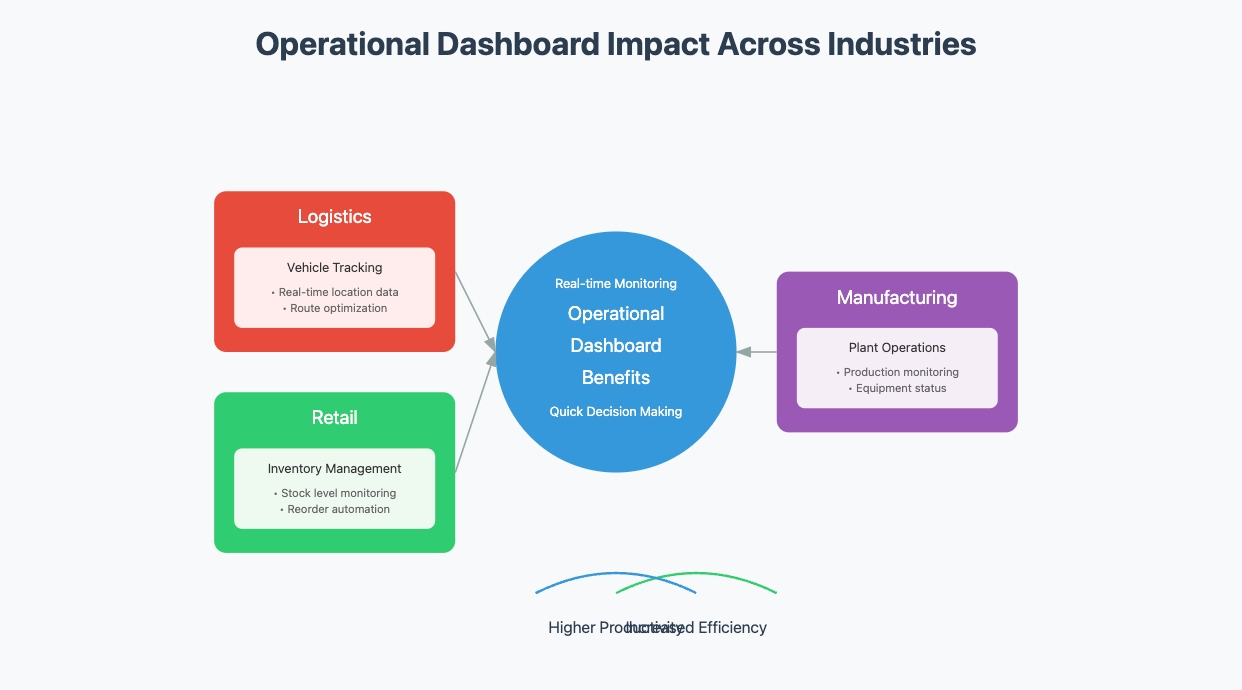
Operational Dashboards
Operational dashboards focus on monitoring short-term activities and tracking performance in real time. These dashboards are ideal for managers and business owners who need immediate visibility into daily operations. They consolidate data from various sources to provide a clear picture of key performance indicators (KPIs), such as sales figures, customer service metrics, or production rates.
You can use operational dashboards to improve efficiency and productivity. For example, they allow you to monitor KPIs, identify bottlenecks, and make quick adjustments to workflows. Real-time visibility ensures you can address issues as they arise, preventing delays or disruptions.
Some common use cases include:
Tracking delivery vehicle locations in logistics.
Monitoring inventory levels in retail.
Visualizing plant operations in manufacturing.
These dashboards keep you informed and help you make data-driven decisions that enhance day-to-day performance.
Analytical Dashboards
Analytical dashboards help you analyze historical data to uncover trends, patterns, and insights. They are designed for senior managers and data analysts who need to make informed decisions based on past performance. These dashboards often include advanced visualization tools, such as scatter plots or histograms, to highlight correlations and anomalies.
By using analytical dashboards, you can track performance metrics, identify potential issues early, and optimize resources. For instance, they provide customer insights that can guide marketing strategies or improve service delivery. They also foster a data-driven culture by encouraging decisions based on evidence rather than intuition.
Key benefits include:
Enhanced performance tracking.
Early identification of problems.
Improved resource allocation.
These dashboards empower you to make strategic decisions that drive long-term success.
Strategic Dashboards
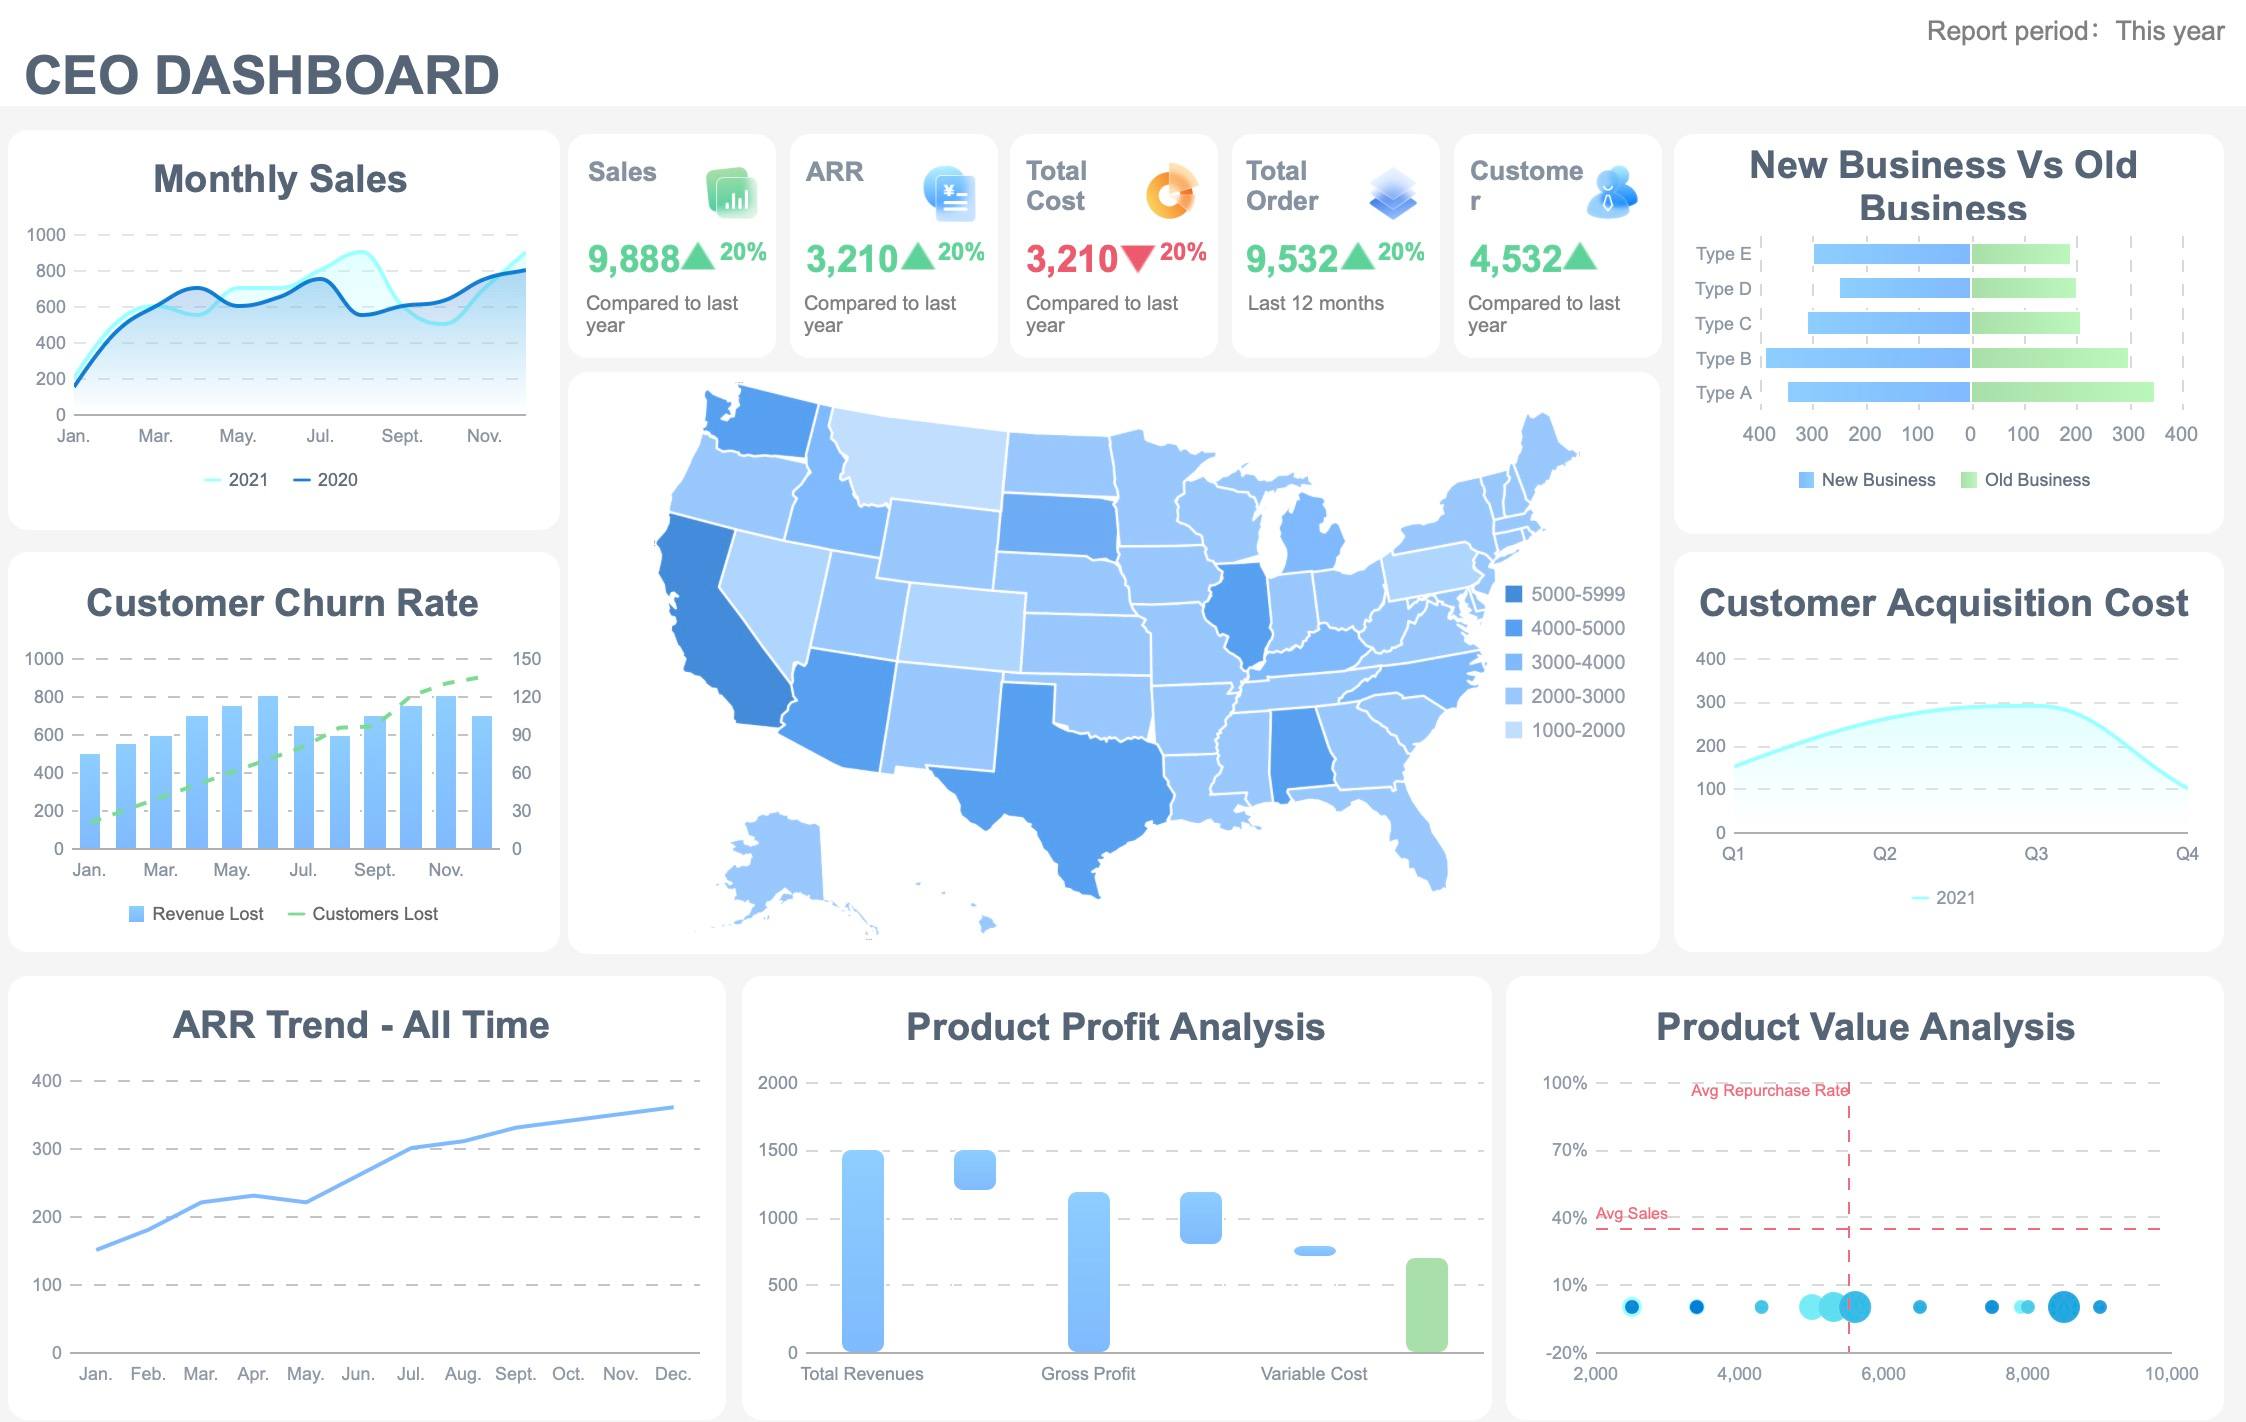
Strategic dashboards focus on long-term planning and monitoring progress toward organizational goals. They are tailored for senior leadership, such as CEOs and VPs, who need a high-level overview of key metrics. These dashboards simplify complex data into clear visuals, making it easier to assess progress and adjust strategies.
In manufacturing, strategic dashboards are crucial for tracking long-term goals such as production efficiency, quality control, and supply chain management. For example, a manufacturing dashboard might provide real-time data on machine performance, helping managers adjust production schedules and reduce downtime.
CEO Dashboard Created By FineReport
The primary goal of a strategic dashboard is to align performance with your company’s objectives. For example, it might display metrics related to revenue growth, market share, or customer satisfaction. By providing a concise view of essential KPIs, these dashboards help you stay focused on what matters most.
Strategic dashboards are essential for:
Monitoring long-term initiatives.
Adjusting plans based on performance.
Visualizing progress toward strategic goals.
They ensure your organization remains on track and aligned with its vision.
Use Cases Across Industries
Dashboards have become essential tools across various industries. They help you analyze data, track performance, and make informed decisions. Here are some examples of how different sectors use dashboards to achieve their goals:
1. Healthcare
In healthcare, dashboards improve patient care and operational efficiency. You can monitor patient outcomes, track hospital occupancy rates, and manage staff schedules. For example, a hospital dashboard might display real-time data on emergency room wait times or bed availability. This helps you allocate resources effectively and enhance patient satisfaction.
2. Retail
Retailers use dashboards to optimize sales and inventory management. You can track daily sales, monitor stock levels, and analyze customer behavior. For instance, a retail dashboard might show which products are selling the fastest, helping you restock popular items quickly. This ensures you meet customer demand and avoid lost sales.
3. Finance
In the finance sector, dashboards provide insights into cash flow, expenses, and revenue. You can use them to monitor budgets, track investments, and identify financial risks. A financial dashboard might include metrics like profit margins or expense ratios, helping you make smarter financial decisions.
4. Education
Educational institutions use dashboards to track student performance and improve learning outcomes. You can monitor attendance rates, test scores, and course completion rates. For example, a school dashboard might highlight students who need extra support, enabling teachers to intervene early.
5. Manufacturing
In manufacturing, dashboards streamline production processes. You can track machine performance, monitor supply chain metrics, and reduce downtime. A manufacturing dashboard might display data on production rates or defect rates, helping you maintain quality and efficiency.
Tip: Choose a dashboard tailored to your industry’s needs. This ensures you get the most relevant insights and maximize your results.
Dashboards adapt to the unique challenges of each industry. By leveraging them, you can turn data into actionable insights and drive success in your field.
Creating Effective Dashboards: What is a Dashboard’s Purpose?
Best Practices for Design and Functionality
To create an effective data dashboard, you need to focus on design and functionality. Start by keeping the layout simple. To create an effective data dashboard, you need to focus on design and functionality. Start by keeping the layout simple. Tools like FineBI by FanRuan provide customizable dashboard templates that allow users to design intuitive, interactive dashboards tailored to their specific needs. Remove unnecessary elements to reduce visual noise. Use larger buttons and text to improve readability. White space is essential for making the dashboard visually appealing and easy to navigate.
Consistency in design helps users feel comfortable. Stick to a uniform layout and use the same fonts, colors, and styles throughout. Prioritize important information by placing it in prominent positions. This ensures users can access critical data quickly.
Speed and accuracy are also vital. Make sure the dashboard loads quickly and displays up-to-date information. Reliable data builds trust and enhances decision-making. Interactive features, like filters and clickable buttons, allow users to explore data in depth. These elements make the dashboard more engaging and user-friendly.
Tip: Tell a clear story with your data. Highlight significant insights and present them in a way that’s easy to understand.
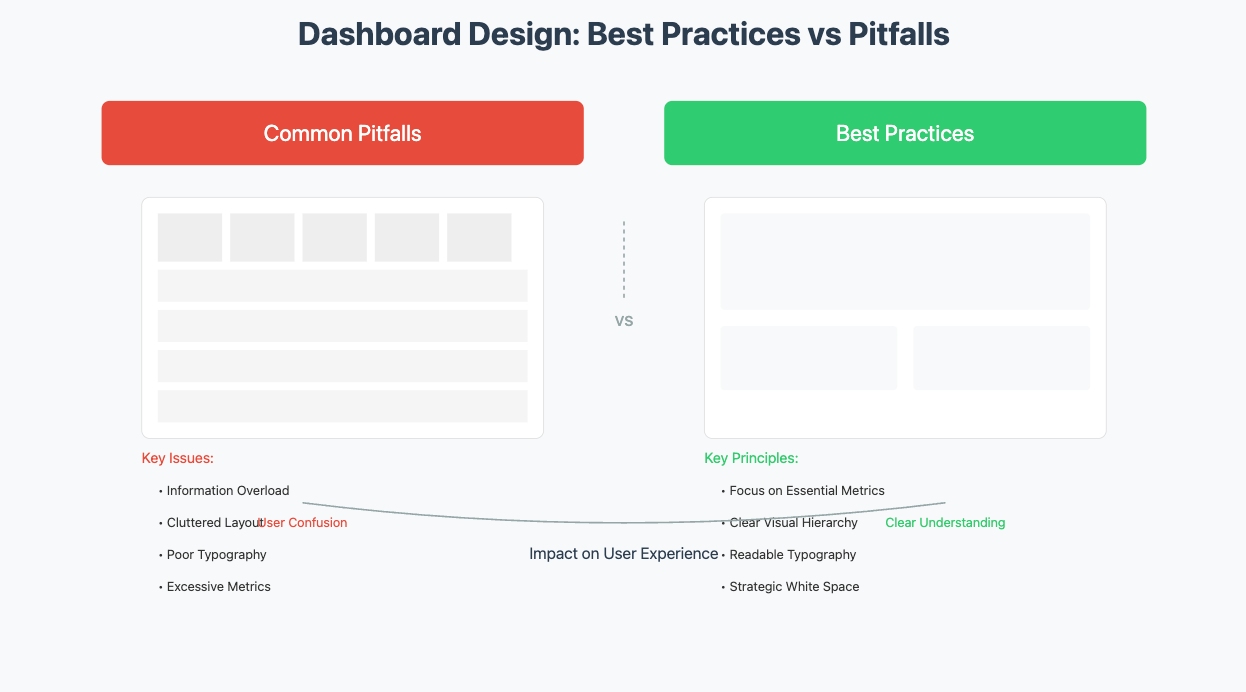
Common Mistakes to Avoid
Avoiding common mistakes ensures your dashboard remains effective. Using the wrong visualization can confuse users. For example, a pie chart might not be the best choice for showing trends over time. Choose visuals that match the type of data you’re presenting.
Overloading the dashboard with too many elements can overwhelm users. Keep it simple and focus on the most important metrics. Illegible fonts or poor graphics can make the dashboard hard to read. Always test readability before finalizing the design.
Labeling is crucial. Without clear labels for KPIs, sections, or pages, users may struggle to navigate the dashboard. Provide context for your data to avoid misinterpretation. Summaries and tooltips can help users understand the information at a glance.
Finally, ensure the dashboard works well on all devices. Poor navigation or lack of mobile compatibility can frustrate users and reduce engagement.
Recommended Tools for Building Dashboards
Several tools can help you build an effective data dashboard. Tableau and Power BI are popular choices for their advanced visualizations and user-friendly interfaces. Several tools can help you build an effective data dashboard. Tableau and Power BI are popular choices for their advanced visualizations and user-friendly interfaces. Additionally, FineBI and FineReport by FanRuan are excellent options for businesses looking for powerful, customizable dashboard solutions with advanced reporting and data visualization capabilities.
Qlik Sense and AWS QuickSight provide real-time monitoring and natural language querying. Klipfolio and Domo excel at combining data from multiple sources for KPI tracking. IBM Cognos Analytics and Yellowfin focus on collaboration and automated insights.
For businesses seeking flexibility, Mode and Oracle Analytics Cloud offer custom dashboards and advanced analysis. Polymer is another great option for AI-assisted insights. These tools cater to various needs, ensuring you can find one that aligns with your goals.
Note: Choose a tool that matches your technical skills and business requirements. This ensures you get the most value from your dashboard.
Dashboards simplify complex data, transforming it into actionable insights that drive better decisions. They centralize information, making it accessible for real-time monitoring and analysis. By fostering transparency and collaboration, dashboards empower you to identify trends, track goals, and improve efficiency. Their ability to present data visually ensures clarity, enabling you to focus on what matters most. Leverage dashboards to streamline operations, enhance decision-making, and stay competitive in today’s fast-paced environment. Start using them to unlock the full potential of your data and achieve your goals with confidence.
Click the banner below to experience FineReport for free and empower your enterprise to convert data into productivity!
Access a wealth of case studies, industry insights, and solution guides to accelerate digital transformation.
FAQ
What is the main purpose of a dashboard?
A dashboard helps you visualize and analyze data. It simplifies complex information into easy-to-understand visuals, enabling you to track performance, identify trends, and make informed decisions quickly.
How do dashboards improve decision-making?
Dashboards centralize data and present it visually. This allows you to spot patterns, compare metrics, and gain actionable insights. With real-time updates, you can respond to changes faster and make better decisions.
Can dashboards be customized for different industries?
Yes, dashboards adapt to various industries. For example, healthcare dashboards track patient outcomes, while retail dashboards monitor sales and inventory. Customization ensures you get insights tailored to your specific needs.
What tools can you use to create dashboards?
You can use tools like Tableau, Power BI, or Google Data Studio. These platforms offer user-friendly interfaces and advanced visualization options, making it easier to design dashboards that meet your goals.
Are dashboards suitable for small businesses?
Absolutely! Dashboards help small businesses track KPIs, monitor progress, and optimize resources. They provide insights that improve efficiency and support growth, even with limited budgets or smaller teams.