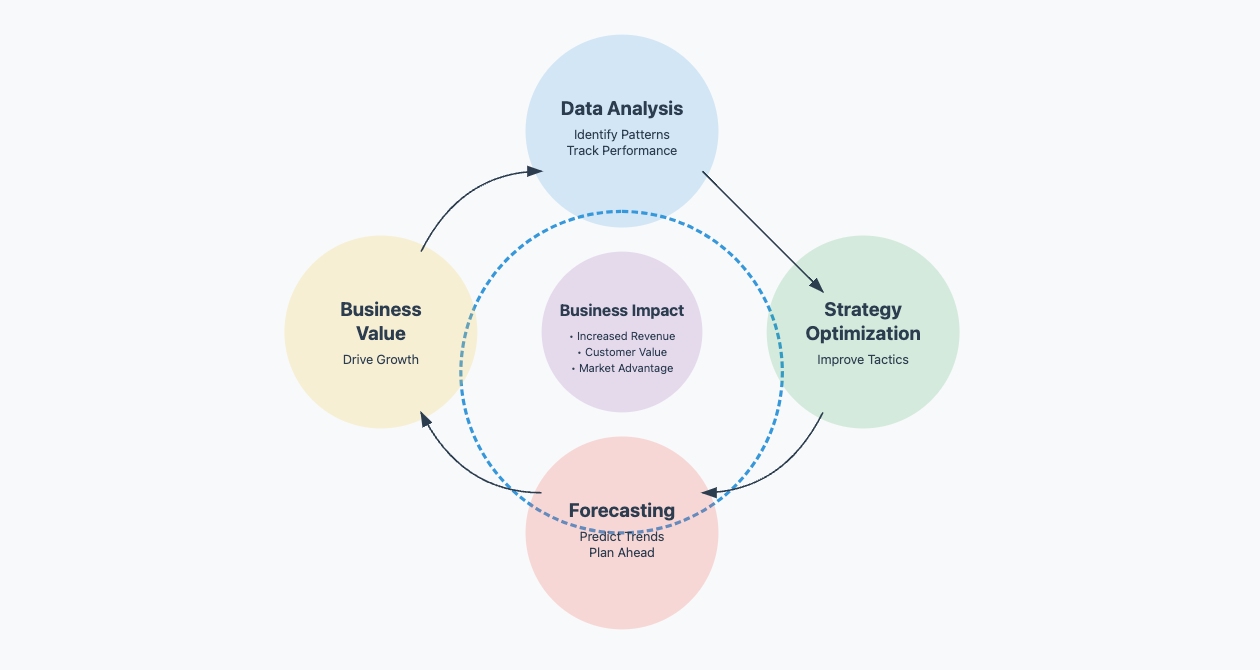
Sales analytics involves examining sales data to improve performance and make better decisions. By using sales analytics tools, you can unlock valuable insights into customer behavior, optimize strategies, and forecast future trends. Understanding how to use sales analytics tools to optimize sales is essential for staying ahead in today’s competitive market.
In 2026, its importance continues to grow as businesses adopt advanced technologies like AI and predictive analytics. These tools help you stay ahead of competitors by reducing costs and increasing profits. Over the past decade, analytics has evolved from basic trend analysis to advanced forecasting and strategy optimization. This shift allows you to identify new opportunities and focus on high-value prospects. By leveraging sales analytics, you can gain critical insights into customer behavior and future trends, giving your business a competitive edge.
The Role and Benefits of Sales Analytics
Why Sales Analytics is Essential for Businesses
Sales analytics plays a vital role in modern business operations. By utilizing the right sales analytics tools, you can gain accurate, real-time data, enabling you to make informed decisions and optimize your sales strategies for maximum efficiency. Knowing how to use sales analytics tools to optimize sales can significantly improve your business outcomes.
By analyzing sales data, you can identify effective strategies and optimize them to improve outcomes. Sales analytics also enables you to forecast future trends, allowing you to adapt your strategies proactively. These insights not only enhance your sales performance but also drive revenue growth. This makes sales analytics an essential tool for delivering value to your customers and staying competitive in a fast-paced market.
Key Benefits of Sales Analytics
Improved Sales Performance
Sales analytics helps you identify high-performing tactics and areas needing improvement. Sales analytics tools allow you to focus on what works best by providing insights that can boost your team's productivity and improve overall sales performance. Using the best sales analytics tools ensures that you prioritize the right actions to drive growth. In addition, analyzing sales data can reveal which products sell best during specific seasons, enabling you to adjust your approach for maximum impact.
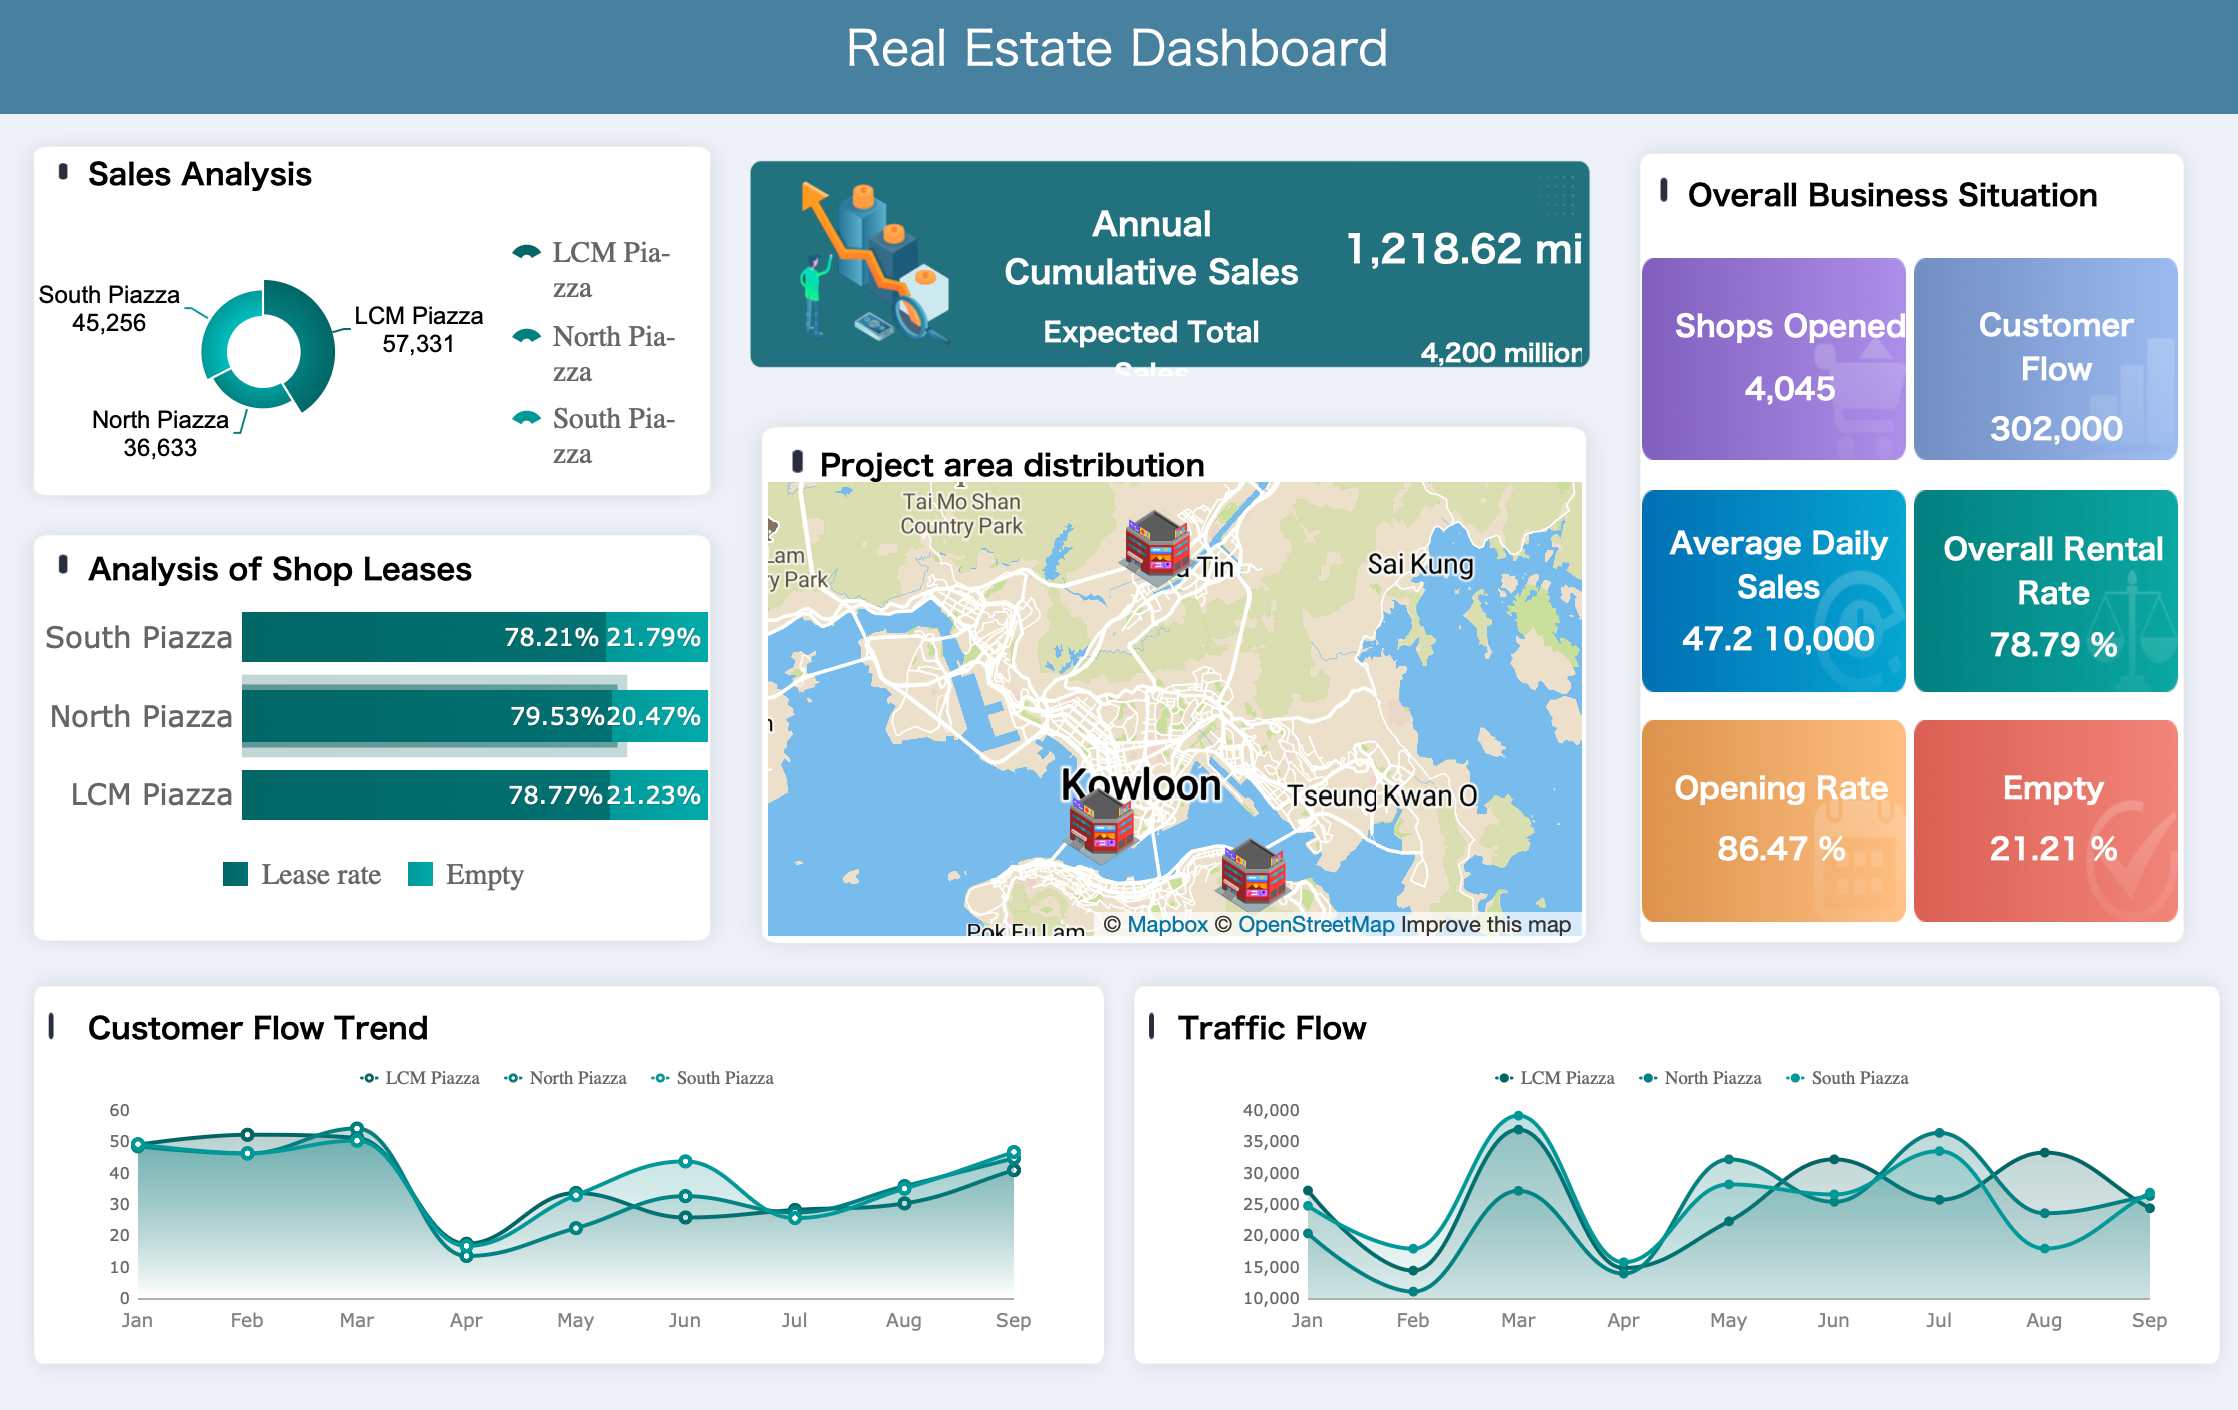
For instance, in the retail industry, sales analytics can be used to track seasonal trends and customer preferences, enabling retailers to optimize inventory management and marketing campaigns. Similarly, in the financial sector, sales analytics can predict customer behaviors, allowing financial institutions to tailor their offerings and enhance customer retention.
Real Estate Dashboard Created By FineReport
Enhanced Customer Insights
Understanding your customers is key to success. Sales analytics provides valuable insights into customer behavior, preferences, and buying patterns. These insights allow you to create targeted marketing campaigns and personalized sales strategies, improving customer satisfaction and loyalty.
Data-Driven Decision-Making
Making decisions based on data ensures accuracy and reduces guesswork. Sales analytics equips you with the information needed to develop effective strategies, manage resources efficiently, and plan for the future. This approach minimizes risks and maximizes opportunities for growth.
Examples of Sales Analytics in Action
Company
Description
Results
Company A
E-commerce retailer using a sales analysis dashboard to automate reporting.
Gained real-time visibility and increased revenue.
Company B
Software provider analyzing customer behavior and sales trends.
Streamlined operations and achieved revenue growth.
These examples demonstrate how businesses use sales analytics to optimize strategies and achieve measurable results.
Key Categories of Sales Analytics
Descriptive Analytics
Descriptive analytics focuses on summarizing past sales data to help you understand what has already happened. It organizes and simplifies complex datasets, making it easier to identify patterns and trends. For example, you can use descriptive analytics to gain visibility into your sales pipeline or analyze revenue and conversion rates over time. This approach helps you adapt to market conditions and improve decision-making.
Historical Data Analysis
Historical data analysis allows you to review past sales performance. By examining this data, you can uncover valuable insights about customer behavior and seasonal trends. For instance, analyzing historical sales data might reveal which products perform best during specific months, enabling you to plan inventory and marketing strategies more effectively.
Identifying Trends
Identifying trends is another key aspect of descriptive analytics. By spotting patterns in your sales data, you can anticipate market shifts and adjust your strategies accordingly. For example, if you notice a steady increase in demand for a particular product, you can allocate more resources to capitalize on this trend.
Diagnostic Analytics
Diagnostic analytics helps you understand why certain sales outcomes occurred. It digs deeper into your data to uncover the root causes of challenges, such as declining sales or increased customer churn. This type of analysis enables you to address issues and optimize your strategies for better results.
Understanding Sales Challenges
Understanding sales challenges begins with identifying the problems you face. For example, a decline in sales might stem from reduced web traffic or ineffective marketing campaigns. Diagnostic analytics examines these issues, helping you pinpoint the exact reasons behind them.
Root Cause Analysis
Root cause analysis goes a step further by analyzing historical data to validate findings. For instance, if customer churn increases, diagnostic analytics can reveal whether pricing, product quality, or customer service is the main factor. This insight allows you to implement targeted solutions and improve your sales performance.
Predictive Analytics
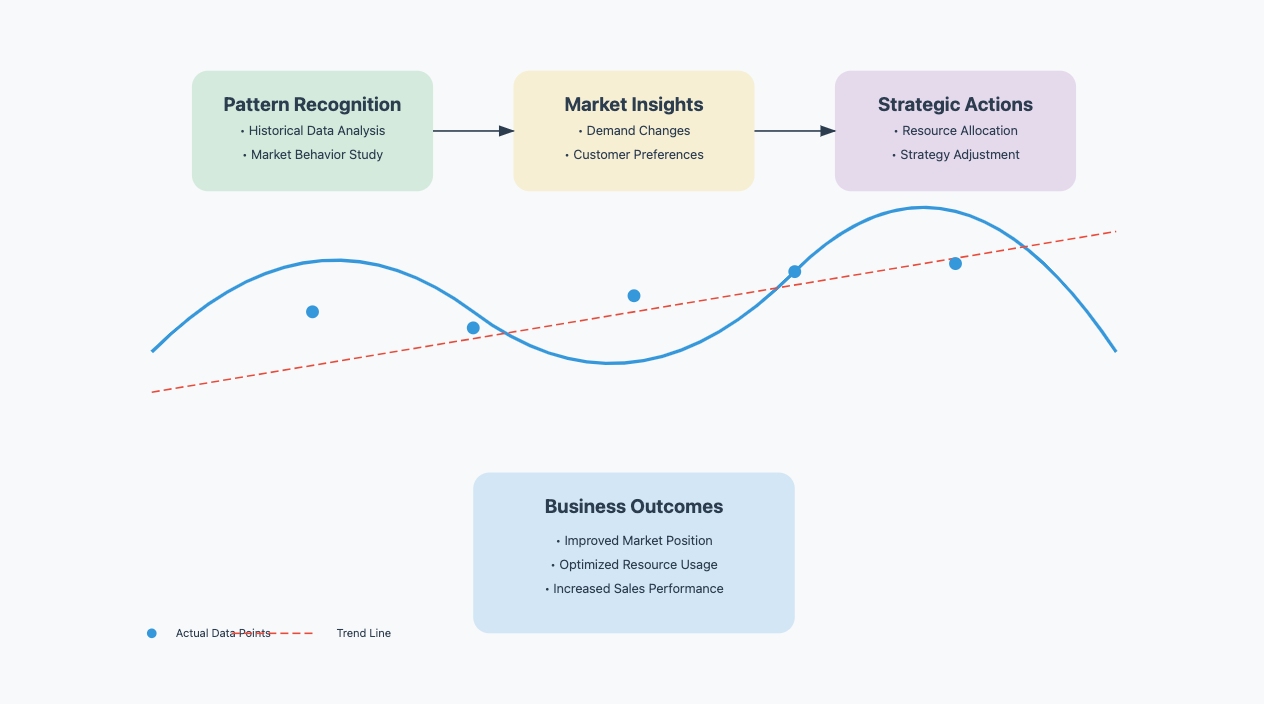
Predictive analytics uses statistical models and forecasting techniques to predict future sales trends. With FineBI from FanRuan, businesses can leverage advanced predictive capabilities to forecast sales, identify high-value opportunities, and proactively adjust strategies. It helps you make informed decisions by analyzing historical data and identifying patterns that indicate what might happen next.
In retail, businesses can predict consumer demand during holiday seasons, while in the technology sector, companies forecast the success of new products based on historical data, helping them allocate marketing budgets and resources effectively.
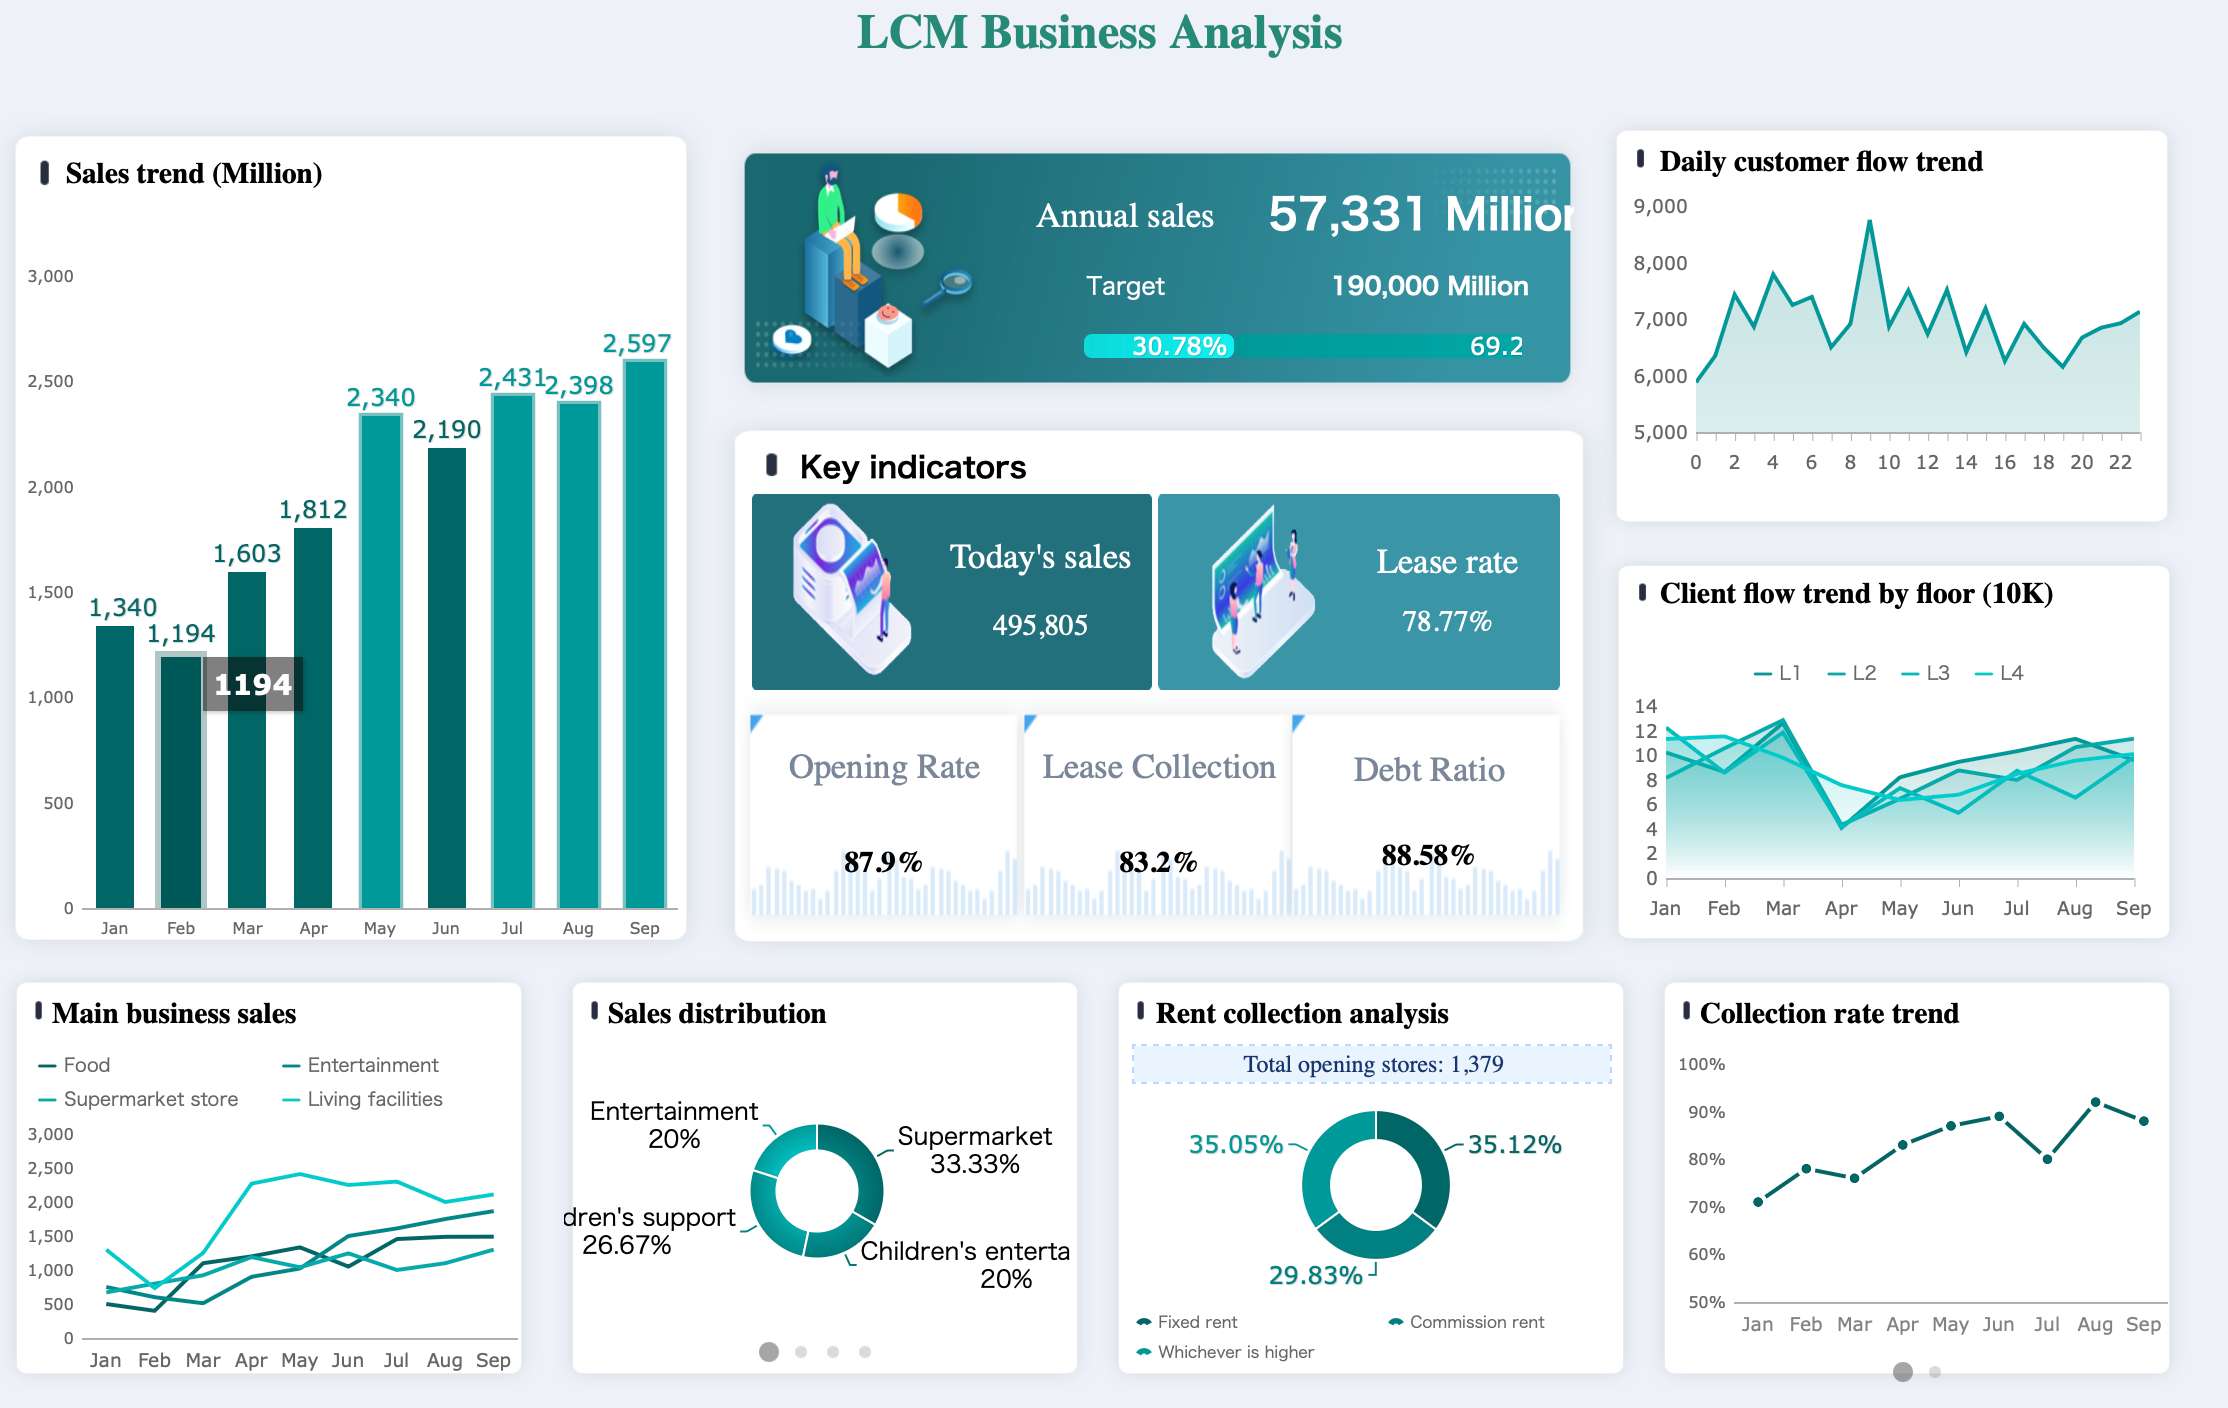
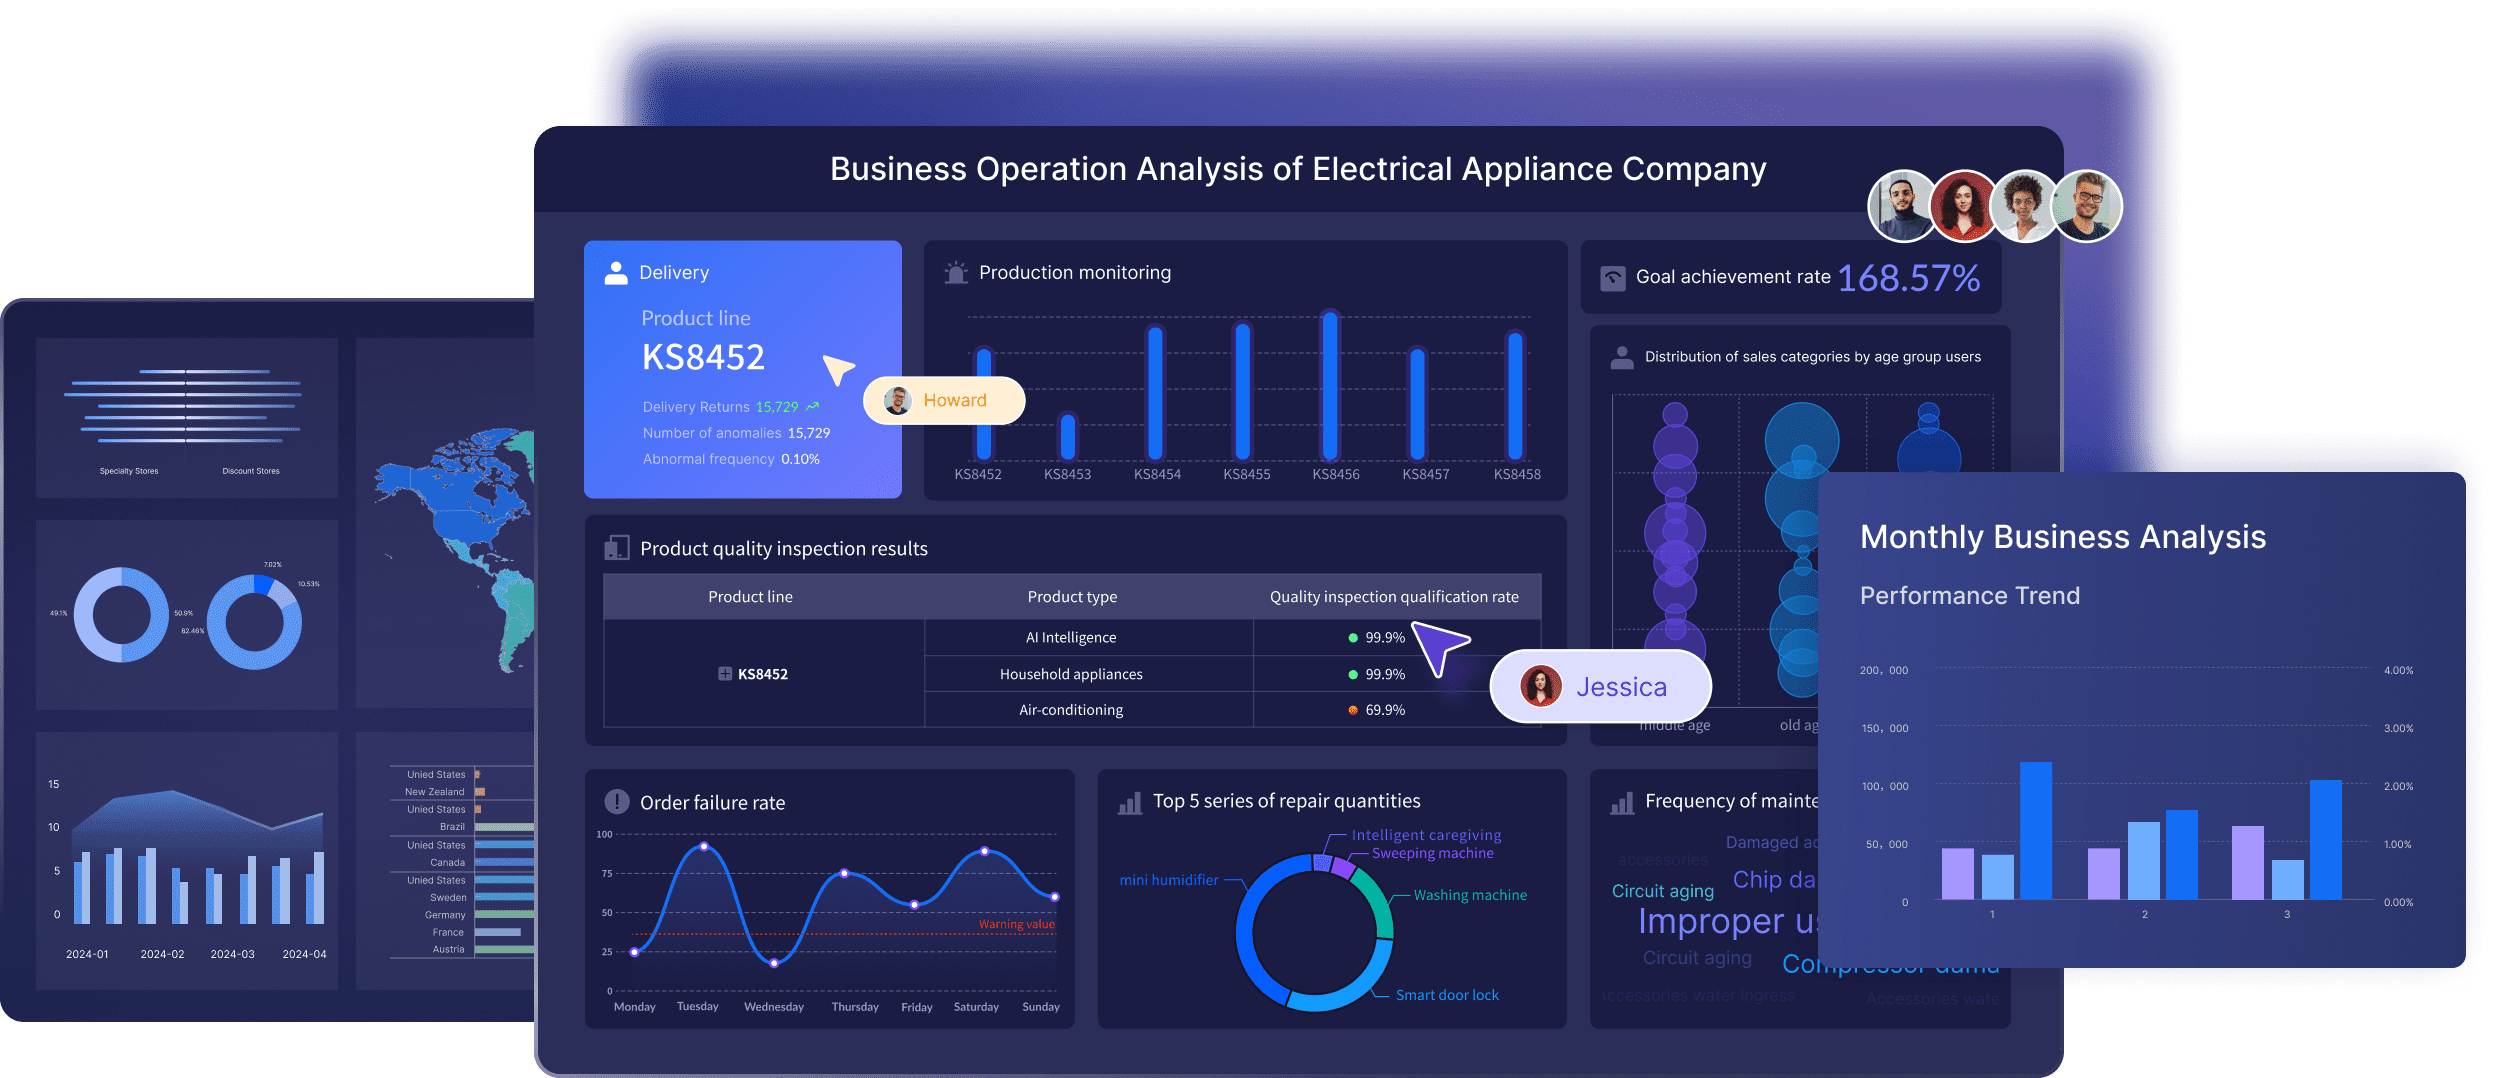
LCM Business Analysis Dashboard Created By FineReport
Forecasting Sales Trends
Forecasting sales trends involves methods like time series analysis and causal forecasting. Time series analysis examines historical data to identify recurring patterns, while causal forecasting considers factors like marketing efforts and pricing. These techniques allow you to predict future sales with greater accuracy.
Anticipating Customer Behavior
Anticipating customer behavior is another strength of predictive analytics. By analyzing past purchasing patterns, you can predict what your customers are likely to buy next. This insight helps you create personalized marketing campaigns and improve customer satisfaction.
Prescriptive Analytics
Prescriptive analytics takes your sales data a step further by recommending specific actions to achieve desired outcomes. It doesn’t just tell you what might happen; it guides you on what to do next. This approach helps you refine your sales strategies and prepare for different scenarios, ensuring you stay ahead in a competitive market.
Optimizing Sales Strategies
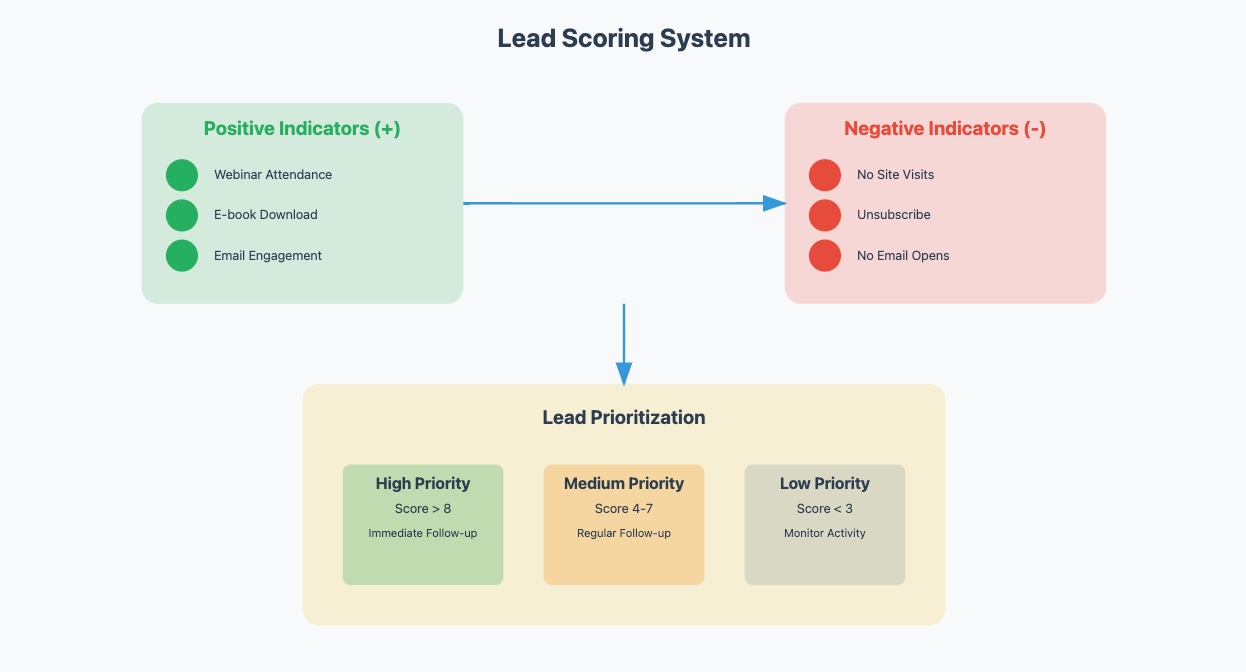
Prescriptive analytics enables you to optimize your sales strategies by identifying the most effective actions for your team. For example, lead scoring allows you to prioritize outreach efforts based on the likelihood of conversion. Actions like page views, email interactions, and site searches can be assigned point values. Higher points go to behaviors that indicate purchase intent, such as attending webinars or downloading e-books. Negative points are given for actions that suggest a lack of interest. This system ensures your team focuses on high-value leads, improving efficiency and boosting sales performance.
You can also use prescriptive analytics to allocate resources effectively. By analyzing data, you can determine which products or services deserve more attention. This insight helps you adjust your marketing and sales efforts to maximize returns. With these tools, you can create a more targeted and impactful approach to selling.
Scenario Planning
Scenario planning is another powerful feature of prescriptive analytics. It allows you to simulate different business situations and evaluate potential outcomes. For instance, you can test how changes in pricing, marketing budgets, or product offerings might impact your revenue. These simulations help you prepare for uncertainties and make informed decisions.
By using scenario planning, you can identify risks and opportunities before they arise. This proactive approach ensures you remain adaptable in a rapidly changing market. Whether you’re launching a new product or entering a new market, prescriptive analytics equips you with the insights needed to succeed.
Incorporating prescriptive analytics into your operations transforms how you approach decision-making. It empowers you to act with confidence, knowing your strategies are backed by data-driven insights.
Key Sales Metrics and Their Role in Sales Analytics
Sales metrics are essential for understanding your business's performance and identifying growth opportunities. By utilizing sales analytics tools, businesses can track and analyze key metrics like total revenue, conversion rates, and customer lifetime value, which allows for better strategy adjustments. Learn how to use sales analytics tools effectively to understand these metrics and make smarter business decisions.
In manufacturing, tracking metrics like sales cycle length and average deal size can help companies optimize production schedules, ensuring that high-demand products are prioritized, and marketing efforts are targeted to the right customer segments.
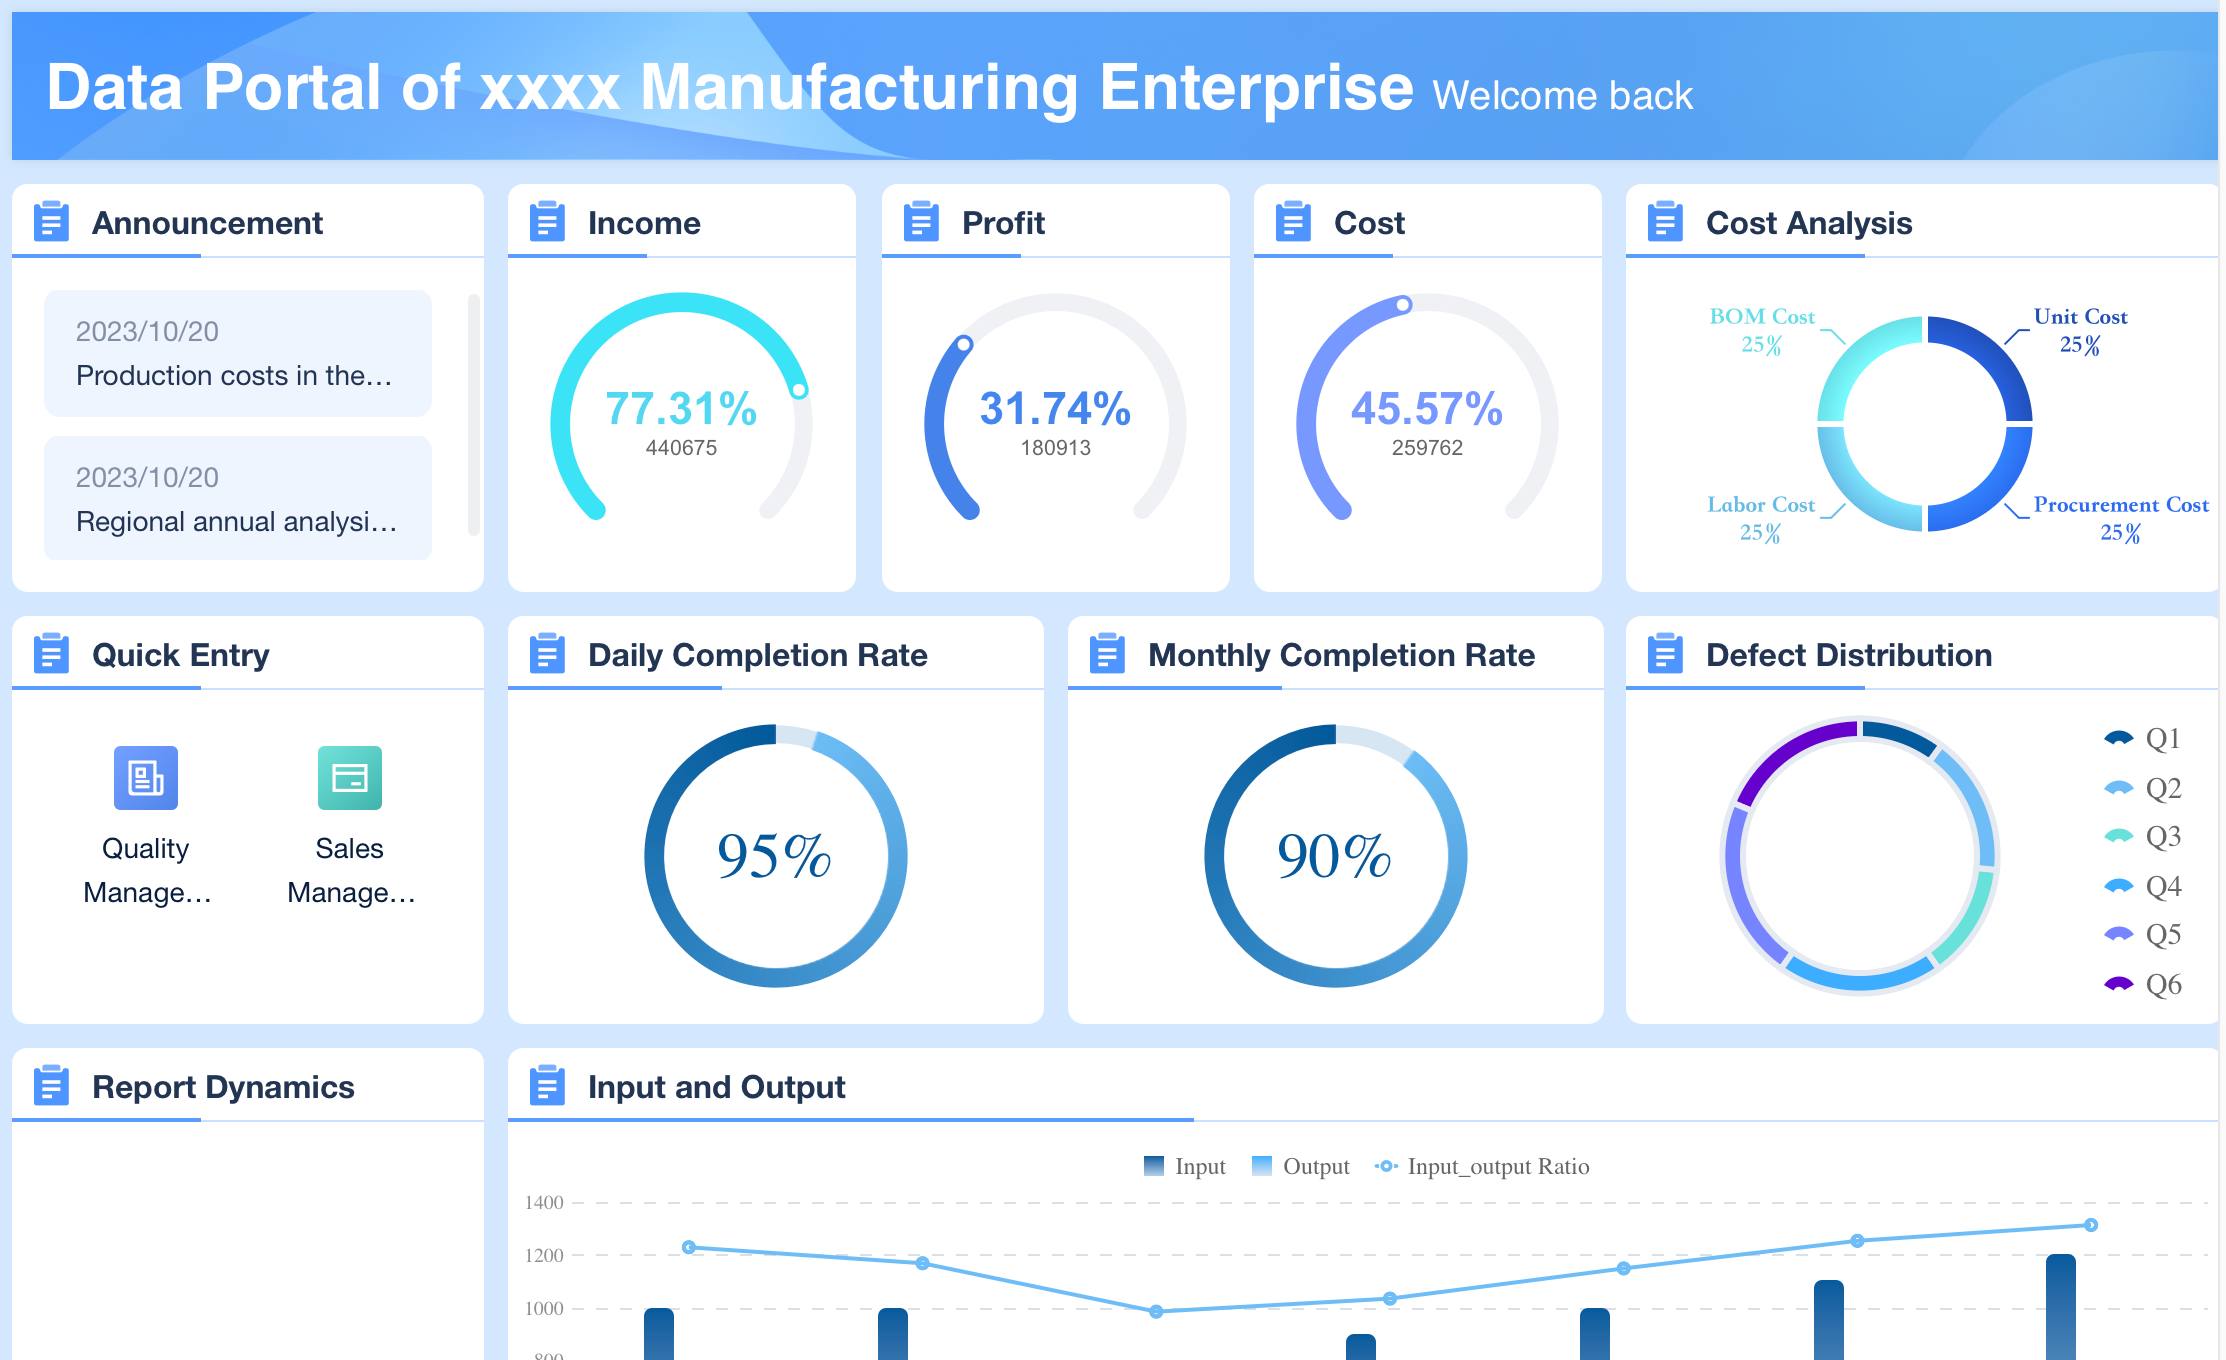
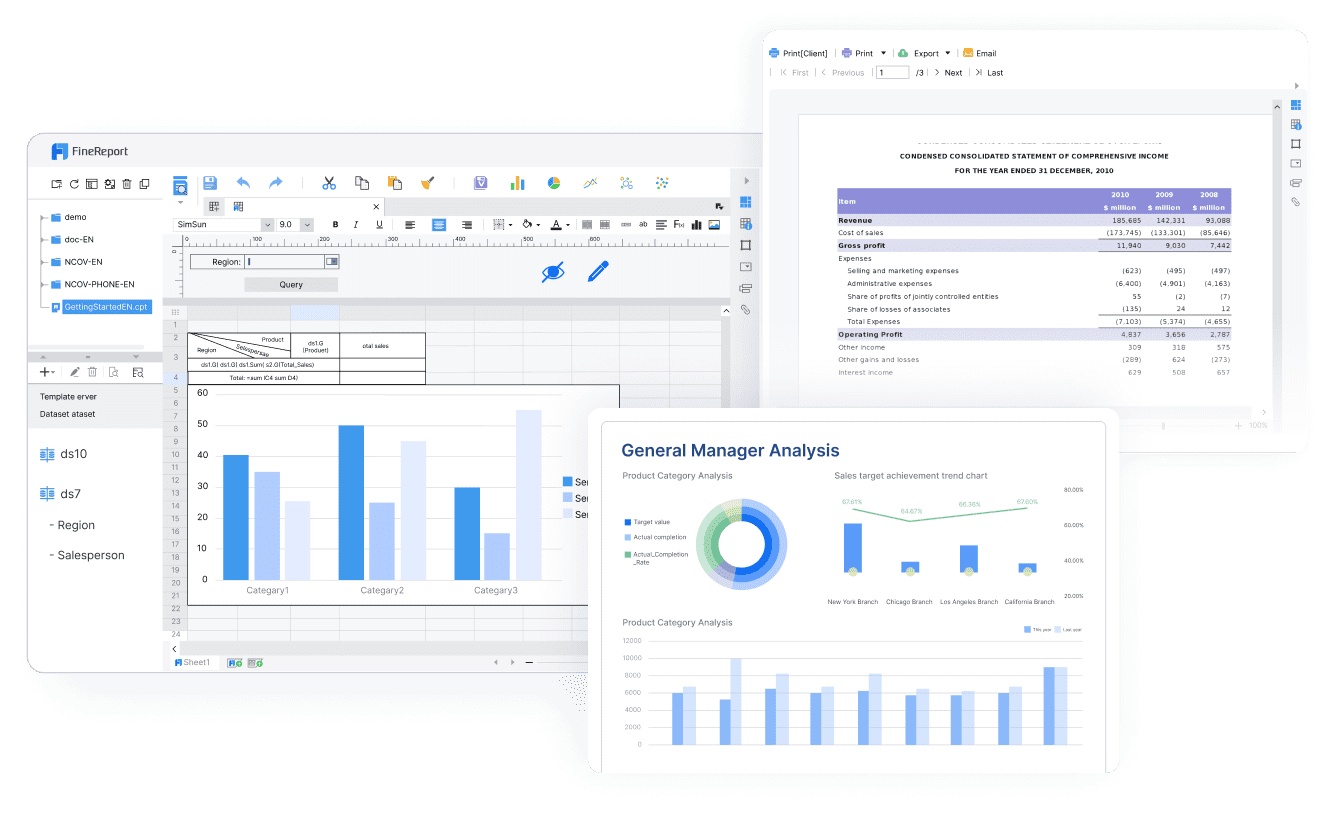
Data Portal Manufacturing Enterprise Dashboard Created By FIneReport
FineReport from FanRuan helps businesses automate the generation of detailed sales reports, enabling faster decision-making and more accurate performance tracking. By tracking these metrics, you can make informed decisions and refine your sales strategies. Let’s explore some of the most critical sales metrics and their role in sales analytics.
Revenue Metrics
Total Revenue
Total revenue measures the overall income generated from your sales activities. It provides a clear picture of your business's financial health. By analyzing total revenue, you can identify trends and evaluate the effectiveness of your sales strategies. For example, tracking revenue over time helps you understand seasonal patterns and adjust your approach to maximize profits.
Revenue Growth Rate
Revenue growth rate shows how quickly your business is increasing its income. This metric highlights the success of your sales efforts and helps you set realistic goals. A steady growth rate indicates strong sales performance, while a decline may signal the need for adjustments. Monitoring this metric ensures you stay on track to achieve long-term success.
Sales Performance Metrics
Conversion Rates
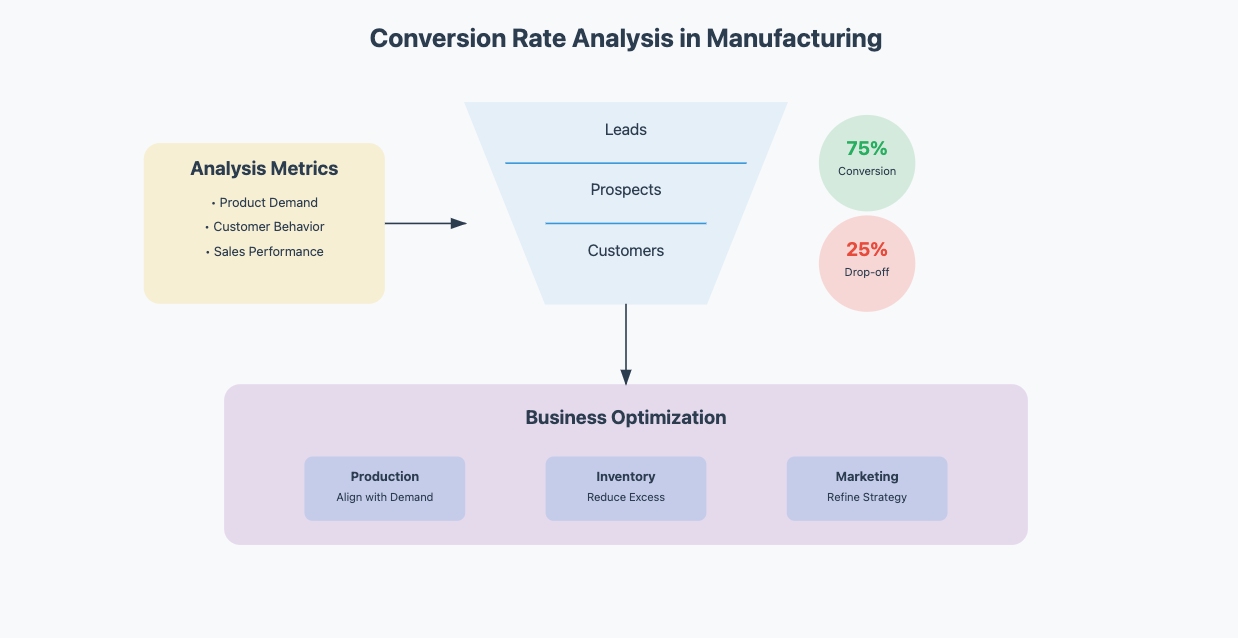
Conversion rates measure the percentage of leads that turn into paying customers. In the manufacturing sector, companies track conversion rates to understand which products have higher demand and align production and marketing strategies accordingly, ensuring more efficient sales and reducing excess inventory. By analyzing conversion rates, you can identify areas for improvement and optimize your approach. For instance, if your conversion rate drops, you might need to refine your pitch or address customer objections more effectively.
Average Deal Size
Average deal size calculates the average value of closed deals. It helps you understand the profitability of your sales efforts. A higher average deal size often indicates a focus on high-value customers. By tracking this metric, you can adjust your sales strategies to target more lucrative opportunities.
Customer Metrics
Customer Lifetime Value (CLV)
Customer Lifetime Value represents the total revenue a customer generates throughout their relationship with your business. CLV considers factors like purchasing frequency and retention duration. By understanding CLV, you can allocate resources effectively and develop strategies to retain high-value customers. This metric also informs how much you should invest in acquiring new customers.
Customer Acquisition Cost (CAC)
Customer Acquisition Cost measures the expense of acquiring a new customer. It includes marketing and sales costs. Comparing CAC with CLV helps you determine if your acquisition efforts are profitable. A lower CAC with a high CLV indicates efficient resource use. Tracking this metric ensures you maintain a healthy balance between costs and revenue.
By focusing on these key sales metrics, you can gain valuable insights into your business performance. These metrics guide your decision-making and help you create data-driven strategies for sustained growth.
Pipeline Metrics
Pipeline metrics help you evaluate the efficiency of your sales process. They provide insights into how leads move through your pipeline and where improvements can be made. Two critical pipeline metrics are sales cycle length and lead-to-customer ratio.
Sales Cycle Length
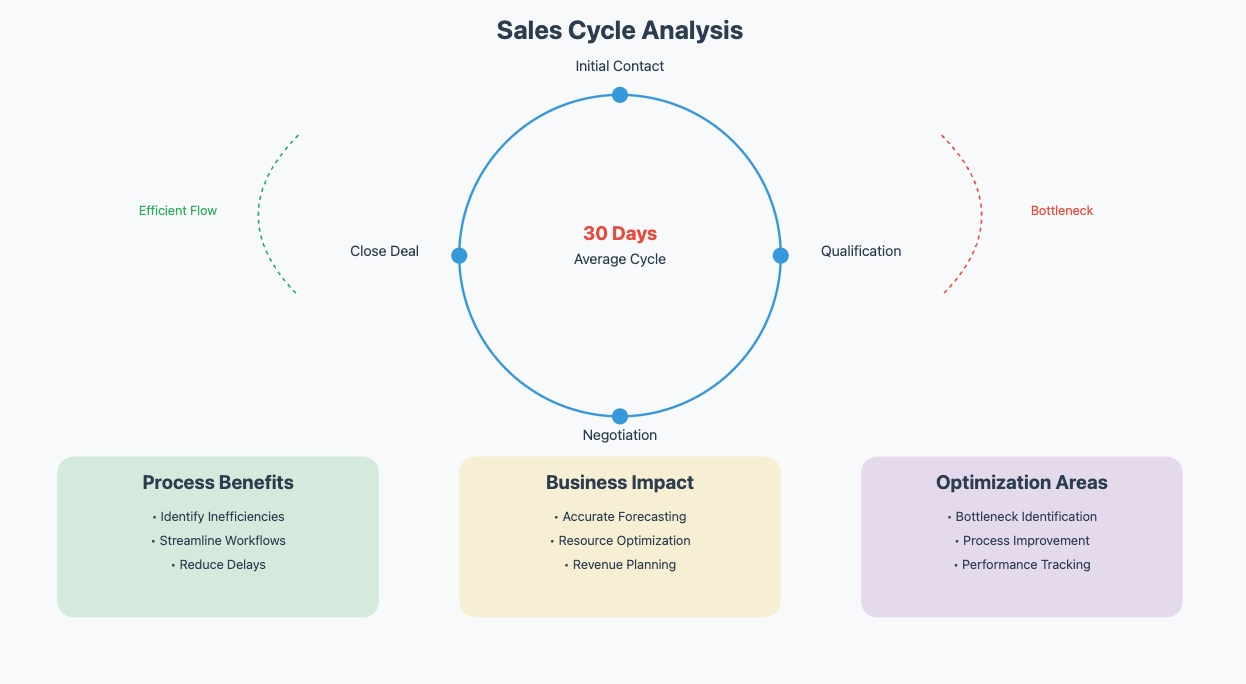
Sales cycle length measures the time it takes to close a deal, from the initial contact with a lead to the final sale. This metric reveals how efficient your sales process is. A shorter sales cycle often indicates a streamlined process, while a longer one may highlight bottlenecks that need attention.
Tracking sales cycle length offers several benefits:
It helps you identify inefficiencies in your sales process.
It allows you to streamline workflows and reduce delays.
It improves your ability to forecast future revenue.
By analyzing historical data on sales cycle length, you can set realistic sales targets. For example, if your average sales cycle is 30 days, you can predict when deals in your pipeline will close. This insight ensures you allocate resources effectively and meet your revenue goals.
Lead-to-Customer Ratio
The lead-to-customer ratio measures the percentage of leads that convert into paying customers. This metric evaluates the effectiveness of your sales funnel. A higher ratio indicates a well-optimized process, while a lower ratio suggests room for improvement.
To improve this ratio, focus on qualifying leads early in the process. Identify high-potential prospects and prioritize them. Additionally, analyze where leads drop off in your funnel. Addressing these gaps can significantly boost your conversion rates.
By monitoring these pipeline metrics, you gain a clearer picture of your sales performance. These insights help you refine your strategies and achieve better results. Incorporating these sales metrics into your analytics ensures your business stays on track for growth.
Sales Analytics Tools and Technologies in 2026
Advanced CRM Systems
AI and Machine Learning Integration
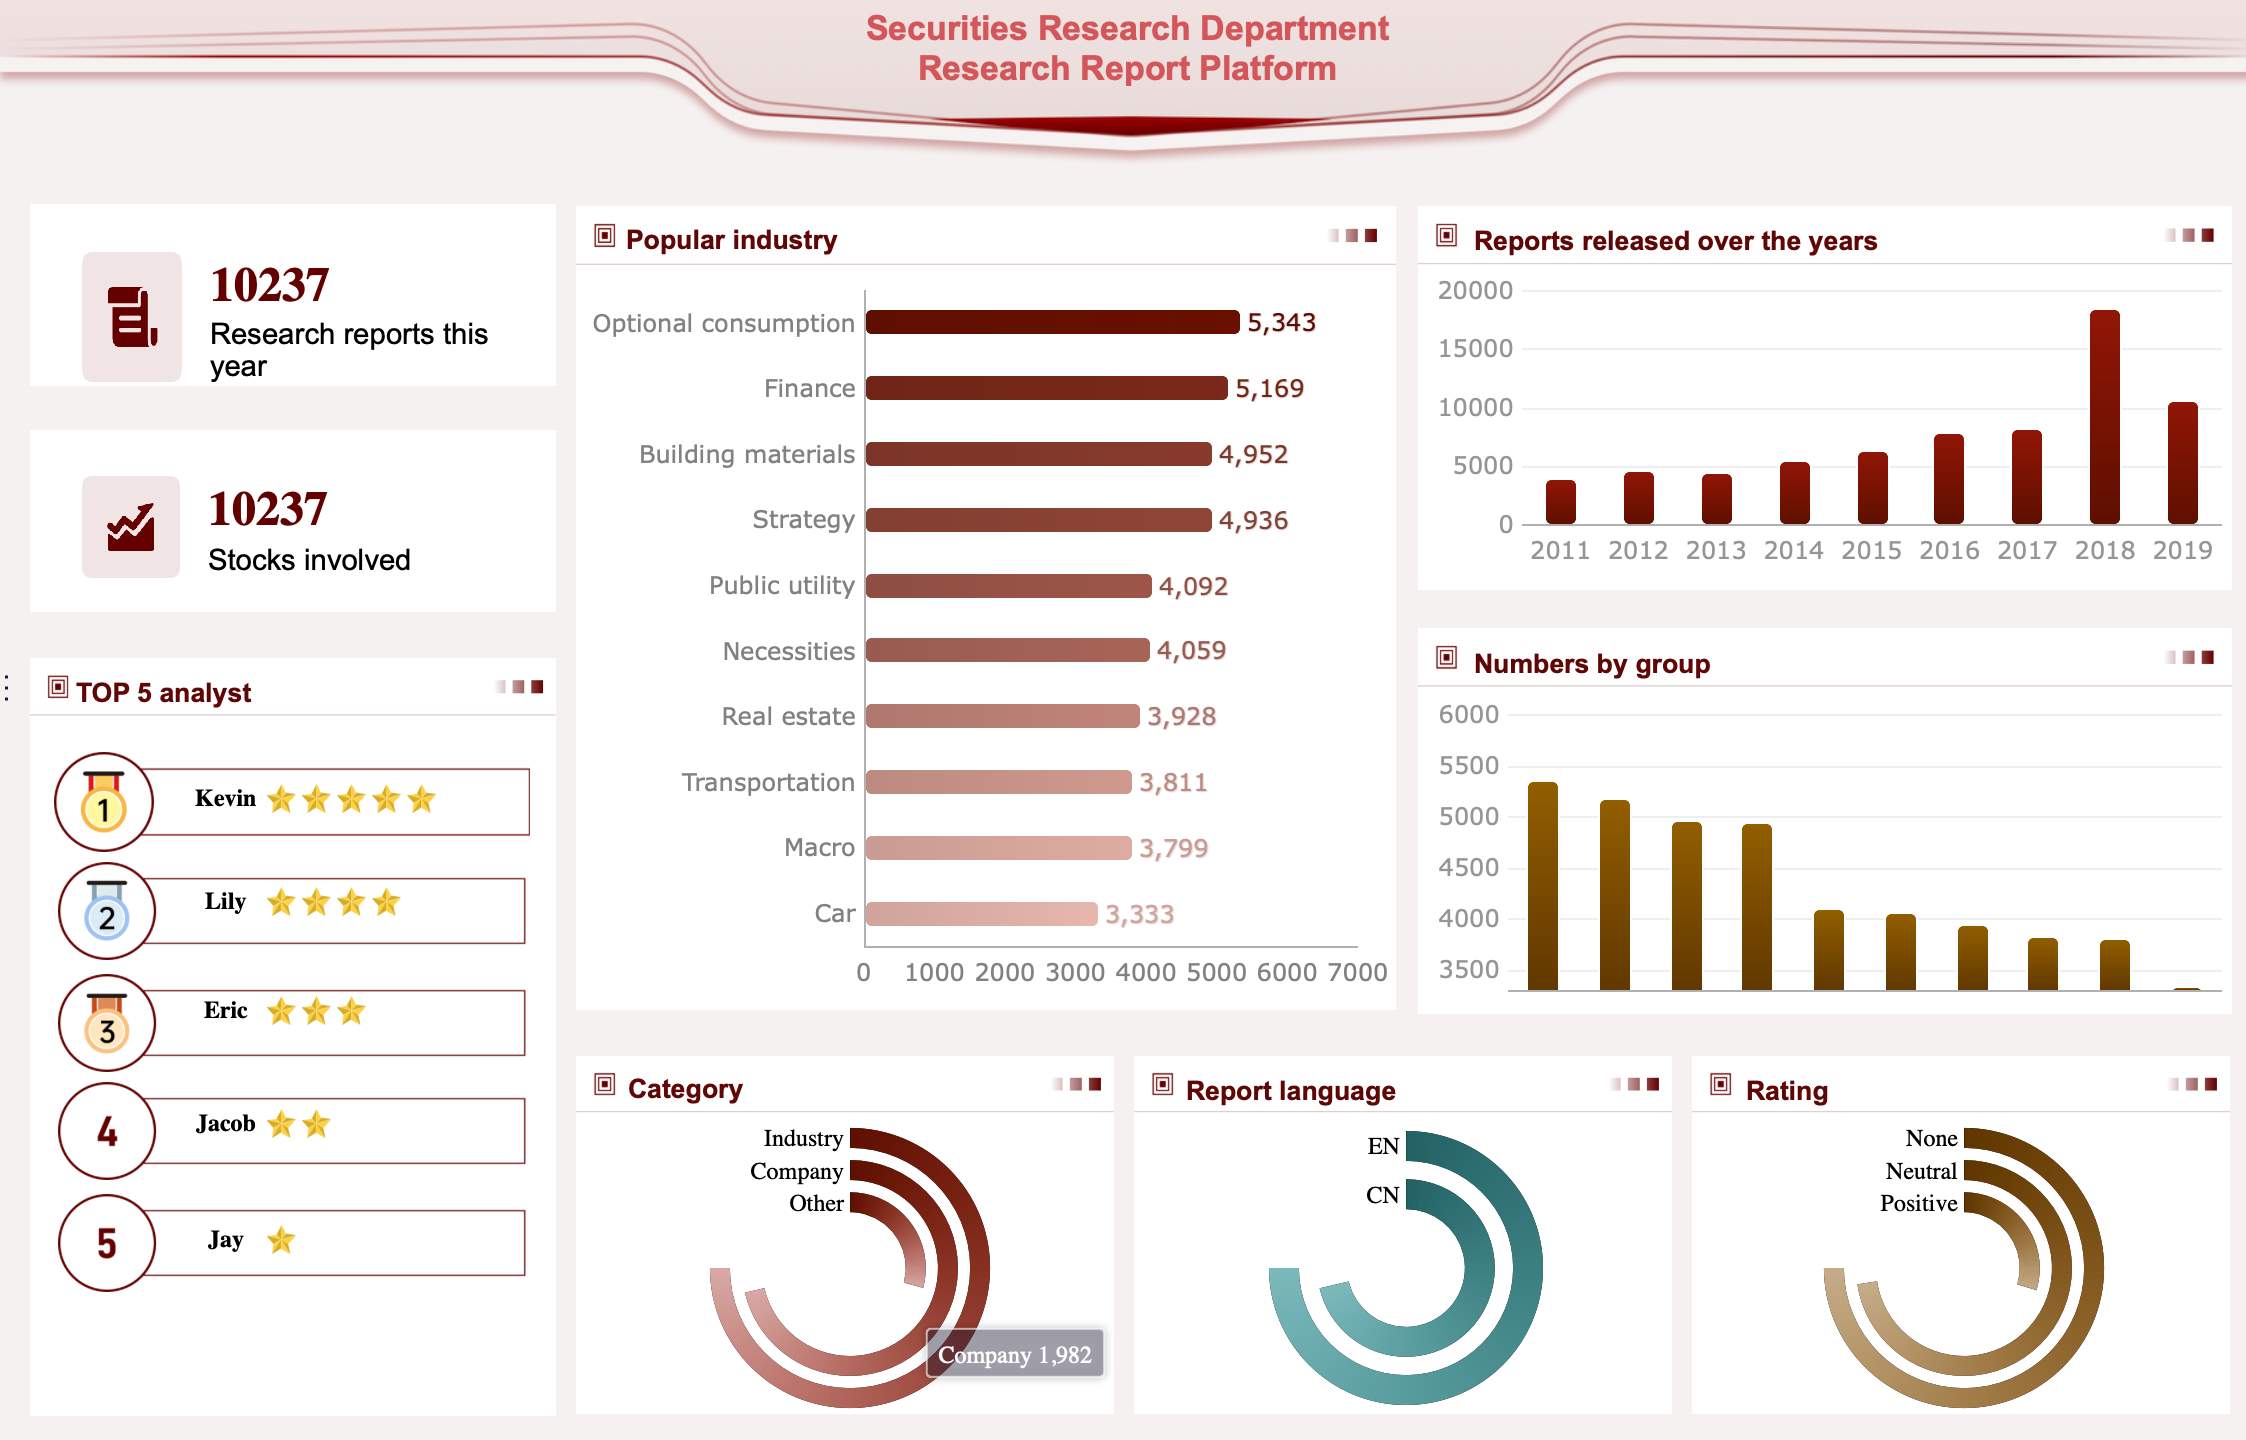
Advanced CRM systems in 2026 leverage AI and machine learning to transform how you manage sales. For instance, FineBI is a tool widely used in the retail industry to track inventory and customer behavior. It helps businesses predict demand fluctuations and optimize stock levels. In finance, FineReport can be used to automate reporting and analyze customer data to identify high-value opportunities and minimize risks.
Securities Research Department Research Report Platform Dashboard Created By FineReport
Tools like FineBI by FanRuan integrate seamlessly with CRM systems, providing advanced data visualization and predictive analytics to help businesses enhance their sales strategies and make data-driven decisions. These technologies analyze large volumes of customer data to predict behaviors and identify sales opportunities.
For example, predictive analytics can help you allocate resources more effectively by forecasting future trends. AI-powered personalization systems tailor products and services to individual customer preferences, enhancing engagement. Automated customer service tools, such as chatbots, provide 24/7 assistance, improving response times and customer satisfaction. These features ensure your sales strategies are both efficient and customer-focused.
Real-Time Data Analysis
Real-time data analysis is a game-changer for sales teams. It provides immediate access to up-to-date information, enabling you to make agile decisions. With real-time insights, you can detect trends or anomalies as they occur. For instance, if sales figures drop unexpectedly, you can quickly identify the cause and take corrective action. This capability also enhances customer experience by allowing automated responses based on live data. By integrating real-time analytics into your CRM system, you can stay ahead of market dynamics and improve overall sales effectiveness.
Business Intelligence Tools
Dashboards and Visualizations
Business intelligence tools simplify complex sales data through visual representations like charts and graphs. FineVis from FanRuan is an ideal solution for businesses seeking dynamic and visually engaging dashboards, helping teams track key sales metrics with ease. Dashboards provide a centralized location for monitoring key metrics, helping you track progress toward targets. For example, heat maps can highlight regions with high sales potential, guiding your team’s efforts. These visualizations make it easier to identify patterns and trends, enabling you to communicate findings effectively to stakeholders. By using BI tools, you can turn raw data into actionable insights that drive better decision-making.
Predictive Features
Predictive features in BI tools empower you to anticipate future sales trends. By analyzing historical data, these tools forecast outcomes, helping you plan strategies with confidence. For instance, predictive analytics can identify high-potential leads, allowing you to focus your efforts where they matter most. This proactive approach ensures you stay prepared for market changes and capitalize on emerging opportunities.
Emerging Technologies
AI-Powered Sales Assistants
AI-powered sales assistants are revolutionizing how you interact with customers. When combined with sales analytics tools, these assistants can provide personalized recommendations, helping sales teams make quicker and more informed decisions. Using the best sales analytics tools can ensure that these AI-driven insights are accurate and actionable.
For instance, tools like FineReport and FineBI help businesses analyze customer data and generate smart, actionable reports that enhance customer interactions and streamline the sales process. These tools automate repetitive tasks, such as scheduling meetings or sending follow-up emails, freeing up your time for more strategic activities. They also analyze customer data to provide personalized recommendations, improving the quality of your interactions. By using AI-powered assistants, you can enhance productivity and deliver a more tailored customer experience.
NLP for Sales Insights
Natural Language Processing (NLP) makes sales data more accessible and actionable. It allows you to extract insights using everyday language, simplifying data analysis across departments. NLP tools uncover hidden trends in unstructured data, such as customer reviews, helping you understand market preferences. They also automate reporting processes, saving time and ensuring consistency. For example, NLP can analyze customer sentiment across channels, enabling you to refine your offerings and improve satisfaction. By leveraging NLP, you can gain deeper insights into your sales performance and make informed decisions.
Big Data and Cloud Computing
Big data and cloud computing have revolutionized how you approach sales analytics. These technologies allow you to process and analyze massive datasets efficiently, giving you deeper insights into your sales performance. With big data, you can uncover hidden patterns, predict trends, and make informed decisions that drive growth.
Cloud computing plays a crucial role in scaling your sales analytics efforts. It provides flexible storage solutions that grow with your needs. You no longer need to invest in expensive hardware upfront. Instead, you can manage and analyze large datasets seamlessly. During peak processing times, cloud platforms let you scale resources on demand. This ensures your operations remain smooth and uninterrupted.
The combination of big data and cloud computing also enhances collaboration. Cloud-based platforms enable your team to access real-time data from anywhere. This fosters better communication and faster decision-making. For example, sales teams can use cloud-based dashboards to monitor performance metrics and adjust strategies instantly.
Another advantage is cost efficiency. Cloud computing reduces infrastructure costs while offering powerful tools for data analysis. You can allocate resources more effectively and focus on optimizing your sales strategies. By leveraging these technologies, you gain a competitive edge in today’s data-driven market.
Sales analytics tools powered by big data and cloud computing provide actionable insights. They help you identify high-value opportunities and refine your approach. Whether you’re forecasting sales trends or analyzing customer behavior, these tools ensure you stay ahead of the competition.
Incorporating big data and cloud computing into your sales analytics strategy transforms how you operate. These technologies empower you to make smarter decisions, improve efficiency, and scale your business with ease.
Steps to Implement Sales Analytics Effectively
Define Goals and Objectives
Defining clear goals is the foundation of implementing sales analytics. Start by identifying what you want to achieve. For example, you might aim to improve forecasting accuracy or uncover new sales opportunities. Align these goals with your business objectives to ensure relevance. Select key performance indicators (KPIs) that reflect these objectives, such as conversion rates or customer acquisition costs. These metrics will guide your analytics efforts and help you measure success.
Be specific about your goals. Instead of a vague aim like "boost sales," focus on actionable targets like "increase conversion rates by 15% within six months." This clarity ensures your team remains focused and aligned throughout the process.
Collect and Organize Data
Data is the backbone of sales analytics. Begin by gathering data from all relevant sources, such as CRM systems, marketing platforms, and customer feedback. Ensure the data is accurate, consistent, and complete. Poor data quality can lead to unreliable insights, so prioritize cleaning and organizing your datasets.
Centralize your data in a single platform to streamline analysis. This approach eliminates silos and ensures all teams work with the same information. For example, integrating sales and marketing data can reveal how campaigns influence customer behavior. Regularly update your data to maintain its relevance and accuracy.
Select the Right Sales Analytics Tools
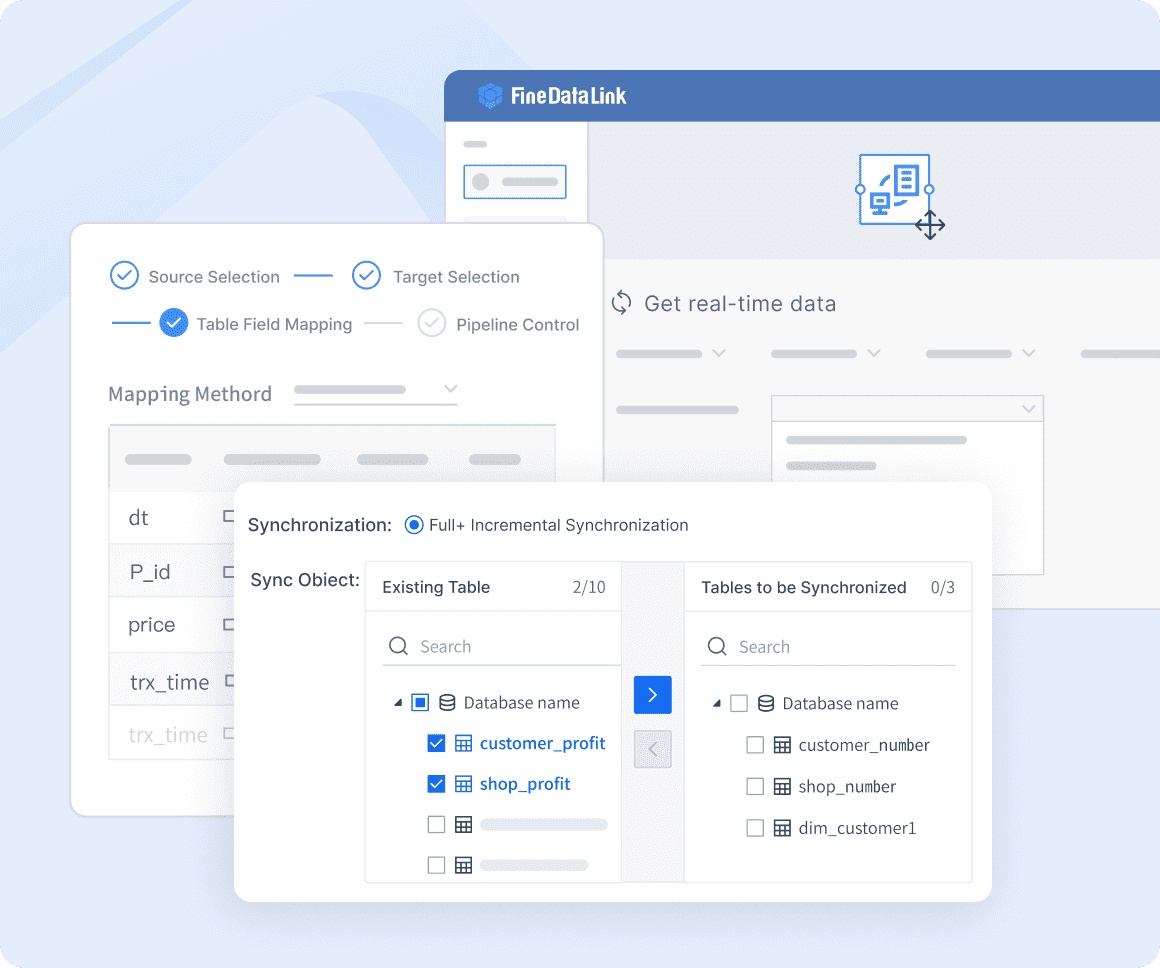
Choosing the right tools is critical for implementing sales analytics effectively. To streamline your sales process, it’s essential to select tools that integrate seamlessly with your existing systems. Best sales analytics tools like FineBI provide customizable solutions that allow businesses to tailor reports and dashboards for real-time insights.
In addition, FineDataLink from FanRuan streamlines data integration by connecting multiple sources, ensuring your sales analytics process is built on a solid foundation of accurate, real-time data. Look for tools that integrate seamlessly with your existing systems to ensure smooth data flow. Prioritize those offering real-time reporting and dashboards for immediate insights. Predictive analytics capabilities are also essential for forecasting trends and customer behavior.
Customizability is another key factor. Select tools that allow you to tailor metrics to your unique needs. A user-friendly interface is equally important, as it ensures your team can easily access and interpret data. For example, tools with automated data collection simplify monitoring KPIs and reduce manual effort. By investing in the right tools, you can unlock the full potential of sales analytics.
Train Teams and Build a Data-Driven Culture
Building a data-driven culture starts with empowering your team to understand and use sales analytics effectively. Training ensures everyone can interpret data and apply insights to improve performance. Follow these steps to equip your team for success:
Provide training sessions tailored to different skill levels. Teach non-technical users how to interpret data and make informed decisions.
Create user guides and resources that explain how to leverage analytics tools. These materials should simplify complex processes and encourage consistent usage.
Use sales analytics to identify top-performing behaviors. The top 30% of sales reps outperform the bottom 30% by up to four times. Analyze their habits and skills to design targeted training programs.
Encourage collaboration by fostering open discussions about data insights. When team members share findings, they build a collective understanding of what drives success. Highlight how analytics eliminates uncertainty in decision-making. For example, data on customer feedback and sales performance helps leaders recommend actionable strategies with confidence.
Promote a mindset that values continuous learning. Celebrate wins achieved through data-driven decisions to reinforce the importance of analytics. Over time, this approach will embed a culture where data guides every action.
Monitor and Refine Analytics Processes
Monitoring and refining analytics processes ensures your sales strategies remain effective. Use real-time monitoring dashboards to gain immediate insights into key performance indicators (KPIs). These tools allow you to detect trends and make quick adjustments. For example, if a KPI like conversion rate drops, you can identify the issue and act swiftly.
Dynamic data visualization enhances your ability to track updates. Visual tools like graphs and charts simplify complex data, making it easier to spot optimization opportunities. Early detection of operational issues minimizes disruptions and keeps your sales pipeline running smoothly.
Regularly review your analytics processes to identify areas for improvement. Continuous monitoring uncovers inefficiencies and highlights opportunities to refine your approach. For instance, analyzing resource utilization can reveal ways to allocate efforts more effectively. This ensures your team focuses on high-value activities.
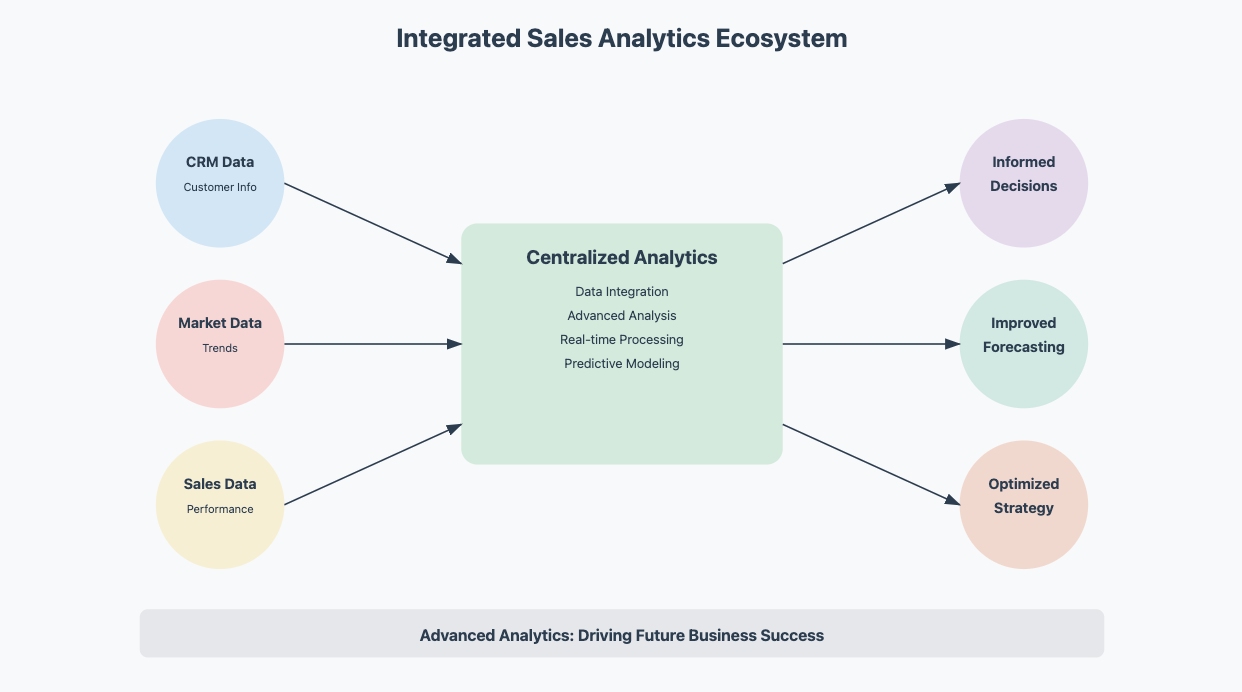
Adopt an integrated system that centralizes data from various sources. This approach provides a holistic view of your sales performance, enabling better decision-making. By refining your analytics processes, you can adapt to changing market conditions and maintain a competitive edge.
Sales analytics has become a cornerstone for business success. It empowers you to make informed decisions, improve forecasting, and optimize sales strategies. Advanced tools play a pivotal role in shaping its future by enhancing decision-making and streamlining processes.
To leverage these tools effectively:
Identify your business needs.
Evaluate the features of various tools.
Choose a tool that aligns with your sales goals.
These tools also offer predictive analytics to forecast trends and prescriptive analytics to recommend actionable strategies.
In 2026, prioritizing sales analytics is critical for staying competitive. Businesses increasingly rely on data-driven decision-making to understand customer behavior and market trends. Analytics improves forecasting accuracy, helping you plan and budget effectively. It also identifies strengths and weaknesses, enabling better training and goal setting.
Evidence Point
Description
Data-Driven Decision-Making
Organizations use big data and analytics to gain insights into customer behavior.
Enhanced Sales Forecasting
Analytics improves forecasting accuracy, crucial for planning and budgeting.
Identification of Strengths and Weaknesses
Teams recognize areas for improvement, leading to better training and goal setting.
By embracing sales analytics, you position your business for long-term growth and success in an increasingly data-driven world.
FAQ
What is the difference between predictive and prescriptive analytics?
Predictive analytics forecasts future trends based on historical data. It helps you anticipate customer behavior or sales outcomes. Prescriptive analytics goes further by recommending specific actions to achieve desired results. It provides actionable insights, guiding you on what steps to take next for optimal performance.
How can small businesses benefit from sales analytics?
Sales analytics helps small businesses identify trends, optimize strategies, and improve decision-making. It enables you to focus on high-value customers, streamline operations, and allocate resources effectively. Even with limited budgets, analytics tools provide insights that drive growth and enhance customer satisfaction.
What are the most important sales metrics to track?
Key metrics include total revenue, conversion rates, customer lifetime value (CLV), and sales cycle length. These metrics help you evaluate performance, identify opportunities, and refine strategies. Tracking them ensures you stay informed about your business's health and make data-driven decisions.
Do I need advanced tools to start with sales analytics?
You don’t need advanced tools to begin. Start with basic tools like spreadsheets or simple CRM systems. As your business grows, you can adopt more sophisticated solutions with features like AI and predictive analytics to gain deeper insights.
How often should I review my sales analytics?
Review your sales analytics regularly, ideally weekly or monthly. Frequent reviews help you spot trends, address issues, and adjust strategies quickly. For example, monitoring conversion rates weekly ensures you identify and resolve bottlenecks in your sales funnel promptly.
Key Takeaways
Sales analytics helps companies do better by studying data.
Learning how customers act helps with better ads and happier buyers.
Predictive analytics guesses future trends, so businesses can plan ahead.
Good sales tools make data easy to collect and use.
Watching sales numbers often helps fix problems and grow faster.
Click the banner below to experience FineReport for free and empower your enterprise to convert data into productivity!