If you're comparing Tableau vs Power BI, you're probably not just choosing a dashboard tool. You're deciding how your team will collect data, prepare it, build reports, share insights, and govern analytics at scale in 2026.
For business teams, the real question is not which platform has more features on paper. It is which one fits your reporting workflow, internal skill mix, data environment, and rollout goals. A finance team may prioritize governance and scheduled reporting. An operations team may need faster self-service analysis. A leadership team may care most about clean dashboards and broad access.
In practice, both Tableau and Power BI are strong BI platforms. Power BI is often attractive for organizations already invested in Microsoft. Tableau is widely recognized for visual exploration and dashboard flexibility. The right choice depends on how your business actually works.
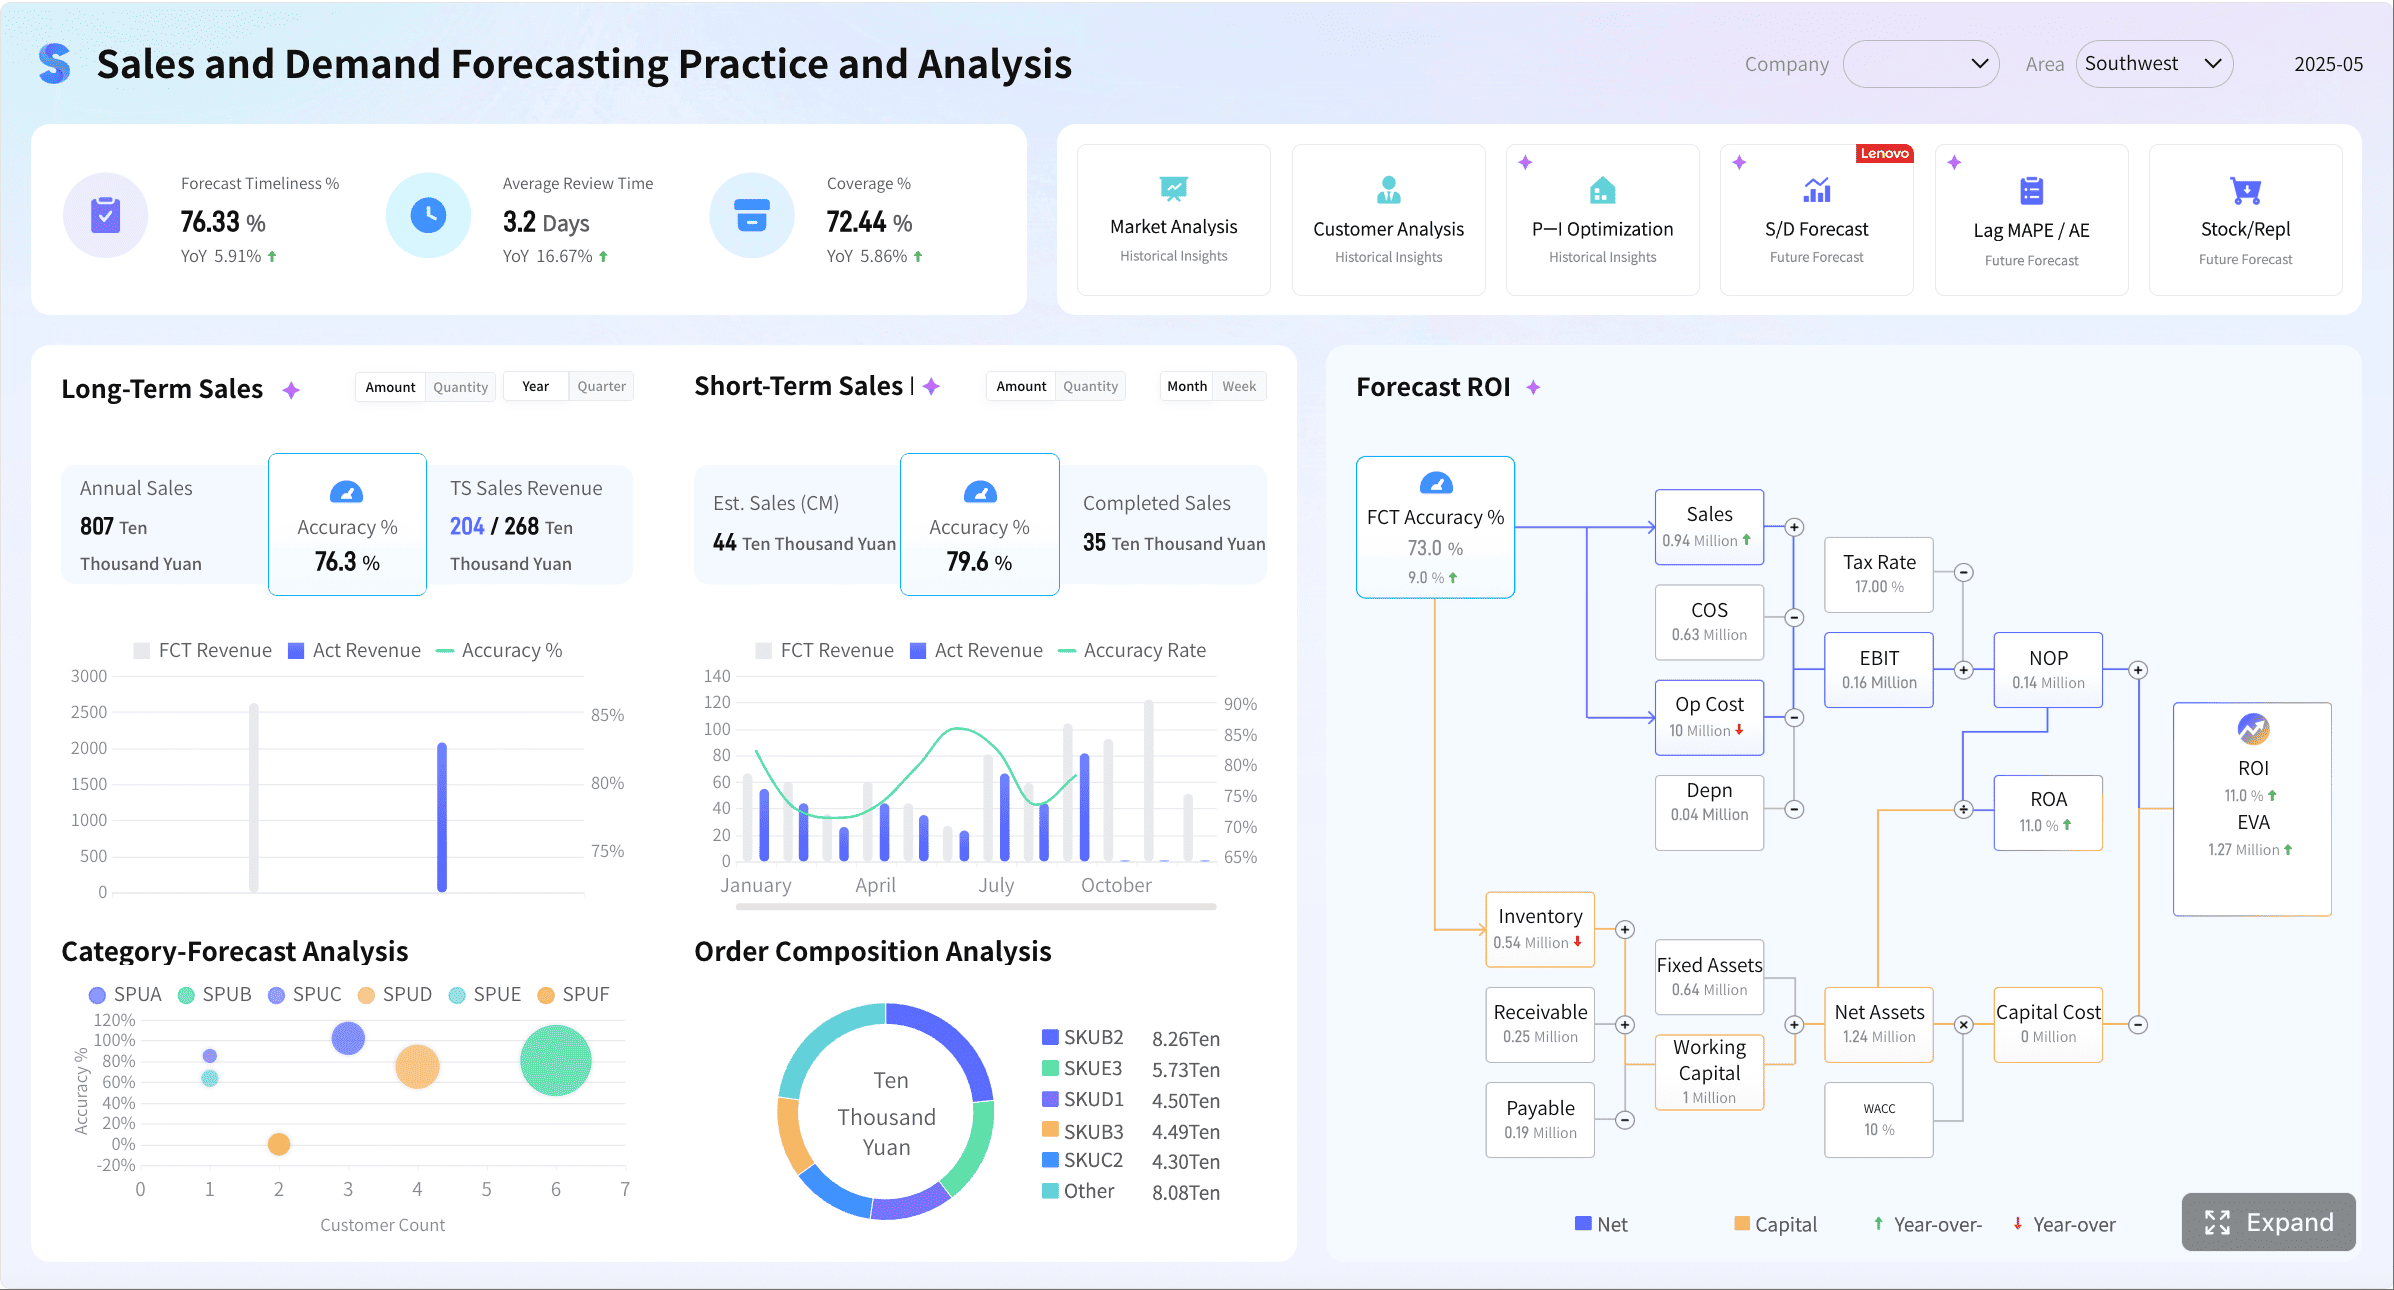
Customer Intelligence Sales Dashboard created with FineBI
Strong for analytics and visual exploration; often favored for analyst-driven use cases
Collaboration
Works well with Microsoft 365, Teams, SharePoint, Azure, and related services
Strong sharing and analytics collaboration for teams centered on Tableau workflows
Deployment
Often appealing to organizations already standardized on Microsoft technologies
Commonly chosen where visualization depth and analyst capability are priorities
Learning curve
Easier to start for many business users, harder as modeling becomes more complex
Powerful but typically requires more ramp-up for non-analysts
Recommended users
Business analysts, reporting teams, department managers, Microsoft-led enterprises
Data analysts, BI specialists, teams prioritizing visual analysis and dashboard craft
Tableau vs Power BI: What Business Teams Should Compare First
Before comparing features, define the workflow you need to support. Most BI tool decisions become clearer when you stop asking, “Which tool is better?” and start asking, “Which tool helps our team deliver reliable reporting faster?”
Define the reporting workflow you need to support, from data collection to dashboard delivery
A reporting workflow usually includes five stages:
Data collection from spreadsheets, databases, cloud apps, or enterprise systems
Data preparation for cleaning, shaping, and combining datasets
Analysis and modeling to create business metrics and reusable logic
Dashboard or report creation for different stakeholder groups
Sharing, permissions, and maintenance across teams
Power BI and Tableau can both support this workflow, but they emphasize different strengths.
Power BI is often favored when reporting workflows are tightly connected to Microsoft tools and centralized data models.
If your reporting process is already slow, fragmented, or overly dependent on a few analysts, that matters more than a feature checklist.
Identify who will use the tool most often: analysts, managers, executives, or cross-functional teams
The best BI choice changes depending on the primary user group.
Analysts often care about modeling depth, flexibility, and exploration speed.
Managers usually want easy filtering, reliable KPIs, and fast answers.
Executives care about clarity, consistency, and trust in the numbers.
Cross-functional teams need easier adoption, shared definitions, and governance.
This is one reason many enterprises struggle with BI rollout. A tool that works well for analysts may not scale smoothly to broad business adoption without additional training, administration, and governance effort.
Clarify whether speed, governance, customization, or total cost matters most in 2026
In 2026, most business teams are balancing four priorities:
Speed: How quickly can reports be built and updated?
Governance: Can metrics, permissions, and data access be managed consistently?
Customization: How flexible are the dashboards and interactions?
Total cost: What does the tool require in licensing, training, support, and administration?
There is no universal winner across all four. Power BI often enters the shortlist on cost and Microsoft alignment. Tableau often earns attention for visualization quality and exploratory analytics. Your decision should reflect your reporting reality, not market buzz.
Side-by-Side Comparison for 2026
Ease of use and learning curve
For many business teams, Power BI feels more approachable at the start, especially if users already work heavily in Excel, Microsoft 365, or related Microsoft services. The interface and workflow are familiar enough that analysts and report builders can often move quickly into dashboard creation.
Its challenge appears later: as your organization needs more sophisticated data models, reusable measures, and advanced logic, users may need stronger skills in DAX and data modeling.
Tableau is widely respected for interactive visual analysis, but for non-technical business users, adoption can take longer. It is often easier to admire Tableau dashboards than to build them confidently without practice. Teams with experienced analysts usually benefit most from Tableau’s flexibility.
For business reporting teams, the practical takeaway is:
Power BI can be easier to adopt initially for Microsoft-oriented users.
Tableau often rewards teams that already have stronger analytical skills and want greater visual exploration freedom.
Data connectivity and preparation
Both tools support a broad range of enterprise data scenarios, but the workflow differs.
Power BI is especially strong in environments where teams need robust preparation and modeling inside a Microsoft-centered analytics stack. Its Power Query capabilities are mature and practical for cleaning and transforming business data. For teams that need advanced analytical logic, DAX is a major strength.
Tableau supports diverse data analysis use cases and is often chosen for interactive analytics across multiple sources. However, data preparation workflows may require more planning depending on how the team structures Tableau usage and supporting tools.
As datasets grow, the key issue is not only connector count. It is whether your team can keep data preparation repeatable, governed, and maintainable.
Whether preparation is handled by analysts or centralized data teams
Whether semantic definitions must be reused across departments
How much data volume and refresh complexity your workflow includes
Visualization quality and dashboard flexibility
This is the category where Tableau vs Power BI becomes most visible to end users.
Tableau is often seen as the stronger option for:
Rich visual exploration
Polished storytelling
Flexible interactions
Analyst-led dashboard refinement
Its reputation comes from how effectively it supports exploratory analysis and presentation-quality visual dashboards.
Power BI is highly capable for business dashboards and self-service reporting. It works well for KPI monitoring, operational analysis, and departmental reporting. Many teams can create effective dashboards quickly, especially when they prioritize business clarity over visual experimentation.
In simple terms:
Choose Tableau when visual depth and analysis freedom are core priorities.
Choose Power BI when practical self-service reporting and business accessibility matter more than pushing visual design to the limit.
Collaboration, governance, and security
For business reporting, this category matters more in 2026 than ever. BI tools are no longer used only by analysts. They are shared across finance, HR, operations, supply chain, sales, and leadership teams.
Power BI benefits from its close connection to Microsoft collaboration and enterprise environments. For many organizations, this can simplify adoption and sharing when Teams, SharePoint, Azure, and Microsoft 365 are already standard.
Tableau supports enterprise analytics sharing and governance as well, but some teams find that wider rollout requires more deliberate administration and ownership structures, especially when balancing analyst freedom with enterprise control.
Business teams should examine:
User permissions and row-level access needs
Version management and content sprawl risks
Whether reports must be embedded in existing workflows
How regulated the reporting environment is
Who owns governance: IT, BI, or business teams
Pros and Cons for Business Reporting Teams
Where Power BI stands out
Power BI commonly stands out in these scenarios:
Microsoft ecosystem integration: A strong fit for teams already using Microsoft 365, Teams, SharePoint, Azure, and related services
Cost awareness: Often attractive for organizations trying to expand BI access without overcomplicating purchasing decisions
Self-service reporting: Practical for business users who need recurring dashboards and easy data consumption
Data preparation and modeling: Power Query and DAX are important strengths for teams with growing analytical maturity
Broad talent availability: Many organizations can find training resources and community support more easily
For reporting teams, Power BI is often a sensible choice when the goal is to scale analytics efficiently across a Microsoft-centered organization.
Where Tableau stands out
Tableau stands out most clearly in these areas:
Visual exploration: Strong support for interactive analysis and analyst-led discovery
Dashboard polish: Often preferred when stakeholders care deeply about visual quality and storytelling
Advanced analytics workflows: Well suited for teams where professional analysts drive insight generation
Design flexibility: Helpful when dashboards need greater refinement and exploratory interaction
For organizations with dedicated analysts and heavier demands on visual analysis, Tableau can justify its place through the quality of analytical experience.
Common trade-offs to expect
Most business teams should expect trade-offs rather than a perfect fit.
Common examples include:
Cost vs flexibility: Lower entry cost may not always deliver the most refined visual experience
Ease of adoption vs analytical depth: A platform that is easier for general users may still require specialists for advanced work
Analyst freedom vs governance: The more flexible a tool is, the more carefully standards may need to be managed
Scalability vs simplicity: Enterprise expansion often introduces admin and governance complexity
Customization vs consistency: Highly customized dashboards can be powerful, but harder to standardize across departments
A mature BI strategy usually accepts these trade-offs and chooses the platform that best matches the organization’s operating model.
Which Tool Best Fits Different Reporting Workflows
Best fit for Microsoft-first organizations
If your organization already runs heavily on Microsoft tools, Power BI is often the more natural fit.
Existing Microsoft governance and identity workflows
In these cases, implementation can feel more connected to current habits, which often improves adoption and lowers friction for business teams.
Best fit for data-heavy and visualization-driven teams
If your reporting workflow depends on:
exploratory analysis,
deeper analyst involvement,
highly interactive visual storytelling,
polished stakeholder presentations,
then Tableau may be the better choice.
This is often true for data teams supporting strategy, performance management, market analysis, or executive storytelling where dashboard craftsmanship and analytical freedom matter more than standardization alone.
Best fit for mixed-skill business teams
This is where many enterprises struggle. Some users need simple KPI dashboards. Others need advanced slicing, comparisons, and ad hoc analysis. A small number of specialists may build the data models while broader business teams consume insights.
In this situation, your selection should focus on three questions:
Can non-technical users navigate the dashboards confidently?
Can analysts still perform deeper analysis without rebuilding everything?
Can the business scale usage beyond one expert team?
This is also where some organizations consider platforms designed for self-service BI adoption across wider business teams, especially when they want easier rollout rather than an analyst-only BI culture.
How to Make the Final Decision in 2026
A smart decision process is more valuable than a long comparison spreadsheet.
Use a practical shortlist based on budget, reporting complexity, governance needs, and internal skills
Shortlist based on these criteria:
Budget: Include licenses, implementation effort, support, and training
Reporting complexity: Distinguish between routine KPI dashboards and analyst-driven investigation
Governance needs: Define ownership for permissions, data definitions, and publishing standards
Internal skills: Be honest about how many users can handle advanced modeling or dashboard design
Run a pilot with real business questions, real datasets, and clear success metrics
Do not evaluate BI tools using sample data alone. Use real reporting scenarios, such as:
Choose the platform that matches your team’s workflow today while still supporting future growth
Avoid choosing only for the “future ideal state.” Most BI projects fail because the platform does not match the team’s current workflow, skill level, or governance maturity.
A good BI platform should help you succeed now while leaving room for broader adoption later.
Practical Recommendations for Business Teams Comparing Tableau vs Power BI
Here are five practical recommendations I would give any BI manager or reporting lead:
Map your reporting workflow before comparing features.
List where data comes from, who prepares it, who builds dashboards, and who consumes them.
Separate creator needs from viewer needs.
A tool that works for analysts may not be ideal for hundreds of business users.
A Practical Alternative for Mixed-Skill Business Teams: FineBI
Tools like Tableau and Power BI are widely used in the BI market, but teams that need a more business-user-friendly, self-service BI platform may also consider FineBI.
FineBI is positioned for organizations that want to expand analytics beyond a small analyst group and support broader enterprise adoption. Instead of focusing only on expert-driven visual analysis, it is designed to help business users participate more directly in reporting and interactive analysis.
For teams comparing Tableau vs Power BI, FineBI may be relevant when your biggest challenge is not just chart quality or licensing structure, but questions like:
How do we make BI easier for more employees to use?
How do we support self-service analysis without overwhelming business teams?
How do we accelerate dashboard iteration across departments?
How do we combine data preparation and analysis in a more practical workflow?
This makes FineBI worth considering for mixed-skill organizations where analyst capability matters, but broad business usability matters even more.
Get Ready-to-Use Dashboard Templates in Fine Gallery
Enhanced by Dora: AI-Powered Analytics Assistant
What sets FineBI apart in 2026 is Dora, its integrated AI assistant layer that transforms how teams interact with governed data assets. Dora goes beyond simple question-answering—it actively queries your data, generates reports, creates alerts, pushes daily briefings, and follows up automatically.
Key Dora capabilities include:
Natural Language Query: Ask questions like "Show me sales trends by region last quarter" in plain English, and receive instant visualizations grounded in FineBI's trusted metrics
Automated Report Generation: Describe your reporting needs, and Dora creates complete dashboards with appropriate chart types and KPIs
Proactive Monitoring: Dora continuously analyzes data patterns and sends alerts when significant changes occur, enabling proactive decision-making
Daily Briefings: Receive automated summaries of key metrics and anomalies tailored to your role
Intelligent Follow-ups: Dora doesn't just answer questions—it suggests next steps, related analyses, and potential actions
This combination makes FineBI particularly effective for organizations where:
Business users need independent data exploration without heavy IT dependency
Teams require real-time analytics for fast-moving decisions
Governance and security are critical (role-based permissions, audit trails)
Speed matters more than pushing visual design to the absolute limit
Neither is universally better. Power BI often fits Microsoft-first and cost-conscious teams, while Tableau is often stronger for analyst-led exploration and more flexible visual storytelling.
For many business users, Power BI is easier to start with, especially if they already use Excel and other Microsoft tools. Tableau can feel intuitive for visual analysis, but advanced use often requires more training.
Start by mapping your workflow from data collection and preparation to dashboard sharing and governance. The best choice is the platform that helps your team deliver reliable reports faster with the skills and systems you already have.
Power BI works closely with Microsoft 365, Teams, SharePoint, Azure, and Excel, which can simplify rollout and collaboration. That alignment often makes deployment, governance, and adoption easier for existing Microsoft environments.
Yes, both can support enterprise reporting, permissions, and controlled access to data. The difference is usually in how naturally each tool fits your team's governance model, user mix, and analytics style.
Product Trial
FineReport
Pixel-perfect reports · Interactive dashboards · Easy data entry · Digital twins