A Tableau dashboard is a single interactive screen that combines multiple charts, tables, maps, and KPI views so users can analyze related business data in one place. If you are new to Tableau, you are probably trying to understand how dashboards work, how they differ from worksheets, and how filters and actions make analysis more interactive.
For beginners, the main idea is simple: instead of flipping between separate charts, a Tableau dashboard brings those views together so you can monitor performance, explore trends, and share insights more efficiently.
Clear business goal: The dashboard should answer one main question or support one key decision.
Relevant KPIs: Show only the metrics users need to monitor or compare.
Logical visual layout: Put the most important information where users see it first.
Interactive filters: Let users refine results by date, region, product, team, or other dimensions.
Connected views: Charts should work together so one selection can update others.
Readable design: Titles, labels, legends, and formatting should make the dashboard easy to scan.
Trusted data: A dashboard is only useful when the underlying data is current and reliable.
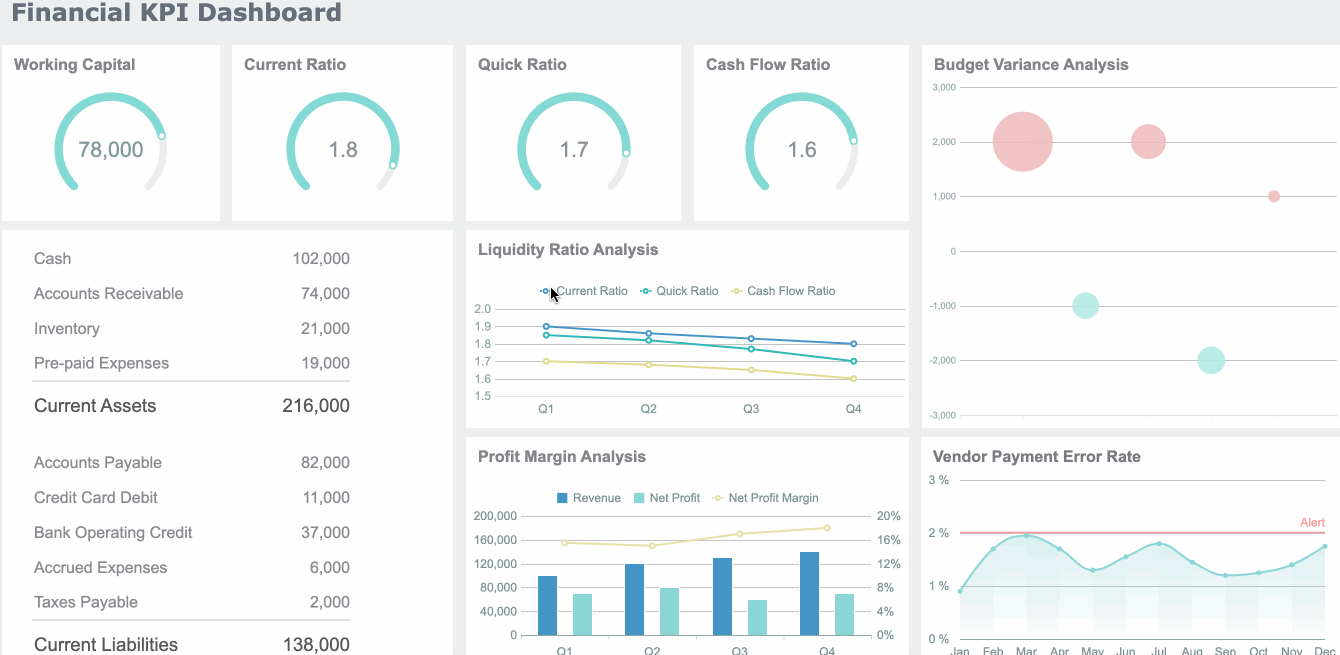
What Is a Tableau Dashboard and Why It Matters
A dashboard in Tableau is a collection of several views displayed together in one workspace. Those views usually come from individual worksheets. Once combined, they help users compare different parts of the same business story without switching tabs constantly.
This matters because most business questions are not answered by a single chart. Teams often need to look at performance from several angles at once.
Why beginners use Tableau dashboards
Tableau dashboards are commonly used to:
Monitor performance: Track revenue, margin, conversion, inventory, or service levels
Explore trends: Find patterns over time, by region, by customer segment, or by product
Share insights: Present findings to managers, executives, or operational teams in a visual format
Support interactive analysis: Let users click, filter, and drill into the data instead of reading a static report
A well-designed tableau dashboard helps turn a set of separate visuals into a practical decision-making tool.
Core Parts of a Tableau Dashboard
Understanding the building blocks of a tableau dashboard makes the creation process much easier.
Views, sheets, and layout basics
Beginners often confuse worksheets, views, and dashboards.
Here is the simplest way to think about them:
Worksheet: The page where you build a single visualization
View: The visual output shown on that worksheet, such as a bar chart, line chart, map, or table
Dashboard: The screen where multiple views are combined into one interactive layout
So if you create a sales trend line chart, a profit map, and a product bar chart on separate worksheets, you can then place them together on one dashboard.
A Tableau dashboard may include:
Charts
Crosstabs or tables
Maps
KPI summary cards
Text blocks
Images
Navigation or interactive objects
The layout is what makes these elements usable. Good layout helps viewers understand what matters first, what supports the main story, and where to interact.
Filters, actions, and interactivity
This is where a tableau dashboard becomes more than a static screen.
Filters let users narrow the data shown. For example, a user might filter by:
Month
Region
Product category
Sales channel
Department
Actions connect one view to another. For example:
Clicking a bar in a category chart filters the map and trend chart
Hovering over a data point highlights related marks elsewhere
Selecting a region updates all the other views on the dashboard
This interactivity helps users answer follow-up questions quickly. Instead of asking for a new report, they can explore the question themselves.
For beginners, one of the most useful patterns is using a chart as a filter. This turns the dashboard into a guided analysis experience rather than a fixed summary page.
Device and audience considerations
A dashboard that looks good on a large desktop monitor may not work well on a smaller laptop or tablet. That is why screen size and audience matter.
When designing a tableau dashboard, think about:
Who will use it: Analysts, managers, executives, or frontline teams
What they need to do: Monitor KPIs, investigate changes, or present results
Where they will view it: Desktop, browser, meeting room display, or mobile device
A beginner mistake is trying to fit too much onto one screen. A better approach is to match the layout to the user’s goal. Executives may want a concise dashboard with top KPIs and trends, while analysts may need more detail and filtering options.
How to Create a Dashboard in Tableau
The process is usually easier when you build the visual pieces first and assemble the dashboard second.
Connect data and prepare your worksheets
Start with the right data source. Your dashboard will only be useful if the data is organized well enough to support the questions you want to answer.
For beginners, this is an important rule: do not start by designing the dashboard canvas first. Start by creating clear, useful worksheets.
You might create:
A worksheet for monthly revenue trend
A worksheet for sales by category
A worksheet for regional performance
A worksheet for top customers or products
Once each view works well on its own, the dashboard assembly process becomes much smoother.
Assemble the dashboard step by step
After your worksheets are ready, create a new dashboard and begin arranging the sheets.
A typical workflow looks like this:
Create a new dashboard
Drag worksheets onto the canvas
Choose sizing options
Arrange items using containers or layout controls
Add filter controls
Enable actions such as highlight or filter behavior
Add titles, instructions, or annotations
As you assemble the dashboard, focus on usability.
A beginner-friendly tableau dashboard should make it obvious:
What the dashboard is about
Which metrics matter most
Where users should click first
How to reset or change filters
Try to organize the page from top to bottom:
Top: headline KPIs
Middle: trend and comparison charts
Bottom or side: supporting detail and filters
If the dashboard requires too much explanation, the layout probably needs refinement.
Test, refine, and share
Once the dashboard is assembled, test it before sharing it.
Check these basics:
Do all filters work as expected?
Do actions update the correct views?
Is the text readable?
Does the dashboard load quickly enough?
Are labels and titles clear for first-time users?
Does the layout still make sense on a different screen size?
This final step matters because a dashboard that works technically can still fail from a user experience perspective.
Depending on your Tableau environment, dashboards may be shared through Tableau Desktop workflows or published through broader Tableau sharing options for browser-based access and collaboration. For beginners, the key point is to think beyond creation and make sure the intended audience can actually use the dashboard easily.
Best Practices for Interactive Analysis
A tableau dashboard is most effective when it helps users answer questions quickly without overwhelming them.
Focus on one main question per dashboard
Every dashboard should have a primary purpose.
Examples include:
How are sales performing this month?
Which regions are under target?
What products are driving profit decline?
How is customer retention changing over time?
When you try to answer too many unrelated questions in one dashboard, clutter builds fast. Users stop knowing where to look.
A better approach is to prioritize:
One core business question
A few supporting comparisons
The metrics needed to take action
This makes the purpose obvious at a glance and improves decision-making.
Make filters useful instead of overwhelming
Filters are powerful, but too many can make a tableau dashboard confusing.
Good filter design means:
Including only filters users really need
Labeling filters clearly
Grouping related filters together
Avoiding duplicate or overlapping controls
Making it easy to reset selections
For example, if most users always review the last 12 months, you may not need a complex date control with too many options. Simpler filters often create a better experience.
Also remember that filters change context. If users forget a filter is active, they may misread the data. Clear labels and visible filter states help build trust.
Design for speed and trust
Interactive analysis only works when the dashboard feels responsive and reliable.
To improve speed and trust:
Reduce unnecessary charts
Keep formatting consistent
Use direct titles that explain what users are seeing
Highlight important changes with annotations
Avoid decorative elements that slow understanding
Make colors meaningful and consistent across views
Accessibility also matters. Strong contrast, readable text, and careful use of color improve dashboard usability for more people.
A clear tableau dashboard does not just look better. It helps users interpret the data correctly and act with more confidence.
Beginner Mistakes to Avoid and Where to Learn More
Most beginner dashboard problems come from trying to do too much too soon.
Common dashboard problems
Here are some of the most common mistakes in a tableau dashboard:
Too many charts on one page: More visuals do not always mean more insight
Inconsistent formatting: Different fonts, colors, and spacing make the dashboard harder to read
Unclear titles: Users should not have to guess what a chart means
Poor filter design: Too many controls or unclear filter states create confusion
Weak visual hierarchy: Important metrics get buried among less important details
No clear story: The dashboard shows data but does not guide interpretation
A helpful test is this: can a first-time viewer understand the dashboard in under 30 seconds? If not, simplify it.
Helpful next steps for practice
If you are learning tableau dashboard design, the best way to improve is through repeated hands-on practice.
Useful next steps include:
Rebuilding simple dashboards from sample business data
Studying dashboards focused on one business question
Comparing strong and weak layout examples
Practicing filter actions and chart interaction
Reviewing how experienced teams structure KPI dashboards
It also helps to look beyond one tool. Learning dashboard thinking across BI platforms can improve your design judgment, especially when you need to support both analysts and business users.
Practical Recommendations for Choosing and Building Better Dashboards
If you are serious about creating better dashboards, keep these consultant-style recommendations in mind:
Start with the decision, not the chart. Define what the dashboard should help someone decide before selecting visuals.
Design around user behavior. Think about the first click, the common filter path, and the likely follow-up question.
Limit dashboard scope. One dashboard should solve one main problem well rather than many problems poorly.
Prototype with real users early. A dashboard that analysts understand may still confuse business stakeholders.
Evaluate tools beyond visual appeal. Consider data preparation, self-service adoption, sharing, governance, and how quickly teams can iterate.
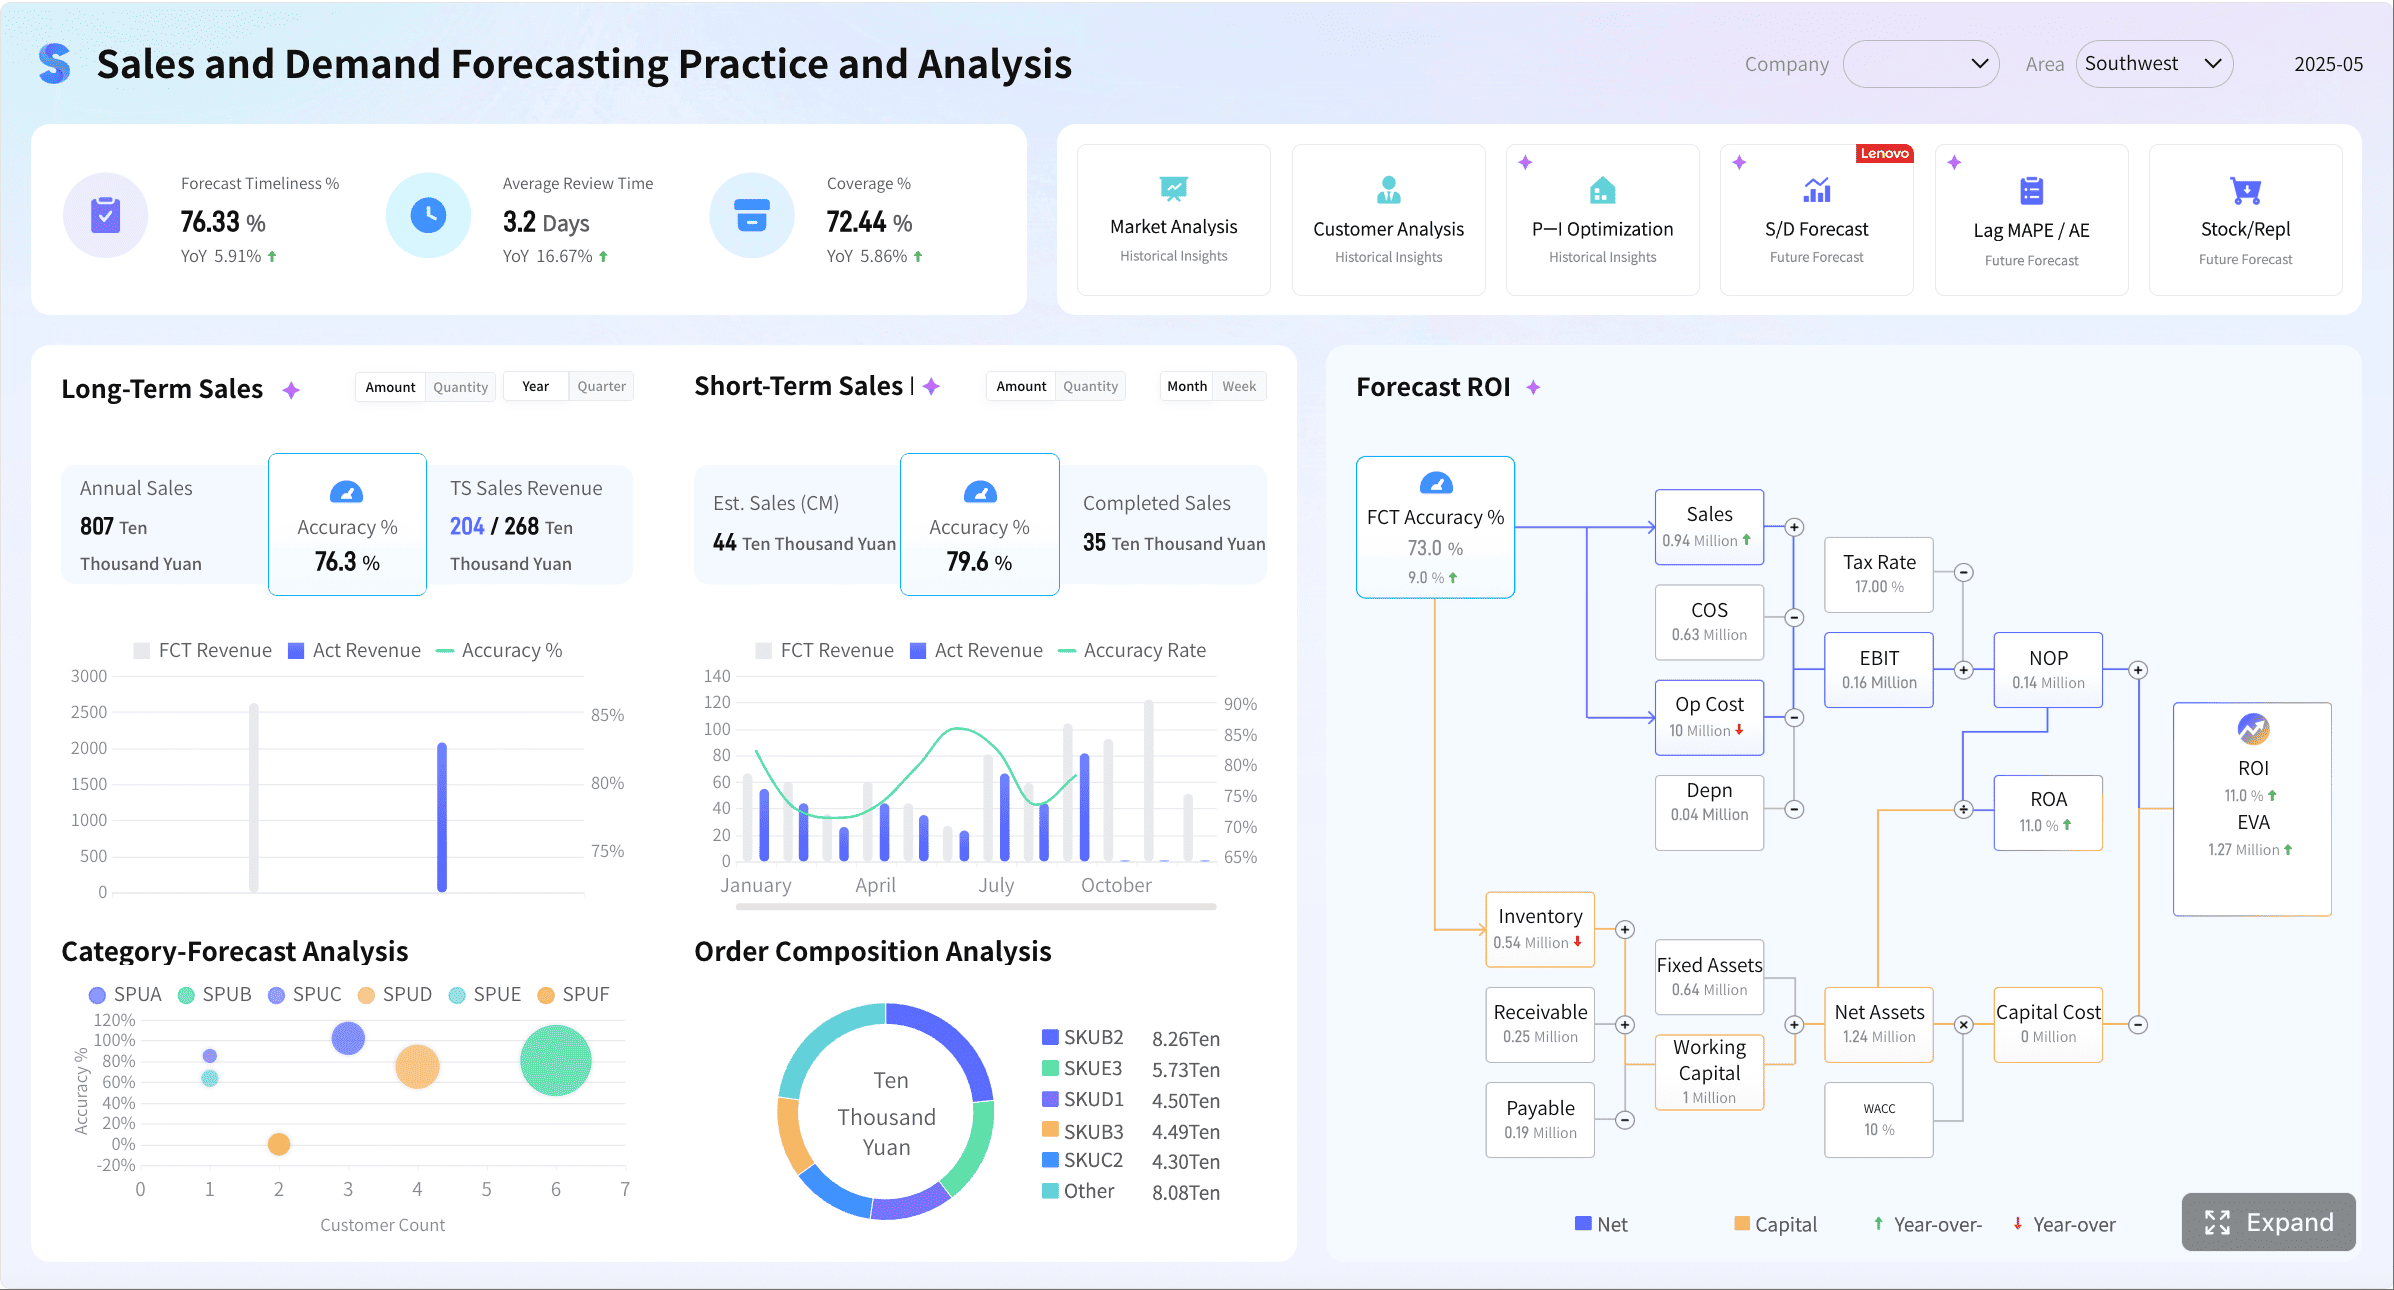
When to Consider FineBI for Interactive Dashboards
Tools like Tableau are widely used in the BI market, especially for visual analytics and interactive dashboards. Tableau is well known for strong visualization capabilities, broad chart support, and a large learning community. For teams centered on exploratory analysis, it remains a familiar option.
At the same time, some organizations need a platform that is easier for broader business teams to adopt, especially when self-service analysis, built-in data preparation, and faster dashboard iteration matter across departments. That is where FineBI can be worth considering.
FineBI is positioned as a self-service BI platform for business users. In practical terms, that means teams can build and explore dashboards with a more business-friendly workflow, while still supporting interactive analysis.
Customer Intelligence Sales Dashboard created with FineBI
This can be especially useful when organizations want dashboards to be used not only by experienced analysts, but also by managers, operations teams, finance users, and business stakeholders who need faster access to insights.
Get Ready-to-Use Dashboard Templates in Fine Gallery
FineBI vs Tableau: where each may fit
This is not a case of one tool fitting every situation.
Tableau is commonly chosen for strong visual analytics and interactive data exploration.
FineBI may be a practical fit for teams that want self-service BI, built-in data processing support, interactive dashboards, and easier adoption for business users.
If your main challenge is not just creating a beautiful dashboard but making analytics more usable across the organization, FineBI is worth evaluating alongside Tableau.
Final Thoughts of Tableau Dashboard
A tableau dashboard is an interactive workspace that combines multiple views into one screen so users can monitor KPIs, compare trends, and explore data through filters and actions. For beginners, the key is to understand the relationship between worksheets, views, and dashboards, then focus on clear layout, useful filters, and a strong business purpose.
If you are learning dashboard design, start simple. Build a few strong worksheets, assemble them thoughtfully, and test the experience from the user’s perspective.
And if your team is also evaluating broader self-service BI options for interactive dashboards and business-user adoption, FineBI is a sensible platform to explore.
A worksheet contains one visualization, while a dashboard brings multiple worksheets and views together on a single screen. Dashboards are used when you want to compare metrics and interact with related charts in one place.
Filters let users narrow the data shown by fields like date, region, or product category. When set up across the dashboard, one filter can update several views at the same time.
Yes, Tableau lets you use one chart as an interactive filter for other views in the dashboard. This helps users click a mark and instantly see related results across the screen.
Start with a clear goal, a few important KPIs, and only the charts needed to answer the main business question. Add simple filters and keep the layout easy to scan so users are not overwhelmed.
First build the individual worksheets, then open a new dashboard and drag those views into the layout. After that, arrange the visuals, add filters or actions, and adjust the design for the intended audience and device.
Product Trial
FineReport
Pixel-perfect reports · Interactive dashboards · Easy data entry · Digital twins