If you are researching power bi license cost, you are probably not just asking, “What does Power BI cost per month?” You are trying to answer a more practical question: what will Power BI actually cost for my team once people start building, sharing, and viewing reports?
That is where many teams get confused. Power BI pricing looks simple at first, but the real cost changes based on how many users create content, how many only view it, whether you need premium features, and whether you are licensing by user or by dedicated capacity.
This guide breaks down the main Power BI license types, explains what drives total cost, and walks through 5 realistic team pricing scenarios so you can estimate the option that fits your actual usage pattern.
Quick Comparison Table
| License type | Best for | Typical pricing model | Sharing and collaboration | Advanced features | Learning curve | Recommended users |
|---|---|---|---|---|---|---|
| Power BI Free | Individual learning and personal report building | Free | Limited sharing; mainly personal use unless content is hosted in eligible premium capacity scenarios | Basic report creation | Low to moderate | Individual analysts, learners, prototype work |
| Power BI Pro | Small teams collaborating internally | Per user, per month | Good for internal sharing and collaboration when users are licensed appropriately | Standard BI features | Moderate | Small to mid-sized teams |
| Power BI Premium Per User | Teams needing premium features without full capacity | Higher per user, per month | Collaboration for users with the right premium access | Larger models, more refreshes, paginated reporting, some advanced capabilities | Moderate to high | Power users, advanced departments |
| Fabric capacity | Organizations needing dedicated capacity and broader scale | Capacity-based, variable by SKU | Better fit for wider distribution and performance-oriented workloads, depending on setup | Enterprise-scale options and broader platform capabilities | High | Enterprises, large viewing audiences, governed BI programs |
The key takeaway: the cheapest list price is not always the lowest total cost. A low per-user plan can become expensive if hundreds of people need access. On the other hand, capacity can be excessive for a small team that only needs internal dashboard sharing.
What drives Power BI license cost for teams
Power BI license cost depends on more than the sticker price of a plan. In practice, team cost usually changes because of four factors: team size, sharing model, refresh requirements, and data scale.
Team size changes the economics fast
If both report creators and viewers need licensed access in your setup, costs rise linearly as more employees need dashboards. A 5-person analytics team may look inexpensive on paper, but once finance leaders, regional managers, or operations staff also need access, total spend can climb quickly.
This is why many teams underestimate Power BI cost at the beginning. They budget for the analysts building reports, but not for the much larger group consuming them.
Sharing needs affect who must be licensed
Power BI cost is heavily influenced by how content is shared:
- Internal sharing across departments
- Executive dashboard access
- External stakeholder access
- Embedded analytics inside a product or portal
A plan that works well for a small internal BI team may not work well for customer-facing analytics or broad enterprise distribution.
Refresh frequency and performance matter
If your team needs dashboards refreshed frequently throughout the day, standard user plans may become limiting. More frequent refresh schedules and higher-performance workloads often push teams toward more advanced license types.
This matters especially for operations, sales, and supply chain teams that rely on near-real-time reporting.
Data volume and feature needs can force upgrades
Some organizations start with standard reporting needs, then later require:
- Larger semantic models
- More frequent refreshes
- Paginated reports
- Advanced governance
- Premium-oriented enterprise features
When that happens, the original low-cost plan may no longer fit.
Per-user pricing vs dedicated capacity
There are two broad ways to think about Power BI license cost:
- Per-user licensing: You pay based on the number of licensed users.
- Capacity-based licensing: You pay for a block of dedicated compute capacity rather than licensing every viewer individually in certain scenarios.
Per-user pricing is easier to start with. Capacity-based pricing can make more sense when you have a large audience, performance demands, or broader organizational deployment goals.
Why the cheapest option can become more expensive later
A low-cost user plan often looks attractive early on. But if more teams join, more dashboards are shared, and more viewers need access, the total monthly cost can exceed what a more scalable setup would have cost from the start.
That does not mean capacity is always better. It means you should compare real usage patterns, not just entry price.
Power BI pricing plans and license types at a glance
Free, Pro, Premium Per User, and Fabric capacity
Here is a simple way to think about the major options.
Power BI Free
Power BI Free is mainly suited to individual use, personal report development, and learning. It lets users build reports, but collaboration and broad sharing are limited.
Best fit:
- Individual analysts
- Students and self-learners
- Early prototypes
Main limitation:
- Sharing and team collaboration are restricted compared with paid plans
Power BI Pro
Power BI Pro is the standard starting point for team collaboration. It is commonly used by organizations that want users to publish, share, and interact with reports across teams.
Best fit:
- Small teams
- Internal departmental reporting
- Standard collaboration
Main limitation:
- Cost scales with user count
- Advanced premium capabilities are not included
Power BI Premium Per User
Premium Per User, often called PPU, is designed for users who need more advanced capabilities than Pro provides. It is still per-user pricing, but at a higher rate.
Best fit:
- Analysts working with larger models
- Teams needing premium-oriented functionality
- Departments that want advanced features without full capacity purchase
Main limitation:
- Costs can add up if many users need premium access
Fabric capacity
Fabric capacity is the capacity-based path and is the closest match for organizations evaluating enterprise-scale deployment, dedicated resources, or broader distribution needs.
Best fit:
- Large organizations
- High-volume consumption scenarios
- Organizations that need performance and scale planning
Main limitation:
- More complex planning
- Higher entry cost than user-based licensing
- Some activities may still require per-user licensing depending on workflow
How to match a license type to the way your team works
The best plan depends on behavior, not brand familiarity.
If your team mainly builds reports individually
A Free setup may be enough for learning or prototyping. Once collaboration starts, teams usually move to Pro.
If your team builds and shares reports internally
Pro is often the first practical option for standard internal collaboration, especially when the group is relatively small and many users need similar access.
If your team needs larger models or premium features
PPU becomes worth evaluating when model size, refresh frequency, paginated reports, or advanced development workflows start to matter.
If your organization has many viewers and wants scale
Capacity-based licensing is typically evaluated when many people need to consume reports, performance matters, or the BI program is becoming enterprise-wide.
If your use case involves external distribution or embedding
Embedded and capacity-oriented approaches need separate planning because customer-facing analytics, application embedding, and external users can change the cost model significantly.
5 real pricing scenarios with example team costs
The following examples use common public pricing references and planning logic, but your actual costs may vary by region, contract, bundled Microsoft agreements, or deployment details. Treat these as decision-making examples, not procurement quotes.
Scenario 1: A small team building and sharing basic reports
A common starting point is a team of 5 to 10 users who need to build reports and share dashboards internally.
Example:
- 2 to 3 users create reports
- 3 to 7 users view and interact with dashboards
- Standard internal sharing
- No major premium feature requirements
If all participating users need Pro-level collaboration, the likely monthly cost is straightforward:
- 5 users × Pro price
- 10 users × Pro price
Using current commonly referenced pricing of about $14 per user/month, that means:
- 5 users: about $70/month
- 10 users: about $140/month
When Pro is enough:
- Reports are moderate in size
- Refresh requirements are standard
- Users are collaborating internally
- No premium-only features are essential
When Pro may stop being enough:
- Data models get larger
- More refreshes are needed
- More users need advanced reporting workflows
Scenario 2: A department with many viewers and a few creators
This is one of the most common pricing decision points.
Example:
- A finance team has 5 report builders
- 80 employees need to consume dashboards
- Sharing is mostly internal
- Leadership wants secure, stable distribution
At first glance, a per-user approach seems simple:
- 85 users × Pro price = total monthly cost
At roughly $14 per user/month:
- 85 users = about $1,190/month
This may still be cheaper than moving to capacity. But the gap narrows as the viewer count grows.
What to compare:
- Total licensed users under Pro
- Performance expectations
- Whether the audience will grow significantly
- Whether enterprise governance needs are emerging
In this scenario, per-user licensing can still make sense, but it starts to become a planning exercise rather than an automatic choice.
Scenario 3: A growing company that needs advanced features
Now consider a team that is scaling up and needs more than standard dashboard sharing.
Example:
- 15 users need access
- 6 are creators or power users
- The team wants larger models, more refreshes, paginated reports, or advanced workflows
If all 15 users need premium-level access, a PPU model might look like:
- 15 users × about 360/month
If only a subset needs premium features and others can remain in a standard access pattern, the planning becomes more nuanced and depends on workspace design and collaboration structure.
When PPU becomes cost-effective:
- The team clearly needs premium-specific capabilities
- Buying capacity would be excessive
- The number of advanced users is still relatively contained
When PPU may become inefficient:
- A much larger viewing audience needs access
- Premium needs expand from a specialist team to the whole organization
Scenario 4: An enterprise evaluating dedicated capacity
This is the scenario many larger organizations eventually face.
Example:
- 20 creators
- 400 to 800 viewers
- High dashboard usage
- Enterprise performance expectations
- Broader rollout plans across departments
At this point, leaders often compare:
- User-based licensing for everyone
- A capacity purchase around $5,000/month
- The operational benefits of dedicated resources
A rough break-even way of thinking:
- If hundreds of viewers all need access, multiplying per-user license cost across the full audience can approach capacity-level spend
- But capacity should not be judged on price alone; performance, scale, and governance also matter
Trade-offs to consider:
- Per-user model: simpler for smaller populations, but grows with headcount
- Capacity model: higher starting commitment, but may fit better for enterprise-scale consumption
Performance benefits of capacity may include:
- More predictable workload handling
- Better alignment for broader consumption
- Enterprise planning around scale and governance
But there are trade-offs:
- More architectural planning
- Higher minimum spend
- More attention to admin and capacity management
This scenario is where organizations should stop asking, “Which plan is cheapest?” and start asking, “Which model fits our future operating pattern?”
Scenario 5: An ISV or embedded analytics use case
Embedded analytics is a separate planning category.
Example:
- A software company wants to show dashboards to customers inside its own product
- External users should not need to log into a separate BI environment
- The company wants customer-facing analytics as part of the application experience
The cost factors here are different:
- Embedded capacity or service model
- Usage intensity
- Concurrency
- App architecture
- Branding and user experience requirements
- Developer effort
- Internal creator licenses
For ISVs, list pricing is only part of the total cost. You also need to consider:
- Multi-tenant design
- Security isolation
- Maintenance effort
- Scaling the embedded environment
- Ongoing administration
In other words, embedded analytics pricing is not just a licensing question. It is also a product architecture and support question.
How to estimate your team’s real cost before you buy
A simple cost calculator approach
Before selecting a plan, gather five inputs:
- Number of creators
- Number of viewers
- Sharing model
- Feature requirements
- Growth expectations
Then estimate your cost in four steps.
Step 1: Count creators and viewers separately
Do not assume everyone needs the same access. Many organizations have:
- A small authoring group
- A much larger viewer population
That distinction is the foundation of realistic budgeting.
Step 2: Define where and how reports will be shared
Ask whether dashboards will be:
- Shared internally only
- Shared across many departments
- Shared externally
- Embedded into an application
A plan that works for internal team collaboration may not work for embedding or broad external consumption.
Step 3: Check feature requirements now, not just later
List any advanced needs such as:
- Larger models
- More frequent refreshes
- Paginated reports
- Premium-level development workflows
- Capacity planning for scale
Only move up when those requirements are real enough to matter.
Step 4: Compare monthly and annual views
Build two simple estimates:
- Current-state monthly cost
- Expected 12-month cost after growth
That helps reveal whether a low-cost starting point will likely trigger a fast upgrade.
Questions to ask before choosing a plan
Do all users need to create content, or do some only need to view it?
This is the first budgeting question. Teams often over-license because they do not distinguish between authors and consumers.
Will reports be shared internally, externally, or embedded in an application?
Deployment model changes cost structure. Internal collaboration is one thing; customer-facing analytics is another.
Are premium-only features truly required now, or only later?
Many teams overbuy advanced licenses too early. Others underbuy and then hit limits fast. The right answer is usually to map today's critical needs and test likely growth.
Common mistakes teams make when comparing plans
Confusing feature access with sharing rights
One of the biggest Power BI pricing mistakes is assuming that because a creator can publish a report, everyone can automatically access it under the same plan.
In reality, who can view a report depends on both the publisher’s license and the workspace or capacity setup. This is why licensing discussions can become confusing for non-admin teams.
A better approach is to diagram:
- Who builds content
- Where it is published
- Who must access it
- Under what workspace or capacity model
Ignoring future growth and governance needs
A plan may work for today’s 20 users, but what happens when:
- Usage triples
- More business units join
- Dashboards become operationally critical
- Security and governance standards tighten
Refresh limits, workspace administration, performance management, and access governance can become important long before a team reaches enterprise scale.
Focusing only on list price
List price is visible. Support effort is not.
The real cost of a BI rollout may also include:
- Admin overhead
- Rework after choosing the wrong plan
- Migration effort when outgrowing the first setup
- Report redesign for performance
- Governance cleanup after uncontrolled expansion
That is why procurement should compare total cost of ownership, not just subscription cost.
Choosing the right Power BI pricing path for your team
To recap, here is the simplest framework:
- Free fits individual learning and early prototyping
- Pro fits small teams with standard internal collaboration
- Premium Per User fits teams that need advanced features without full capacity
- Capacity-based options fit broader organizational scale, larger audiences, and more complex deployment needs
The best decision depends on usage patterns, not on forum opinions or general market popularity.
A practical evaluation method is:
- Start with your current team structure
- Test likely growth over the next 12 months
- Compare total monthly cost under each model
- Factor in performance, governance, and support complexity
- Choose the setup that remains workable as usage expands
Practical recommendations before you commit
Here are five steps I recommend as a BI consultant before approving any Power BI licensing plan:
- Separate creators from consumers early. This single step prevents most budgeting mistakes.
- Map your sharing model before comparing plans. Internal, external, and embedded use cases behave differently.
- Validate whether premium features are truly required. Do not upgrade because of vague future possibilities.
- Estimate a 12-month growth scenario, not just a month-one scenario. Your cheapest starting point may not stay cheap.
- Review governance and admin implications alongside price. A lower subscription cost can still create a higher operating burden.
Teams comparing Power BI cost may also want to evaluate FineBI + Dora
Tools like Power BI are widely used in the BI market, but teams that need a more business-user-friendly, self-service BI platform may also consider FineBI.
FineBI is designed around self-service analytics, interactive dashboard creation, and drag-and-drop exploration for business teams. That can be relevant if your organization is not only comparing license cost, but also asking broader questions such as:
- How quickly can business users build dashboards?
- How much dependence will teams have on technical specialists?
- How easy is it to iterate on metrics and dashboards?
- How well can the BI environment scale across departments?
Where FineBI is often relevant:
- Business teams that need to build and adjust dashboards faster
- Organizations standardizing self-service BI across departments
- Teams that want interactive analysis, drill-down, and dashboard sharing in a governed environment
- Enterprises looking beyond static dashboard consumption toward more active data use
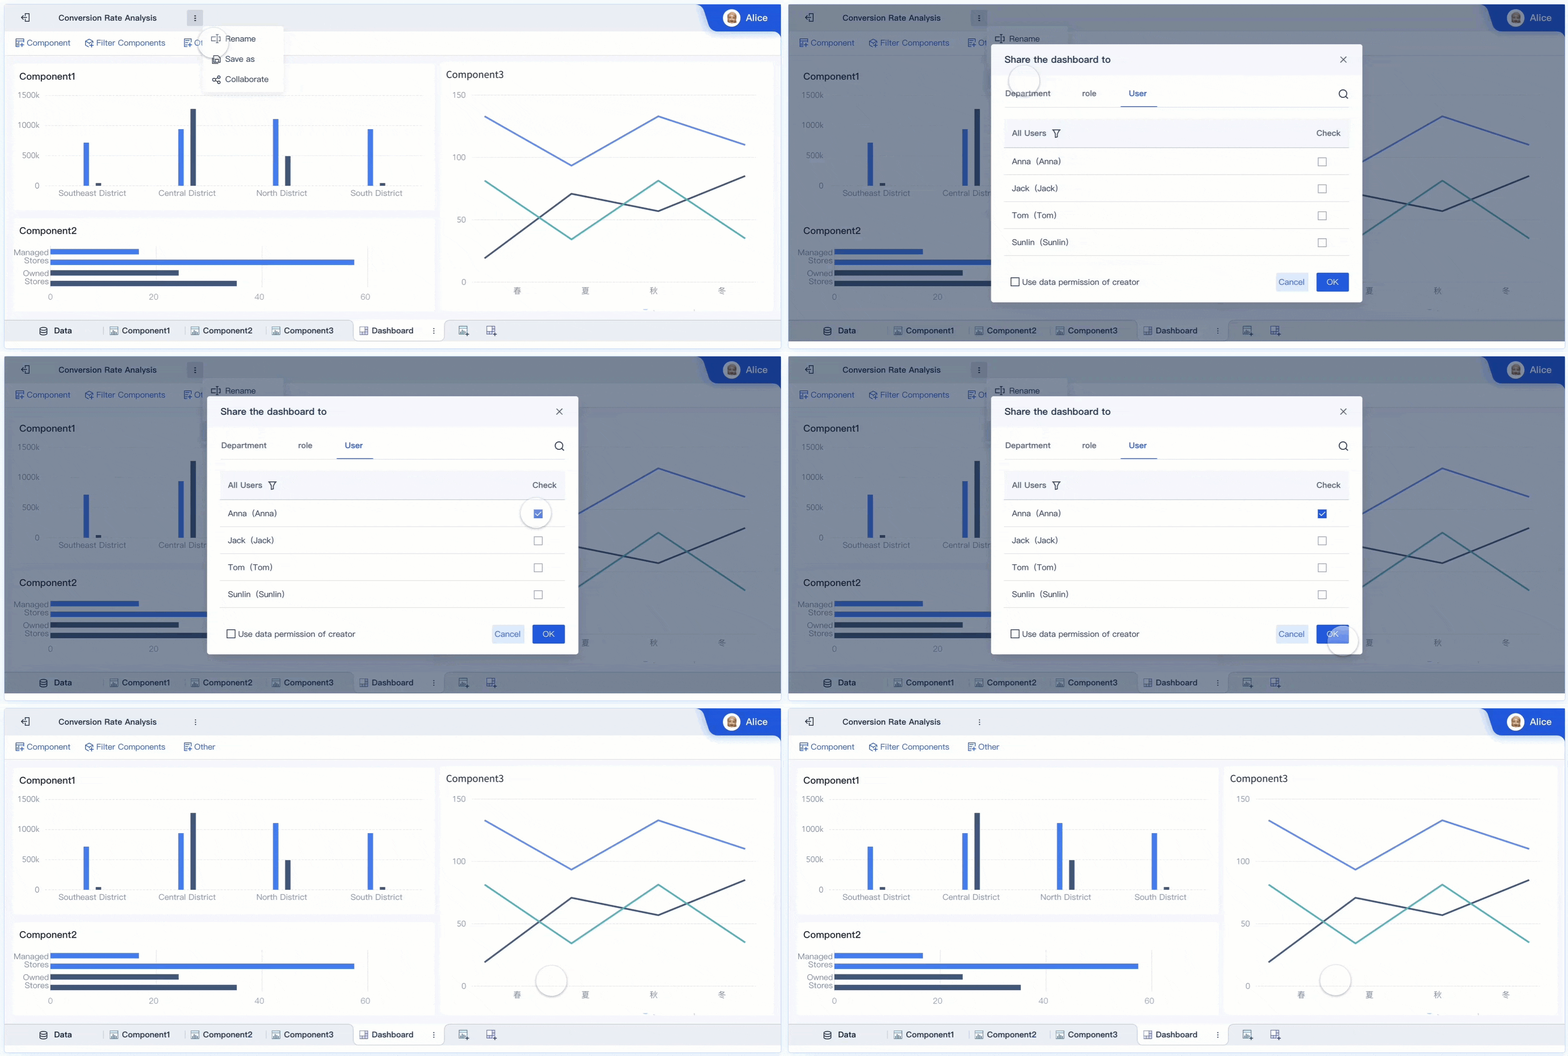 Sharing and Collaboration
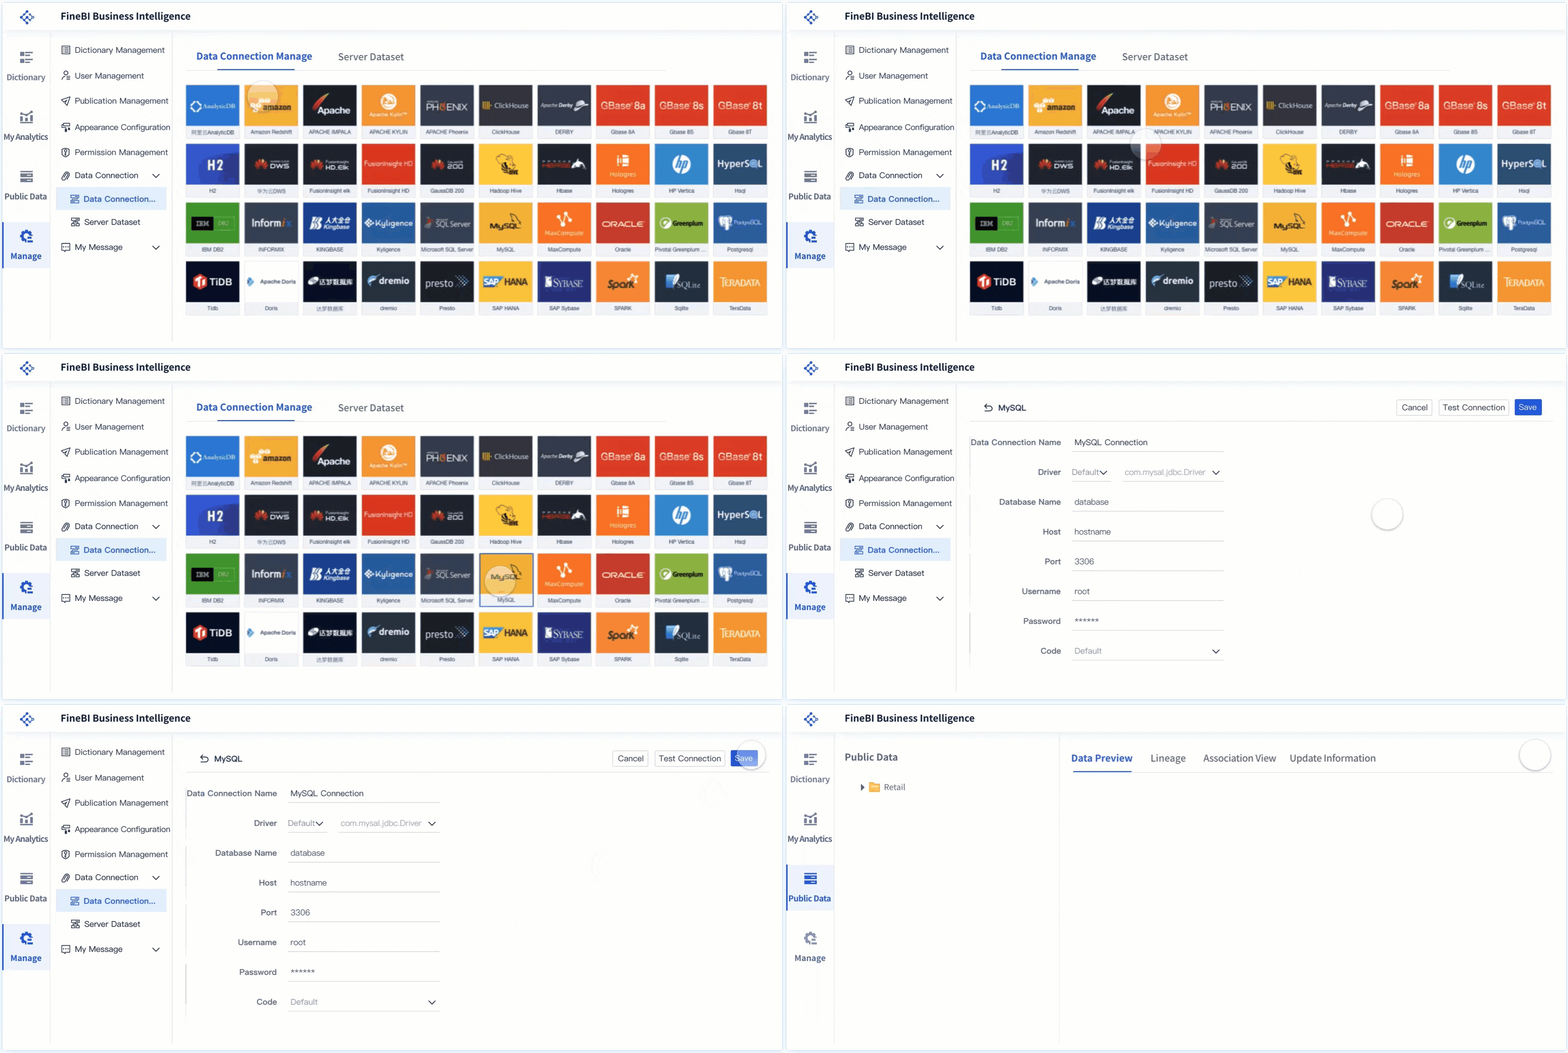 FineBI's Data Connectivity
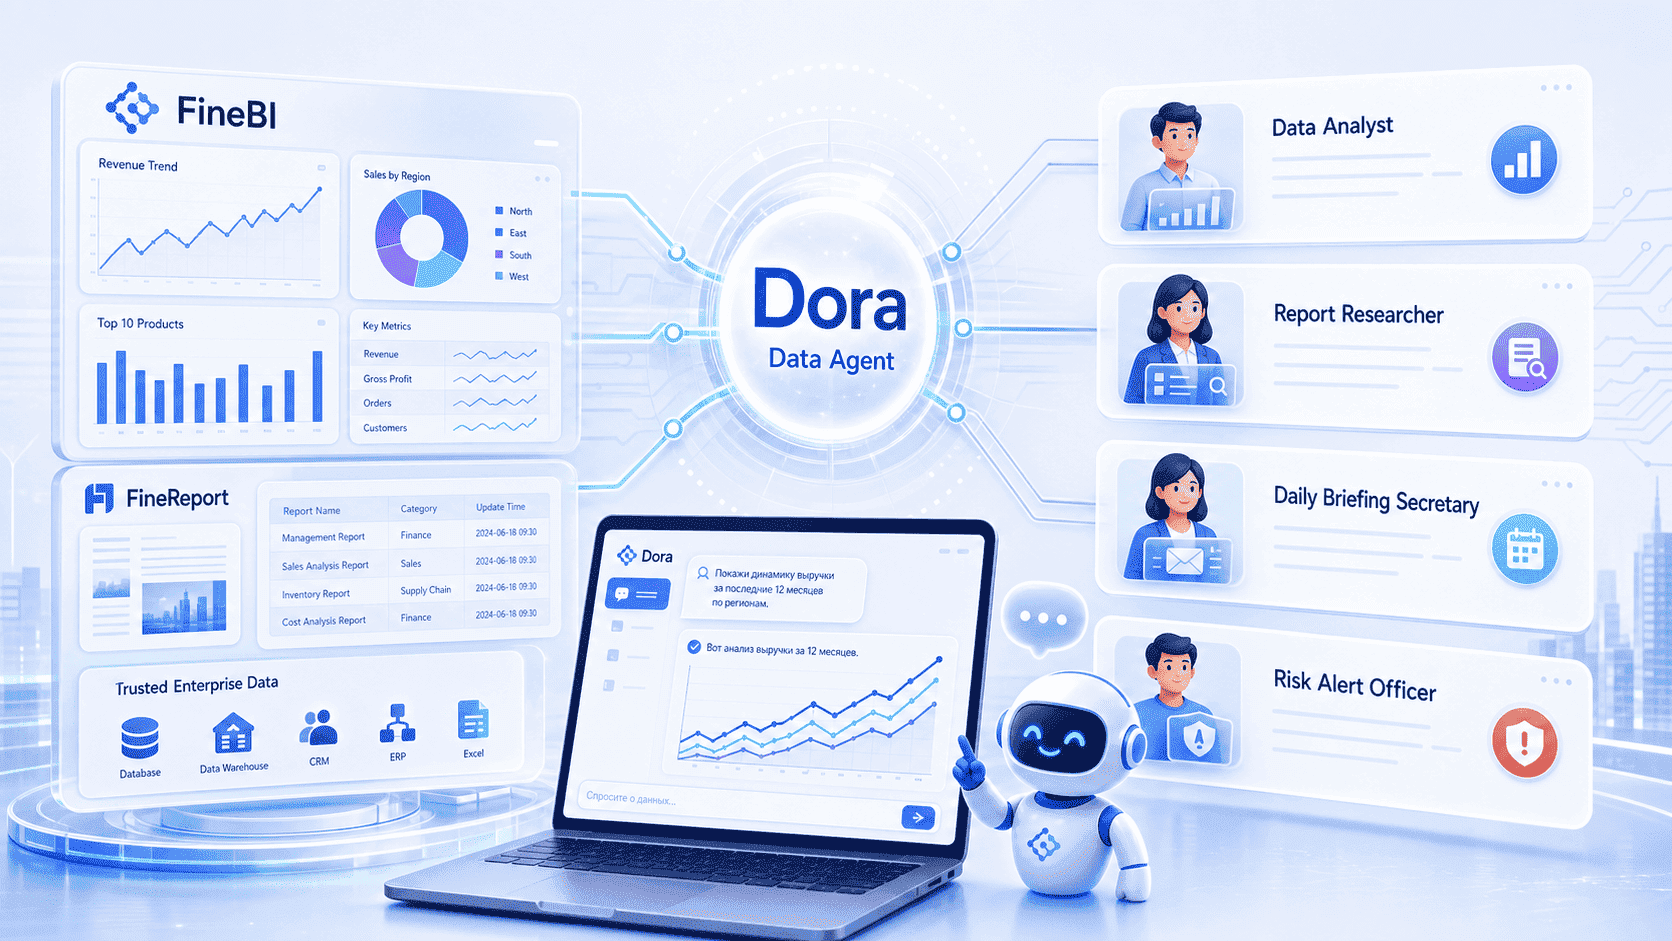
Dora adds another layer to that strategy. Dora is FanRuan’s enterprise Data Agent platform. It works as an AI assistant and AI digital employee layer on top of FineBI and existing trusted enterprise data assets.
Together, FineBI + Dora help organizations move from simply viewing dashboards to enabling a more Agentic BI workflow:
- natural-language requests
- trusted semantic understanding
- governed query or skill execution
- answers, charts, summaries, actions, and follow-up
That matters for teams that want not only dashboards, but also scenario-based AI support such as:
- Data Analyst digital employee
- Report Researcher
- Daily Briefing Secretary
- Risk Alert Officer

The practical positioning is simple:
- FineBI builds the trusted dashboard, metric, and semantic foundation
- Dora turns that foundation into a governed, scenario-specific AI assistant
Dora can also be considered when an enterprise already has trusted BI or data assets and wants an AI layer for governed data interaction. It should not be viewed as a replacement for FineBI, but as a way to make enterprise analytics more interactive and action-oriented.
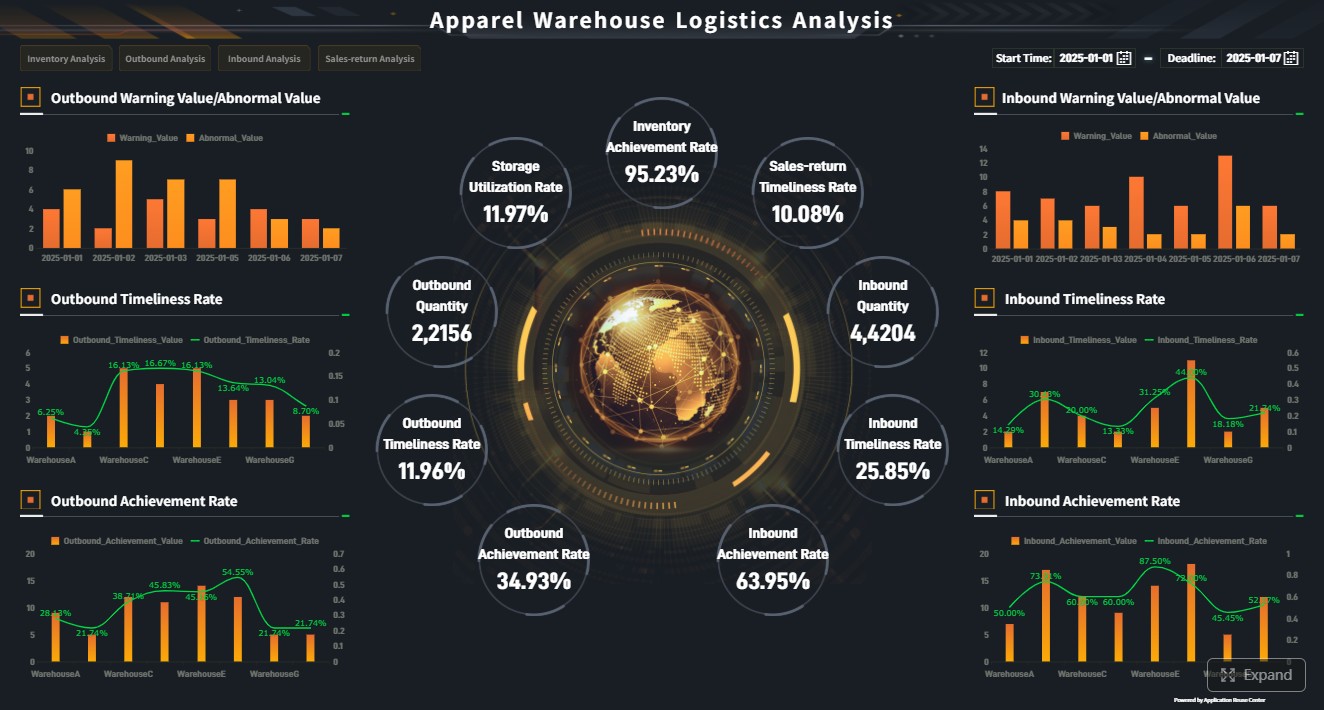

Get Ready-to-Use Dashboard Templates in Fine Gallery
Final thoughts on power bi license cost
If you are choosing a Power BI plan for a team, the smartest move is to stop treating pricing as a simple per-user question.
Instead, evaluate:
- who creates
- who consumes
- how sharing works
- what premium features are genuinely required
- how quickly the team will grow
That approach gives you a much more accurate view of power bi license cost than list pricing alone.
And if your team is also evaluating ease of adoption, self-service BI, dashboard scalability, and future AI-driven analytics workflows, it is worth looking at FineBI + Dora alongside traditional licensing comparisons.
FAQs
Team cost depends on how many people build reports, how many only view them, and whether you use per-user licenses or capacity. A small team may only need Pro licenses, while larger viewing audiences can make Fabric capacity more cost-effective.