An effective ESG reporting technology stack is not just a collection of software tools. It is the operating backbone that turns fragmented data from finance, HR, operations, procurement, energy systems, and suppliers into disclosure-ready information that can stand up to executive review, auditor scrutiny, and regulatory deadlines. For sustainability leaders, finance teams, compliance managers, and IT directors, the real challenge is not collecting a few ESG metrics. It is building a reliable data pipeline that is consistent, traceable, scalable, and defensible across frameworks like CSRD, GRI, and SEC climate disclosure.
Click To Try The Dashboard
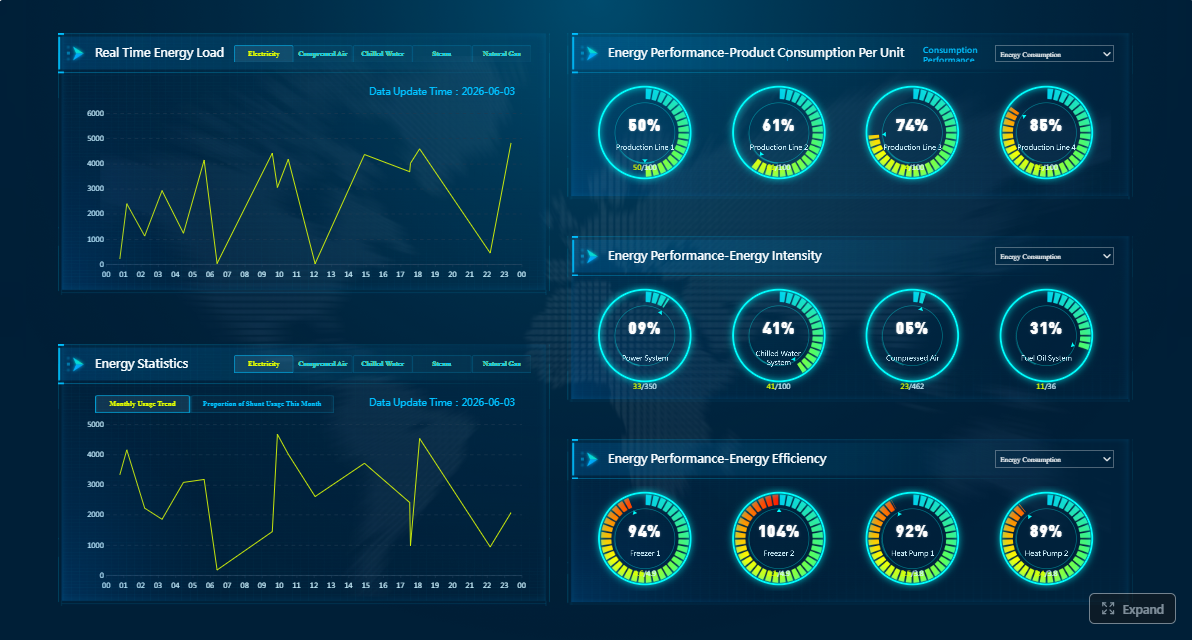
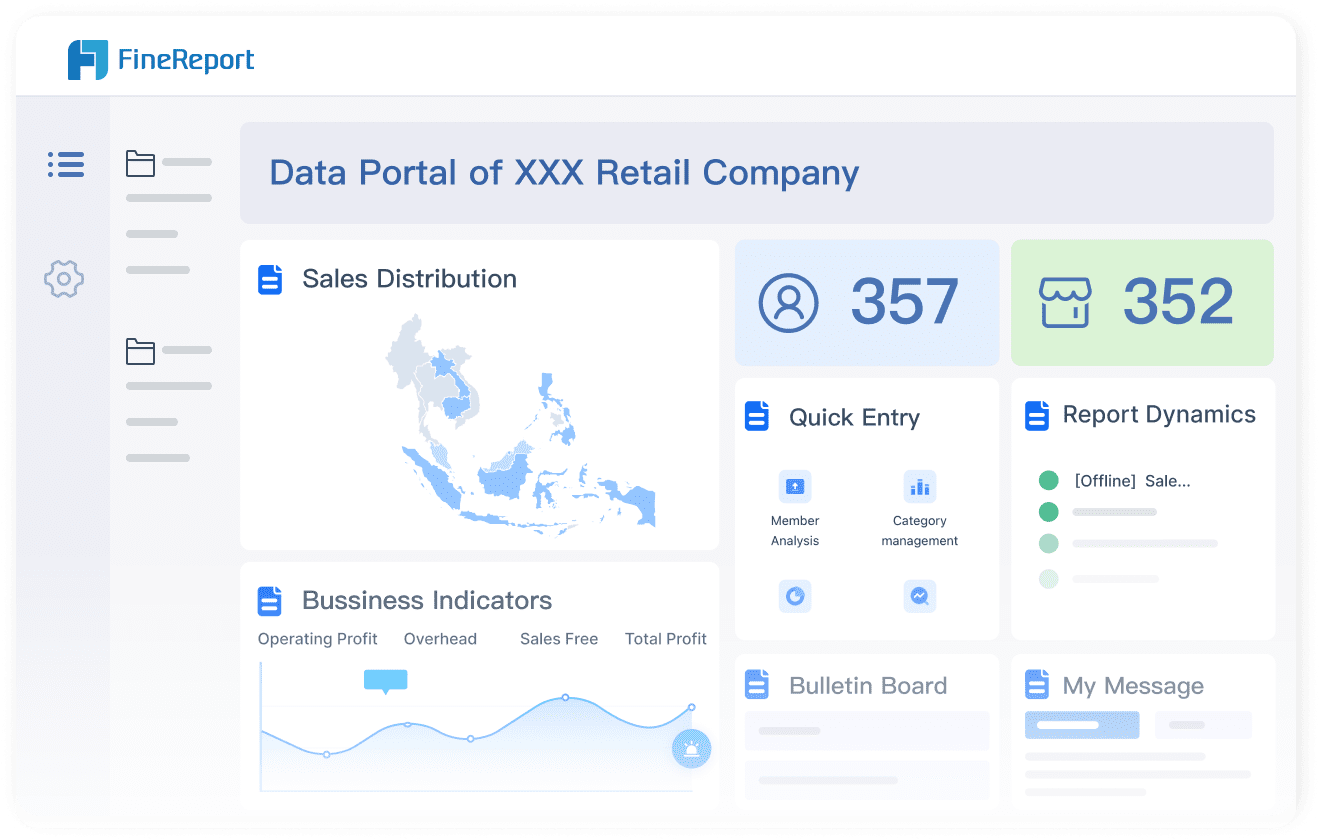
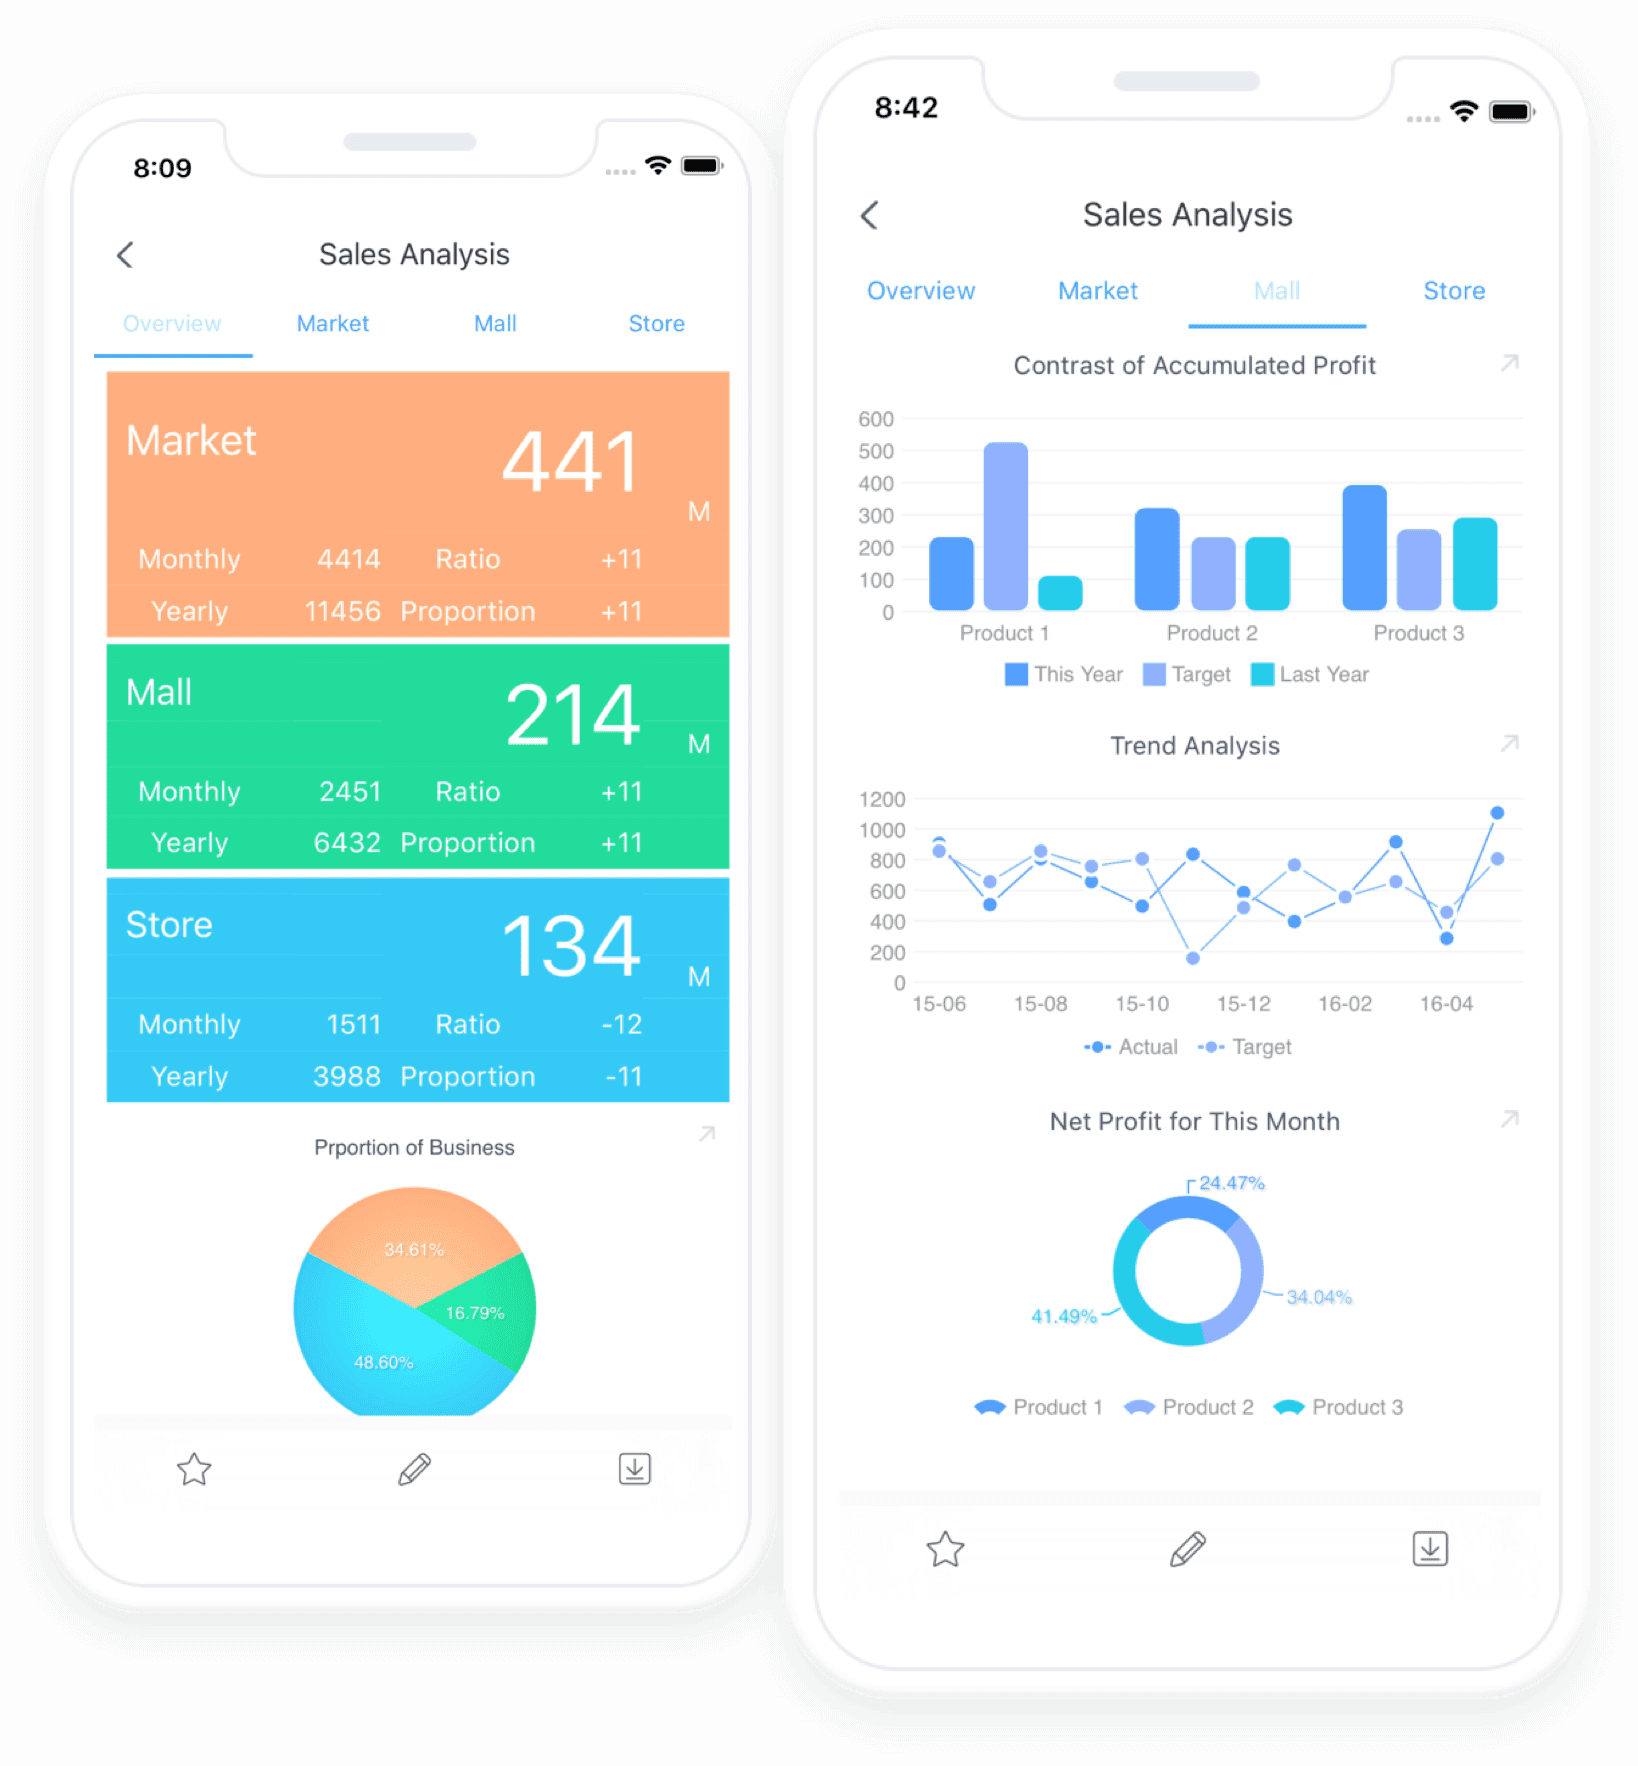
All reports in this article are built with FineReport
What an ESG Reporting Technology Stack Needs to Do
An ESG reporting technology stack must connect raw operational activity to structured disclosure outputs. In practice, that means pulling data from many systems, transforming it into standardized metrics, applying controls, storing evidence, and presenting final numbers in a form that satisfies both internal stakeholders and external reporting obligations.
Organizations often underestimate the leap between raw ESG data collection and actual disclosure readiness. A utility invoice, supplier spreadsheet, HR file, or travel export may contain relevant inputs, but those records are rarely aligned by boundary, unit of measure, time period, ownership structure, or reporting methodology. Without a robust pipeline, reporting becomes manual, error-prone, and impossible to audit at scale.
CSRD, GRI, and SEC climate disclosure also create different requirements that the technology stack must support:
CSRD demands broader structure, governance, traceability, and assurance readiness across a wide set of sustainability topics.
GRI emphasizes stakeholder-relevant disclosures and topic-specific reporting that often spans qualitative and quantitative evidence.
SEC climate disclosure focuses heavily on material climate-related risks, governance, and emissions-related disclosures tied to investor-grade consistency.
That is why an ESG stack must do more than aggregate numbers. It must support controls, documentation, review workflows, and auditability from end to end.
Key Metrics (KPIs) an ESG Reporting Pipeline Must Support
Below are the core KPI categories most enterprises need to operationalize within their ESG reporting technology environment:
Scope 1 emissions: Direct emissions from owned or controlled sources.
Scope 2 emissions: Indirect emissions from purchased electricity, steam, heating, or cooling.
Scope 3 emissions: Upstream and downstream value chain emissions, often the most data-intensive category.
Energy consumption: Total energy use by source, facility, business unit, or geography.
Renewable energy share: Percentage of energy sourced from renewables or covered by energy attribute certificates.
Water withdrawal and discharge: Operational water usage and related discharge indicators.
Waste generated and diverted: Waste volumes, treatment methods, and recycling or recovery rates.
Workforce headcount and diversity: Employee demographics, representation metrics, and labor-related indicators.
Health and safety incidents: Lost-time injuries, recordable incidents, and safety performance trends.
Supplier ESG coverage: Share of spend or suppliers covered by sustainability screening, assessment, or code compliance.
Control completion rate: Percentage of required reviews, approvals, and evidence submissions completed on time.
Data quality exception rate: Number or percentage of records failing validation rules or reconciliation checks.
Audit trail completeness: Degree to which reported figures can be traced back to source records and methodologies.
Reporting cycle time: Time required to collect, validate, approve, and publish disclosures.
A mature ESG reporting stack should calculate, validate, and monitor these KPIs continuously rather than rebuild them manually each reporting season.
Core Layers of a Reliable ESG Data Pipeline
A reliable ESG data pipeline works like a layered architecture. Each layer solves a different problem: data capture, standardization, validation, governance, and disclosure output.
Source systems and data inputs
The first layer is the source landscape. ESG data is distributed across internal and external systems, and no single application usually contains everything needed for reporting.
Common source systems include:
ERP systems for procurement, finance, inventory, and cost allocation
HR systems for headcount, diversity, training, and workforce indicators
Energy management platforms for electricity, gas, fuel, and meter data
Travel and expense tools for business travel emissions
Procurement and supplier platforms for supplier attributes and upstream activity data
EHS systems for incident, waste, water, and compliance records
Facility management systems for building-level operational performance
External data providers for emissions factors, country grids, benchmarks, or climate risk inputs
ESG data also comes in both structured and unstructured forms. Structured inputs include database exports, API feeds, CSV files, and system reports. Unstructured inputs include invoices, utility bills, contracts, PDFs, emails, and spreadsheets maintained outside official enterprise platforms.
The practical task here is to map each disclosure requirement to the systems, files, and owners that produce the supporting data. This source mapping exercise is one of the most important early steps in building a durable ESG reporting technology stack.
Data integration and transformation
Once source data is identified, it must be standardized and transformed. This is where many ESG reporting initiatives either mature into a scalable process or collapse into spreadsheet chaos.
Raw activity data rarely aligns out of the box. Common issues include:
Different units of measure across sites and vendors
Inconsistent entity names or organizational hierarchies
Misaligned fiscal and calendar reporting periods
Varying treatment of leased assets, joint ventures, and acquisitions
Multiple versions of emissions factors or calculation logic
Duplicate records and missing metadata
A strong integration and transformation layer should standardize:
Units such as kWh, MWh, gallons, liters, metric tons, and currency
Organizational boundaries across subsidiaries, facilities, and operational control definitions
Time periods across monthly, quarterly, and annual reporting cycles
Calculation rules so the same activity produces the same metric every time
Taxonomies and tags to support reporting by framework, entity, geography, and topic
This layer should be repeatable. If a team has to rework formulas every quarter, the pipeline is not truly operationalized. Sustainable ESG reporting depends on stable transformation logic that converts source activity into disclosure-ready metrics with minimal manual intervention.
Controls, validation, and audit trail
The final layer is what separates a basic reporting setup from an enterprise-grade ESG reporting technology environment: controls and auditability.
Each reported data point should be supported by a clear chain of accountability, validation logic, and retained evidence. That means building mechanisms for:
Approval workflows by data owner, reviewer, and approver
Version control to track changes in values, logic, and submissions
Exception handling for missing, abnormal, or late data
Evidence storage such as invoices, meter statements, contracts, and methodology notes
Lineage tracking from disclosure output back to source record and calculation step
This is especially important when preparing for assurance. If a reviewer cannot trace a final number back to the original record and understand the methodology used, the reporting process is fragile by definition.
How to Design the Pipeline for CSRD, GRI, and SEC Climate Disclosure
A strong architecture starts with reporting requirements, not software selection. The smartest teams define what must be reported, what evidence is needed, and what control environment is expected before they choose tools.
Start with reporting requirements and material topics
Begin by translating each applicable framework requirement into operational data requirements. For every metric or disclosure, define:
The exact data field
The business owner
The submission frequency
The source system or document
The review and approval path
The required evidence
The retention requirement
The assurance expectation
This framework-first approach helps prevent one of the most common mistakes in ESG reporting technology projects: implementing tools without a clearly defined reporting model.
Materiality also matters. Not every metric needs the same level of automation on day one. High-priority metrics should be selected based on:
For most enterprises, emissions, energy, workforce, governance, and supplier-related metrics rise to the top first.
Align metrics, calculation methods, and taxonomy
The next step is to build a common data model that supports overlap across frameworks while preserving framework-specific outputs.
This is critical because CSRD, GRI, and SEC climate disclosure often draw from similar operational inputs but package them differently. A common model reduces duplication and improves consistency. At the same time, framework-specific reporting logic must still be preserved where definitions diverge.
Key design principles include:
Define a single master record for each core data element
Maintain controlled calculation methodologies for each metric
Use a taxonomy layer that maps one metric to multiple disclosure frameworks where appropriate
Separate raw activity data, calculated KPI outputs, and published disclosure values
Tag data by entity, geography, period, framework, material topic, and assurance status
Examples of methodology areas that need formal definition:
Emissions calculations by source and factor set
Energy intensity and normalization rules
Workforce segmentation and inclusion criteria
Governance metrics and committee oversight definitions
This is where discipline matters. If two business units use different assumptions for the same KPI, your technology stack will only scale inconsistency faster.
Build for evidence, assurance, and change management
Enterprise ESG reporting is no longer a best-effort exercise. It increasingly operates under assurance expectations, evolving regulations, and organizational change. Your pipeline must be designed with that reality in mind.
That means embedding:
Evidence requirements for every material metric
Control points for review and sign-off
Assumption logs for estimates and gaps
Methodology documents with change history
Entity-change processes for mergers, acquisitions, divestitures, and reorganizations
Regulation update workflows to adjust logic when reporting rules evolve
A resilient ESG reporting technology stack should not break every time the business structure changes or a new requirement appears. It should support controlled updates with transparency around what changed, why it changed, and what outputs were affected.
Choosing the Right Technology Components
The right architecture is rarely one tool. In most organizations, the best ESG reporting technology stack is a combination of enterprise systems, data integration tools, workflow controls, analytics, and reporting applications.
When to use ERP, ESG software, data warehouse, and workflow tools
Each technology component serves a different purpose. The key is knowing where each function should live.
ERP systems are strong for financial, procurement, and operational master data, but they are rarely sufficient for end-to-end ESG disclosure management on their own.
Specialized ESG software can support framework mapping, emissions calculations, surveys, and disclosure workflows, but may still need integration with enterprise architecture.
Data warehouses or lakehouses are ideal for consolidating large volumes of ESG-related source data and supporting reusable transformation logic.
BI and dashboard tools are best for executive visibility, operational monitoring, exception management, and reporting consumption.
Workflow and document management tools are essential for approvals, evidence retention, and policy-controlled collaboration.
The right design question is not which tool is best overall. It is which tool should own each function:
Where should master data live?
Where should calculation logic be maintained?
Where should approvals happen?
Where should evidence be stored?
Where should disclosure-ready reporting be generated?
Integration, scalability, and governance criteria
When evaluating tools, decision-makers should focus on operational fit, not just feature lists.
The most important criteria include:
API support for pulling and pushing data across enterprise systems
Interoperability with ERP, HR, procurement, utility, and document repositories
Scalability across entities, geographies, currencies, and reporting frameworks
Security controls for sensitive workforce, supplier, and governance data
Role-based permissions for contributors, reviewers, auditors, and executives
Global entity support for complex legal and organizational structures
Audit logging for every data change, approval, and methodology update
Performance for recurring reporting cycles and large-volume transformations
A pilot that works for one country or one emissions category is not enough. The stack must be able to scale to enterprise-wide reporting without multiplying manual effort.
Build, buy, or hybrid approach
There is no universal answer here. The right path depends on internal capabilities, urgency, reporting complexity, and operating model.
Build works when internal data teams are strong and the organization needs deep customization, but it usually increases maintenance burden.
Buy accelerates implementation and can improve standardization, but may introduce limitations in flexibility or integration.
Hybrid is often the best option for large enterprises: keep source data and core integrations in enterprise architecture, while using specialized tools for workflow, templates, and reporting delivery.
The governance model matters as much as the technology model. Sustainability teams should not own everything manually, and IT teams should not define methodology in isolation. Successful programs share responsibilities across:
Sustainability and ESG leaders
Finance and controllership
IT and enterprise architecture
Data engineering and analytics
Legal, risk, and compliance
Internal audit or assurance stakeholders
Implementation Roadmap and Common Pitfalls
Building a reliable ESG data pipeline should be phased. Trying to automate every disclosure, every entity, and every framework at once usually delays value and creates adoption problems.
A phased rollout plan
A practical rollout typically follows four stages:
Gap assessment and target design
Map current reporting processes, data sources, owners, controls, and pain points.
Define the target architecture, reporting scope, and minimum viable governance model.
Pilot priority disclosures
Start with the highest-risk or highest-value metrics, such as Scope 1, Scope 2, energy, and key workforce indicators.
Build standard calculations, workflows, and audit-trail requirements first.
Expand entity and metric coverage
Add more business units, facilities, suppliers, and framework outputs.
Increase automation and reduce spreadsheet-based handoffs.
Strengthen assurance readiness
Formalize evidence retention, exception management, reconciliation procedures, and methodology controls.
Stress-test the pipeline under reporting deadlines and audit review scenarios.
Better executive visibility into ESG performance and reporting status
Lower dependency on offline files and manual coordination
Greater resilience when regulations or organizational boundaries change
These outcomes create strategic value beyond compliance. Once the data pipeline is stable, the organization can use the same foundation for target tracking, risk management, supplier engagement, and operational sustainability improvement.
Best Practices for Implementing ESG Reporting Technology
If you want this to work in a real enterprise environment, treat ESG reporting like a controlled data program, not a side project. These best practices consistently separate scalable programs from reporting fire drills.
1. Design from disclosure backward
Start with the required disclosures, then map backward to source data, controls, and evidence. Do not begin with available data alone. A disclosure-first design makes gaps visible early and prevents expensive architecture mistakes.
2. Standardize methodology before automating
Automation multiplies whatever logic you put into the system. If methodologies are inconsistent, automation will simply scale confusion. Lock down units, factors, boundaries, calculation rules, and naming conventions before building workflows.
3. Assign clear ownership at every layer
Every metric needs a business owner, data provider, reviewer, and approver. Every exception needs an escalation path. This is not bureaucracy. It is what keeps reporting cycles predictable.
4. Build controls into the workflow, not around it
Do not rely on offline reviews, email approvals, or manual evidence folders. Embed validations, approval gates, and supporting documentation into the reporting process itself so the control environment operates by default.
5. Make auditability visible to management
Executives should not only see final ESG KPIs. They should also see submission status, exception counts, control completion, and audit readiness by entity and topic. That is how reporting risk gets managed proactively.
Building this manually is complex; use FineReport to utilize ready-made templates and automate this entire workflow.
For organizations building an enterprise-grade ESG reporting technology stack, FineReport can serve as the reporting, workflow, and dashboard layer that brings fragmented ESG data into a governed, decision-ready environment. Instead of stitching together disconnected spreadsheets and static reports, teams can create centralized dashboards, approval-driven workflows, evidence-linked reports, and executive views that support both operational management and disclosure preparation.
FineReport is especially valuable when you need to:
Consolidate ESG data from multiple systems into visual reporting views
Build reusable dashboards for emissions, energy, workforce, supplier, and compliance metrics
Monitor submission progress, exceptions, and audit readiness in real time
Standardize report templates across business units and geographies
Deliver controlled access for contributors, reviewers, executives, and assurance teams
Get Ready-to-Use Dashboard Templates in Fine Gallery
With the right architecture, ESG reporting becomes repeatable, auditable, and scalable. With the right reporting platform, it also becomes faster to deploy and easier to manage across the enterprise.
It is the set of systems and workflows that collect, standardize, validate, and report ESG data from multiple business sources. Its purpose is to turn raw operational records into disclosure-ready information for frameworks such as CSRD, GRI, and SEC climate disclosure.
These frameworks require consistent, traceable, and reviewable data rather than isolated spreadsheets or one-time calculations. A reliable pipeline helps reduce reporting errors, support assurance, and meet regulatory deadlines with defensible outputs.
Most organizations pull ESG data from ERP, HR, energy management, travel, procurement, EHS, and facility systems, along with supplier files and external emissions factor sources. Many pipelines also need to handle invoices, PDFs, and spreadsheets that sit outside core enterprise platforms.
A strong system should support emissions, energy, water, waste, workforce, safety, supplier coverage, and governance-related metrics such as control completion and data quality exceptions. It should also maintain audit trail completeness and track reporting cycle time.
They need clear data ownership, validation rules, evidence storage, approval workflows, and traceability from reported figures back to source records and methodologies. Standardizing calculations and documenting controls across the pipeline also improves assurance readiness.
Product Trial
FineReport
Pixel-perfect reports · Interactive dashboards · Easy data entry · Digital twins