##What HR Reporting and Analytics Should Deliver
HR reporting and analytics has moved far beyond static monthly dashboards. For years, HR teams have relied on spreadsheets, recurring reports, and slide decks to track headcount, turnover, engagement, and hiring performance. Those reports can show what happened, but they often fail to explain why it happened or what to do next.
Today, a better model is emerging: conversational, AI-powered HR analytics. Instead of waiting for a new dashboard or asking an analyst to build a custom report, HR leaders can ask questions in natural language and get immediate answers, charts, and follow-up suggestions based on governed business data. That shift turns HR reporting and analytics from a backward-looking activity into a decision-making workflow.
With FineBI + Dora, HR teams can move from manual reporting to AI-assisted insight delivery. Users can ask for analysis in chat, view trusted charts, and receive scheduled summaries before important meetings, so HR becomes a strategic partner instead of a reporting desk. For teams building HR reporting and analytics at scale, that shift is the difference between collecting numbers and creating action.
FineBI provides the dashboard, metric, and semantic layer needed for trusted HR analysis, while Dora adds an AI Data Agent experience on top of that foundation. Together, they help HR teams move from manual report preparation to governed, conversational analysis.
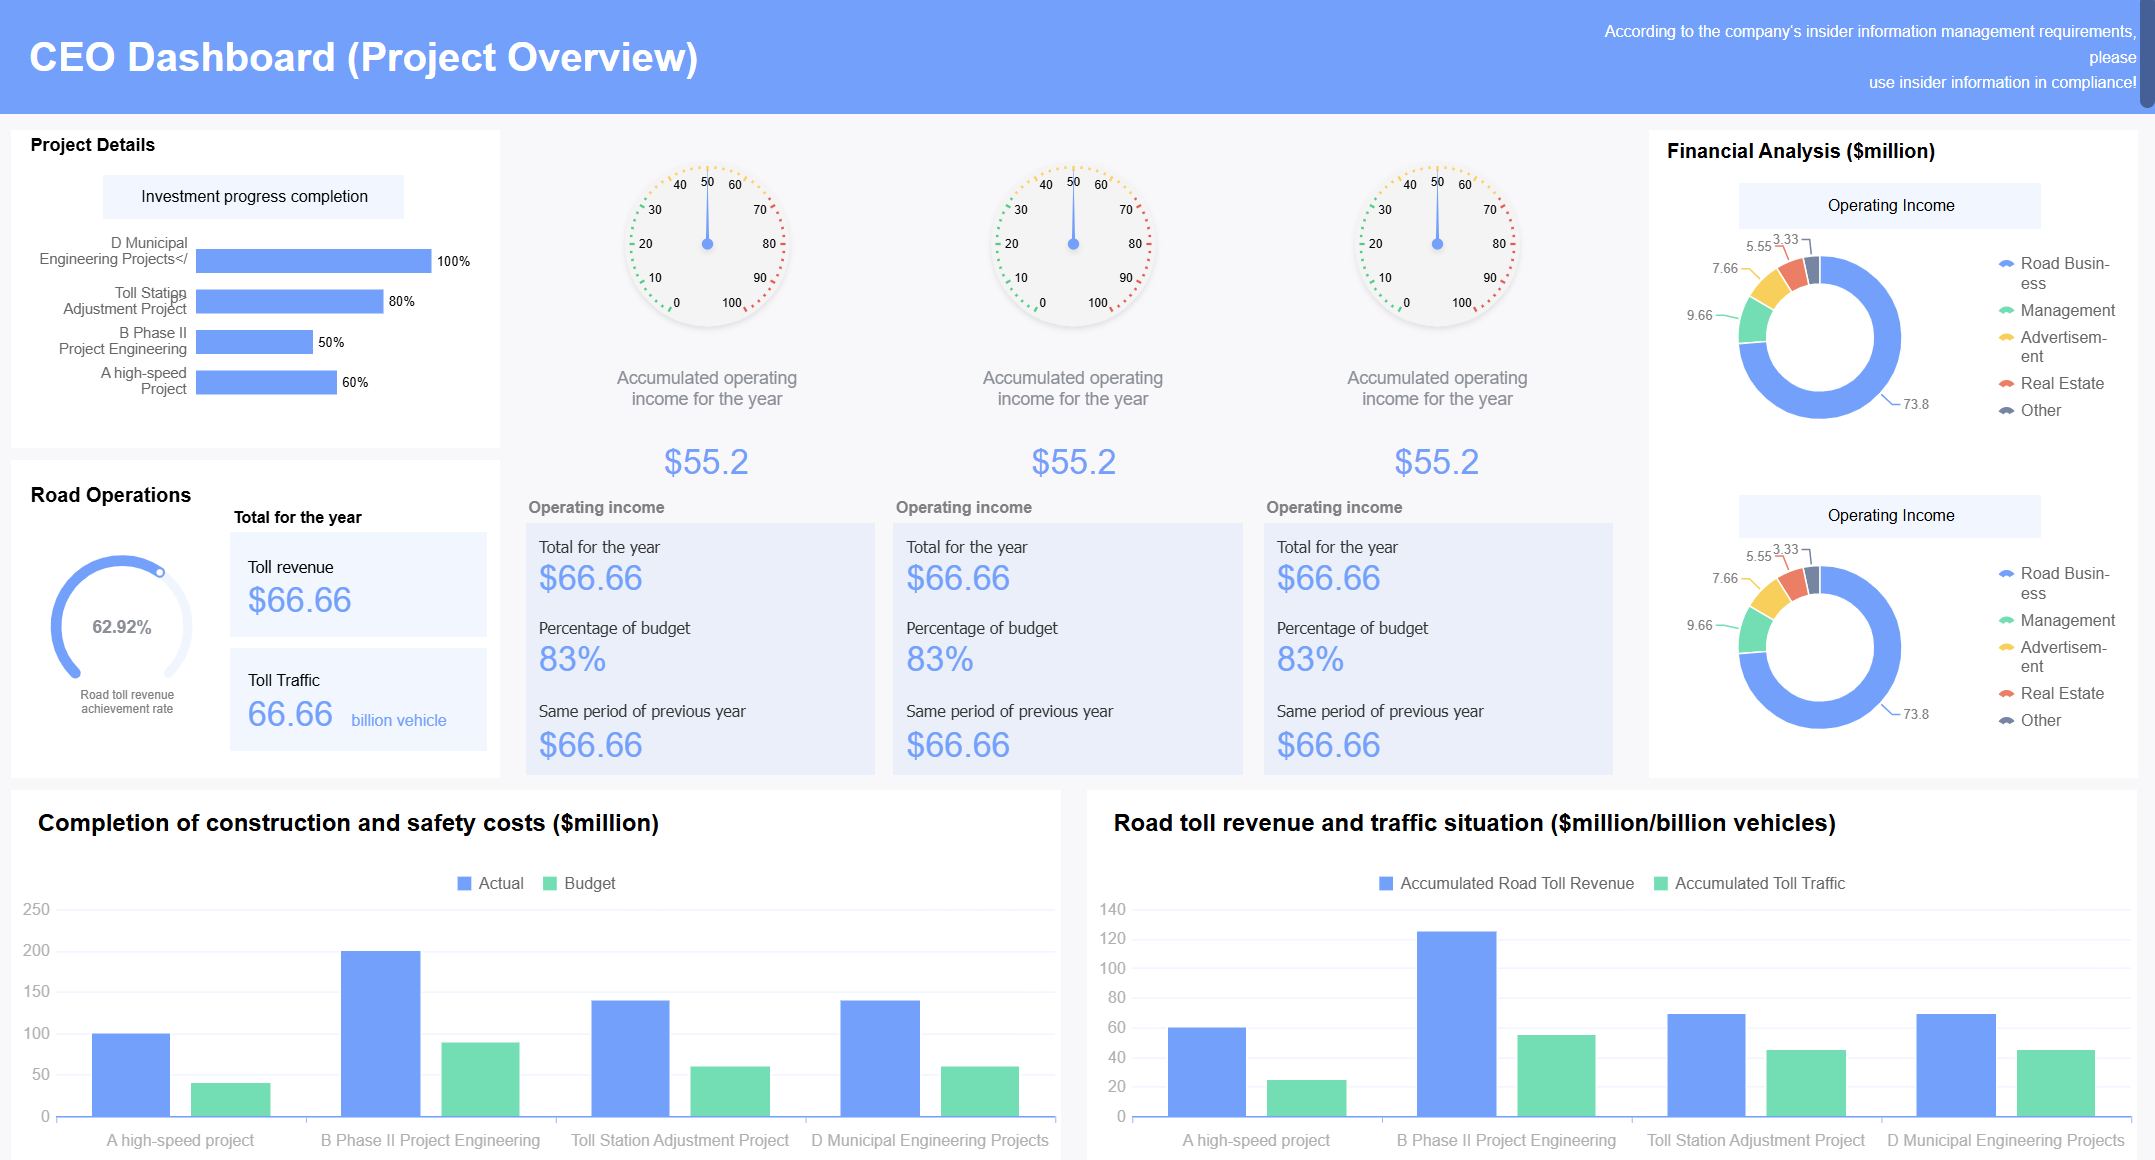
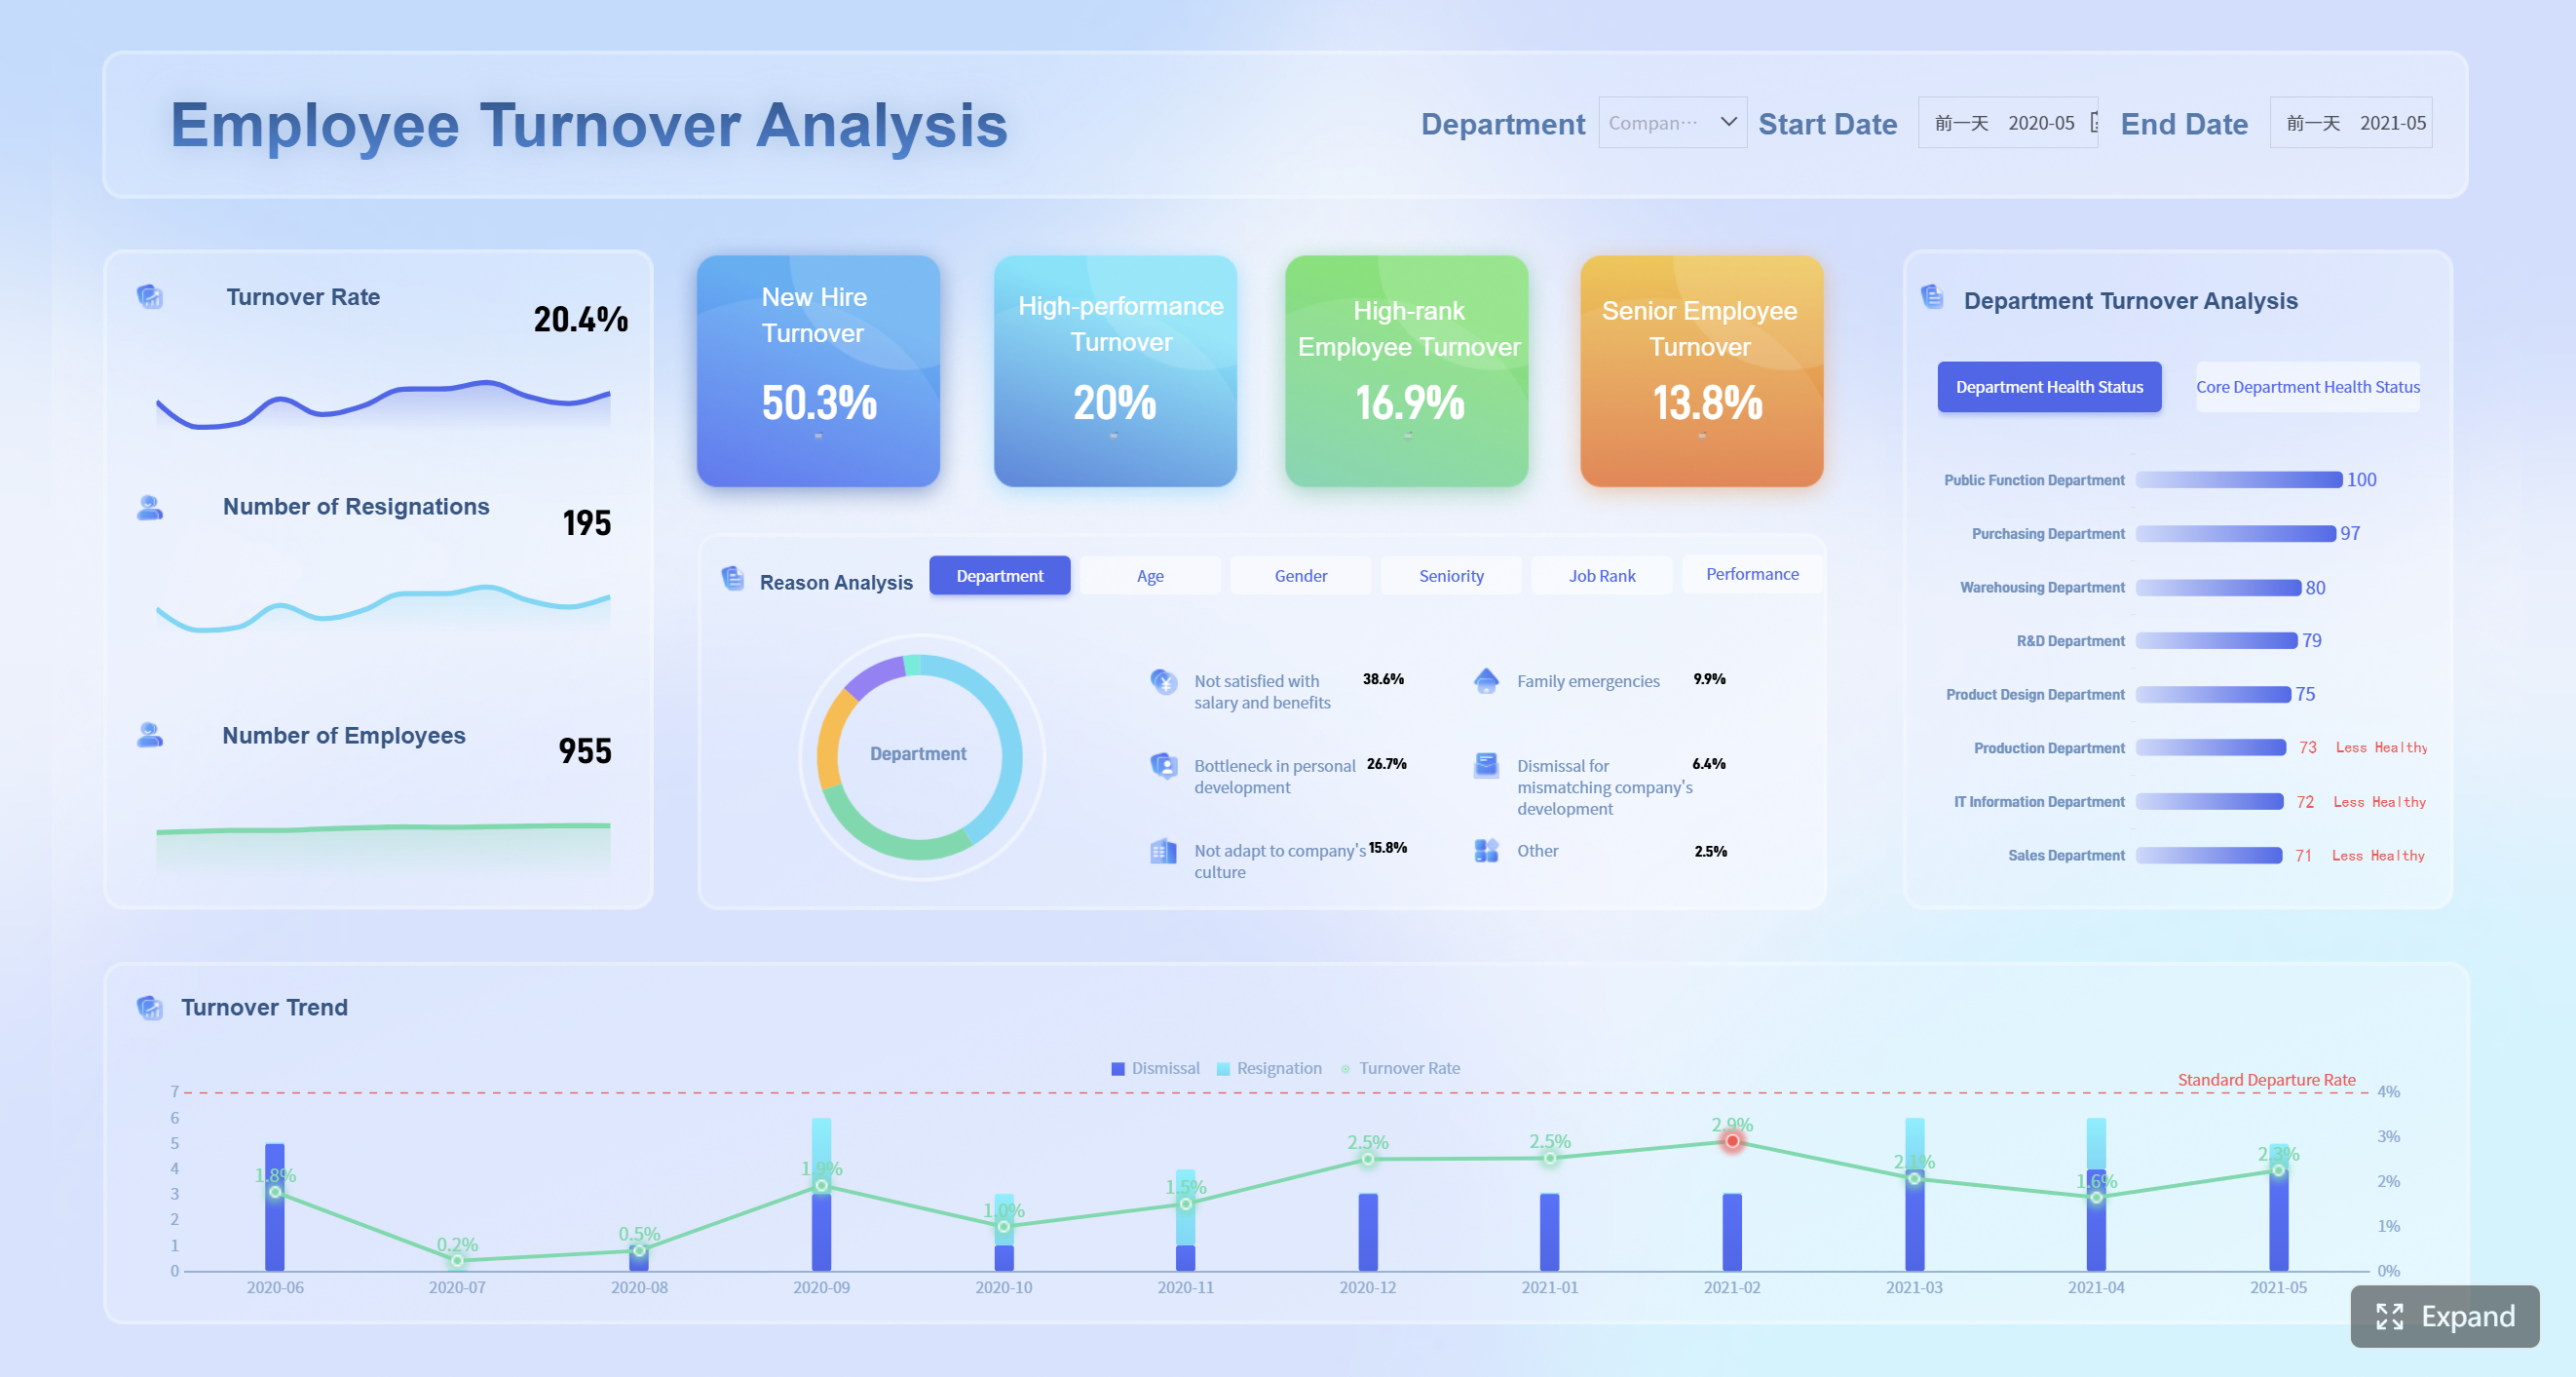 All dashboards and analysis examples in this article are built with FineReport
What a Good HR Reporting and Analytics Report Should Answer
A strong HR reporting and analytics process should help the business answer three questions:
- What is happening across the workforce?
- Why is it happening?
- What should we do next?
That means the report should do more than display KPIs. It should connect metrics to business context, show changes over time, and point leaders toward action. A good HR reporting and analytics report is not just descriptive. It is diagnostic and, ideally, predictive.
Why Traditional HR Reporting and Analytics Falls Short
It Is Reactive
Traditional reports are usually built after the month closes or after someone requests them. By the time leaders see the numbers, the situation may already have changed. In HR reporting and analytics, that delay makes it harder to spot attrition risk, hiring bottlenecks, or engagement drops in time.
It Is Inflexible
If a leader wants to compare turnover by team, tenure, and manager, someone usually has to rebuild the report or export the data manually. That slows decision-making and weakens the value of HR reporting and analytics.
It Lacks Narrative
Charts can show the trend, but they often do not explain the cause. A spike in attrition or a drop in engagement still needs interpretation, especially in HR reporting and analytics workflows that support leadership decisions.
It Buries Context
Without drill-downs, governed definitions, and linked supporting data, HR teams struggle to connect a metric to the real reason behind it. That is why HR reporting and analytics should always include context, comparison, and next-step guidance.
Core Metrics in HR Reporting and Analytics
The exact metrics depend on the business, but most HR reporting and analytics programs should cover:
- Headcount and workforce composition
- Turnover and retention
- Time-to-hire and hiring funnel conversion
- Employee engagement and sentiment
- Performance and promotion trends
- DEI and pay equity indicators
- Training and skills development
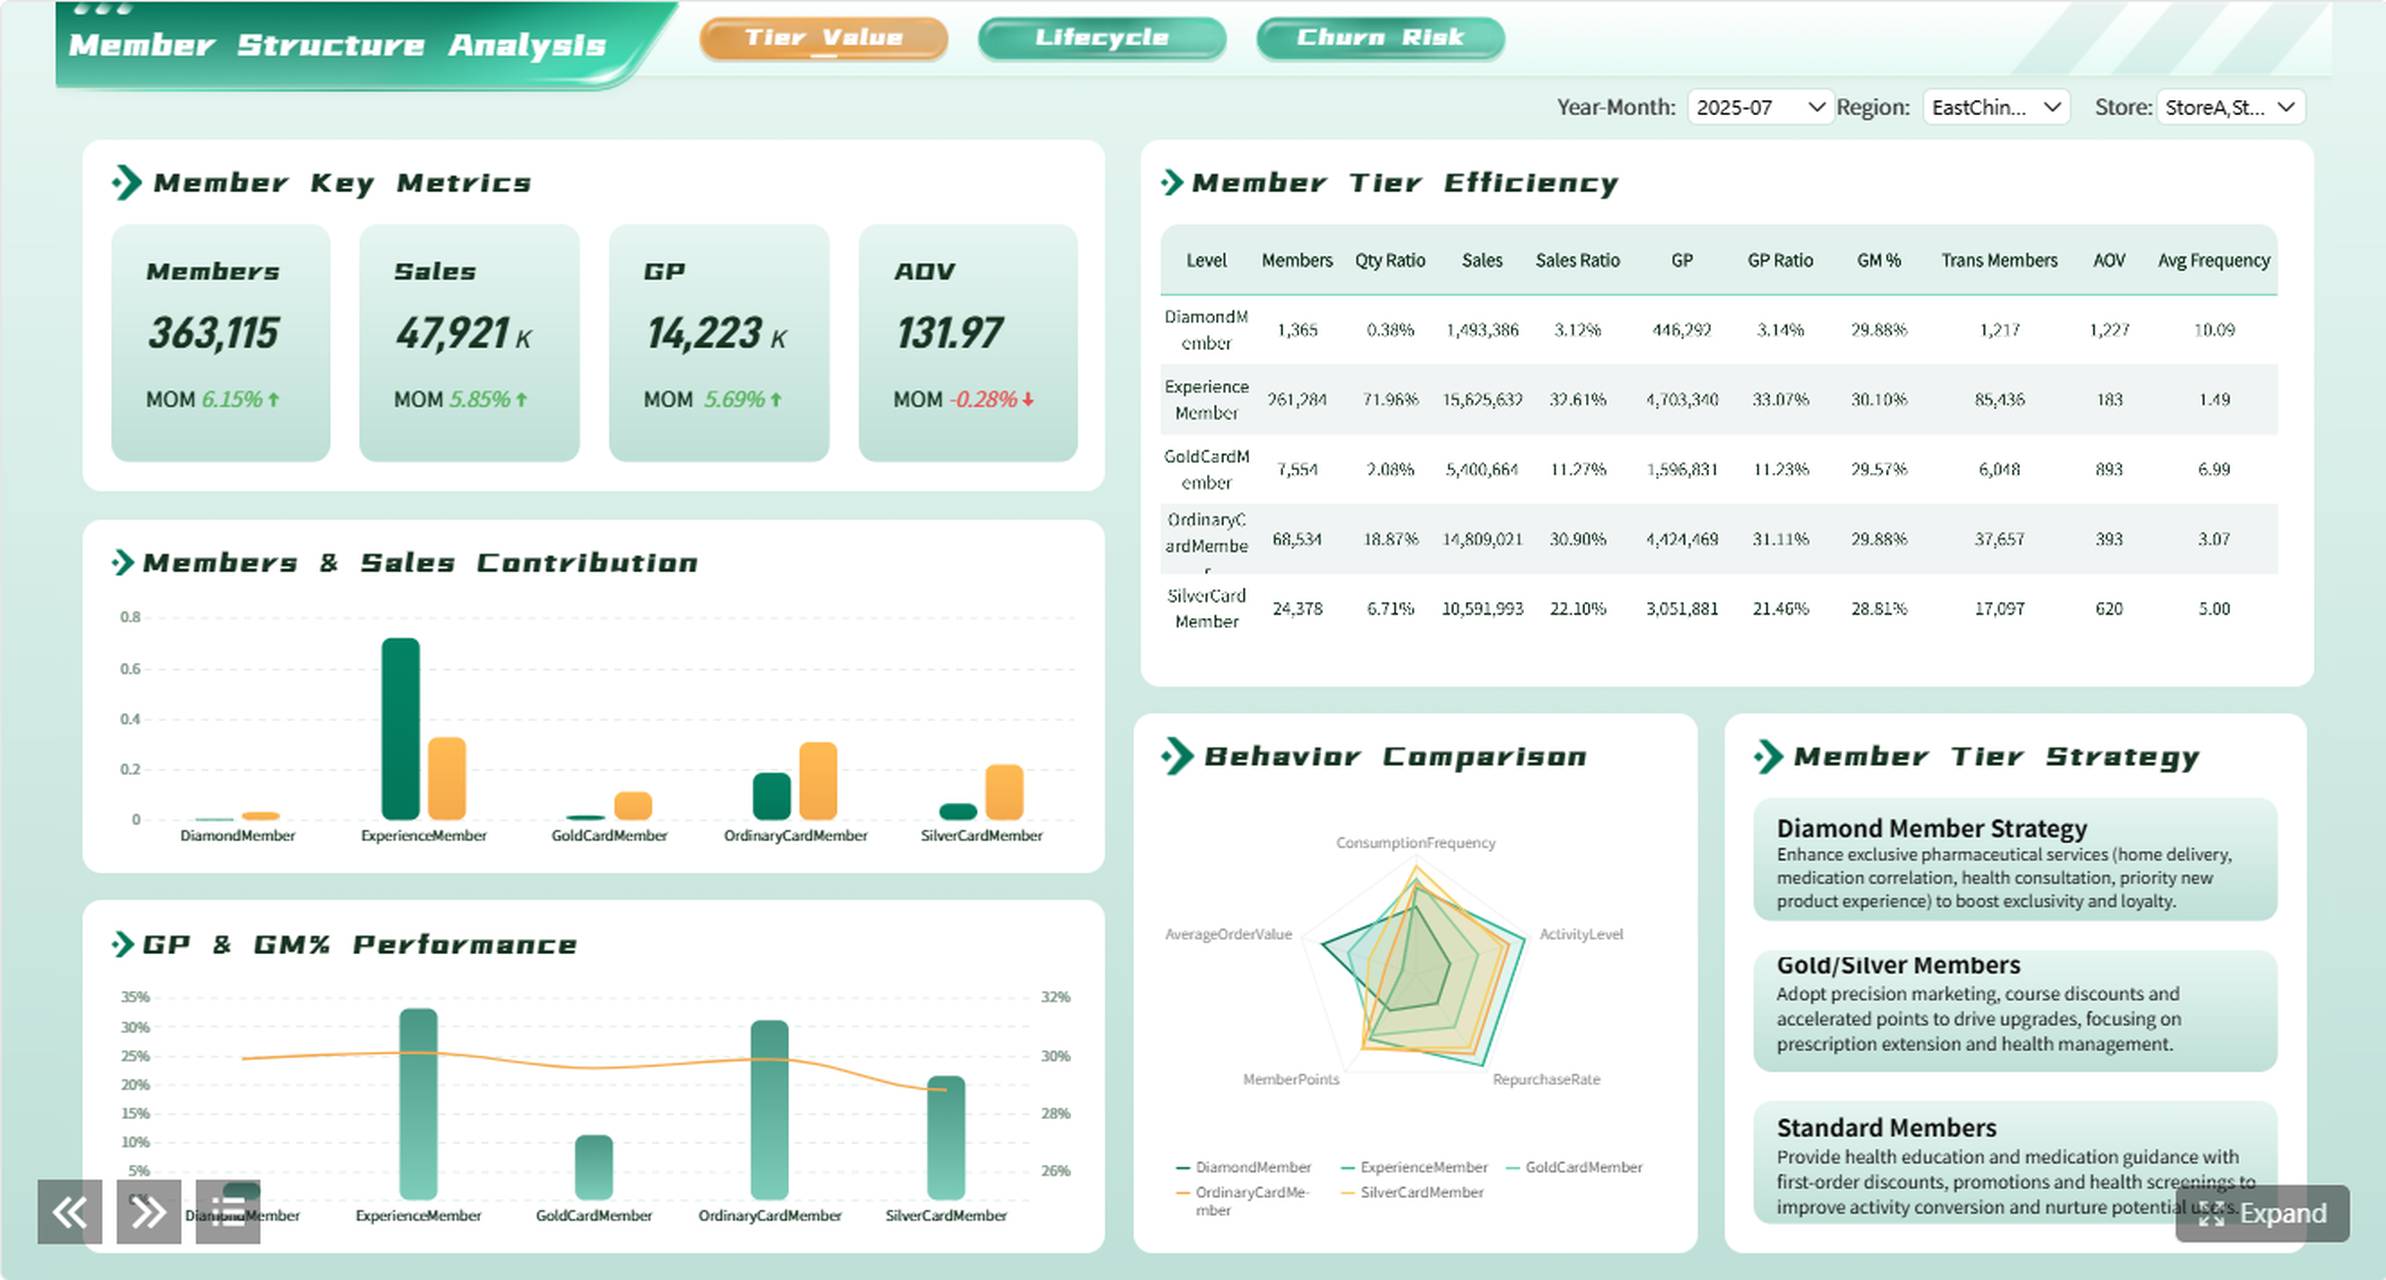
The key is not collecting every possible metric. It is choosing the metrics that support a real business decision. Strong HR reporting and analytics focuses on the few metrics that leaders actually use.
Here are the main HR reporting and analytics areas to include:
- Workforce planning: headcount, open roles, internal mobility. This helps answer whether the company has the right people in the right teams.
- Recruiting: time-to-hire, offer acceptance rate, source quality. This helps identify where the hiring process is slowing down.
- Retention: voluntary turnover, regrettable attrition, tenure risk. This helps identify which teams or roles are at risk.
- Engagement: eNPS, survey scores, sentiment themes. This helps show where employee experience is improving or declining.
- Performance: goal completion, review ratings, promotion rate. This helps show whether high performers are being developed and retained.
- DEI: representation, pay equity, promotion equity. This helps show whether opportunities are distributed fairly.
A Step-by-Step Structure for HR Reporting and Analytics
1. Define the decision
Start with the question the report needs to answer. For example, is the report meant to reduce attrition, improve hiring speed, or track engagement?
2. Select the right KPIs
Choose a small set of metrics that directly support that decision. Avoid vanity metrics that look useful but do not change action.
3. Add context
Compare current performance with prior periods, business targets, team benchmarks, or peer groups.
4. Explain the drivers
Use drill-downs, filters, and segmentation to understand which teams, roles, locations, or managers are driving the change.
5. End with recommendations
Every report should close with a next step, owner, or follow-up action. That simple rule keeps HR reporting and analytics tied to business outcomes.
Common Mistakes in HR Reporting and Analytics
- Starting with data instead of a business question
- Tracking too many KPIs at once
- Using charts without context or explanation
- Failing to compare against prior periods or benchmarks
- Ending with no recommendation or owner
The strongest HR reporting and analytics work is clear, narrow, and tied to action. Good HR reporting and analytics also makes the story easy to scan for executives and managers.
How AI Changes HR Reporting and Analytics
AI Data Agents make HR reporting and analytics more conversational and more timely. Instead of waiting for a fixed report, HR teams can ask questions like:
- What is our voluntary turnover in engineering this month?
- Which team has the highest attrition risk?
- How did engagement scores change over the last quarter?
The agent can retrieve governed data, generate a chart, summarize the insight, and suggest next steps. That is the difference between static reporting and active decision support in HR reporting and analytics.
With FineBI + Dora, this workflow can be built on top of existing HR dashboards and trusted KPI definitions. FineBI manages the metrics, dashboards, permissions, and data model. Dora turns those governed assets into a conversational interface, so HR teams can ask follow-up questions, receive visual answers, and trigger scheduled briefings without rebuilding every report manually.
For example, an HRBP could ask Dora to summarize turnover risk before a business review. Dora can use the FineBI semantic layer to retrieve the right metrics, generate a chart, and explain which teams need attention.
Real-World HR Reporting and Analytics Examples
Recruiting
A talent acquisition leader can ask which roles are stuck in the funnel, where candidates drop off, and which sources produce the best retention. This is one of the most practical HR reporting and analytics use cases.
For example, a recruiting report can show time-to-fill by department, stage conversion by role, interview bottlenecks, and candidate source quality. Instead of only showing how many roles are open, the report should explain which roles are at risk and what action recruiters should take.
Engagement
An HRBP can review engagement scores by team, compare them to the company average, and identify whether a specific manager or location is driving the shift. In HR reporting and analytics, that kind of comparison turns a chart into a decision.
For example, an engagement report can combine eNPS, pulse survey comments, participation rates, and voluntary turnover. If one team has lower manager support scores and rising attrition, the report should highlight that connection.
Turnover
A people leader can look at attrition by tenure, function, and manager to understand whether a problem is isolated or systemic. That makes turnover reporting one of the most valuable parts of HR reporting and analytics.
For example, a turnover report can compare voluntary turnover against company average, show the affected tenure bands, and flag teams above a defined risk threshold.
Performance Management
A performance report can help leaders understand whether goals, reviews, promotions, and development opportunities are aligned. Instead of only showing review ratings, HR reporting and analytics should reveal whether high performers are being retained and whether low performance is concentrated in specific teams or job families.
Diversity, Equity, and Inclusion
DEI reporting requires careful, governed analysis. A strong HR reporting and analytics report can compare representation, promotion rates, hiring funnel diversity, and pay equity across job levels and tenure bands.
Workforce Planning
Workforce planning reports help leaders compare business demand with workforce capacity. They can show planned headcount, actual headcount, open roles, internal movement, and future hiring needs.
How AI Data Agents Work in HR Reporting and Analytics
An AI Data Agent like Dora sits on top of your trusted BI foundation. It understands business definitions such as voluntary turnover, regrettable attrition, and quality of hire, then uses those definitions to answer questions consistently across HR reporting and analytics workflows.
Conversation
Users ask in plain language and get instant responses with charts and summaries.
Personalization
An HRBP, recruiter, or people manager can each get different views based on role and responsibility.
Prediction
The agent can surface patterns, risks, and likely next issues before they become visible in a monthly report.
Governance
The agent still follows the company's data permissions and semantic rules, so the output stays auditable and controlled.
Scheduled Briefings
Dora can act as a daily or weekly briefing assistant for HR teams. Instead of asking analysts to prepare recurring updates, HR leaders can receive scheduled summaries for headcount changes, turnover trends, recruiting pipeline risks, and engagement signals.
Anomaly Alerts
Dora can also monitor HR reporting and analytics dashboards for unusual changes. If turnover rises above a defined threshold or engagement drops sharply in a specific team, the agent can alert the responsible HRBP and point them to the related FineBI dashboard for deeper analysis.
A Real HR Scenario
Imagine an HR Business Partner preparing for a quarterly review with the Head of Engineering. Attrition has increased, and the leadership team wants to know where the risk is highest.
Traditionally, the HRBP would need to pull data from several systems, clean it, build slides, and summarize the findings manually.
The HRBP might ask:
"Show me this month's voluntary turnover for the engineering department, broken down by team and tenure. Compare it to the company average and highlight any teams with a rate above 15%. Also, pull the last three months of employee sentiment survey results for those highlighted teams."
With Dora, the workflow becomes much faster:
- Retrieve trusted data from the governed FineBI semantic layer.
- Apply the correct business definitions for turnover and team segmentation.
- Generate charts and a summary in chat.
- Highlight teams above the risk threshold.
- Suggest next actions such as stay interviews or manager follow-up.
This is the practical value of AI in HR reporting and analytics: less manual assembly, more decision-ready insight.
In this scenario, FineBI works as the governed data foundation and visual analytics layer. Dora works as the AI assistant that understands the request, finds the right metrics, and returns the answer in a format that HR and business leaders can act on quickly.
Implementing Better HR Reporting and Analytics
Start with readiness
Audit your data sources, metric definitions, and permission model before automating anything.
Pick repeatable use cases
Start with recurring reporting work such as weekly headcount updates, monthly turnover summaries, or engagement digests.
Define success metrics
Measure impact in business terms, such as less time spent on reporting, faster risk detection, or better meeting preparation.
Build for governance
Make sure the BI layer, semantic layer, and AI agent all use the same trusted definitions.
FineBI is useful here because it lets teams centralize HR metrics, dashboard logic, and permission rules. Dora can then answer questions based on those governed definitions instead of generating unsupported answers from disconnected files.
Train the team
HR should evolve from report builders into data interpreters and workflow owners.
In a FineBI + Dora workflow, HR teams do not need to become technical analysts. They need to define business questions, KPI rules, risk thresholds, and follow-up actions. The platform handles the repeatable reporting and analysis workflow.
A Practical HR Reporting and Analytics Template
You can use this structure when building an HR report:
- Executive summary
- Business question
- Reporting scope
- Data sources
- KPI definitions
- Key findings
- Charts and tables
- Segment analysis
- Root-cause explanation
- Recommendations
- Owners and next steps
- Appendix
This template keeps HR reporting and analytics focused on decision-making. It also helps executives scan the report quickly without losing the details needed for deeper analysis.
FineBI + Dora for HR Reporting and Analytics
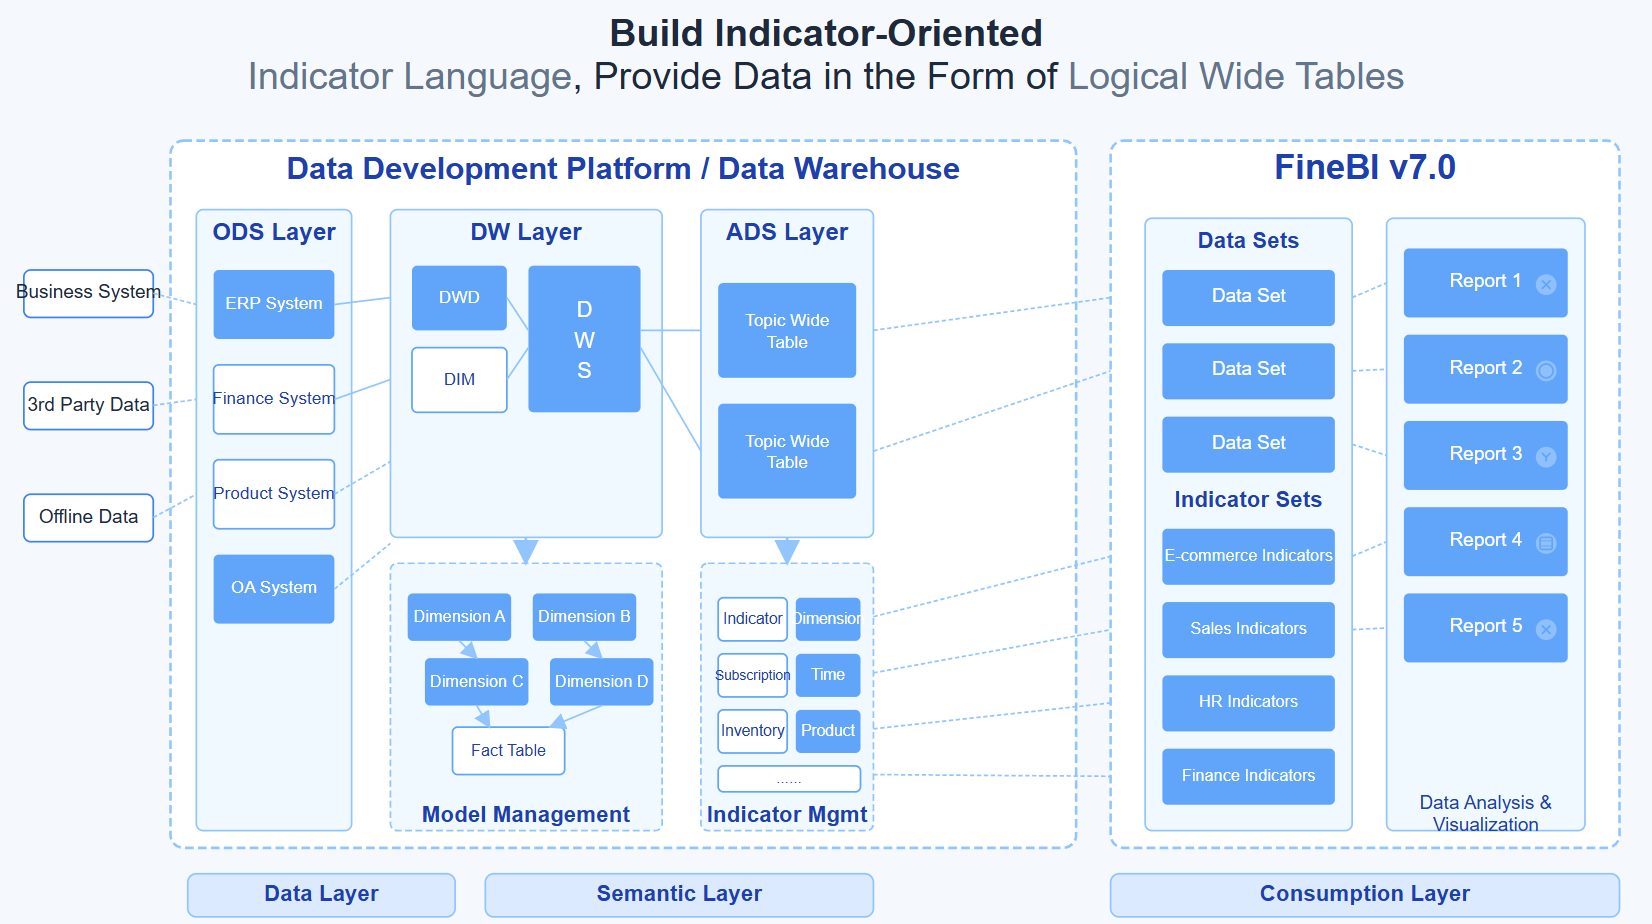
FineBI gives HR teams the trusted reporting foundation: dashboards, semantic models, and governed metrics from core people data sources. For HR reporting and analytics teams, that foundation matters because every metric stays consistent.
Dora adds the AI layer on top. It turns that foundation into a conversational assistant that can answer questions, generate visual summaries, deliver scheduled briefings, and monitor anomalies. Together, FineBI and Dora make HR reporting and analytics faster, more governed, and easier to scale.
This combination is useful because HR data is often scattered across many systems. FineBI can unify dashboards and governed metrics from HRIS, ATS, engagement surveys, performance systems, and other sources. Dora can then answer questions from that trusted layer instead of relying on generic prompts or disconnected files.
For HR teams, this means less time spent preparing recurring reports and more time spent interpreting insights, designing interventions, and supporting business leaders.
The most effective HR reporting and analytics setup combines trusted data, clear semantics, and repeatable AI workflows. That is what turns reporting into a strategic asset.
FineBI + Dora is especially useful for HR teams that need:
- A unified view of HR data from multiple systems
- Governed KPI definitions for turnover, headcount, hiring, and engagement
- Interactive dashboards for HRBPs, executives, recruiters, and managers
- AI chat analysis based on trusted BI assets
- Scheduled briefings before recurring HR meetings
- Alerts when key HR metrics cross risk thresholds
- A more scalable way to deliver HR reporting and analytics across the business
Conclusion: The Future of HR Reporting and Analytics
HR reporting and analytics is no longer just about collecting numbers. It is about helping leaders understand what is happening, why it is happening, and what they should do next.
AI Data Agents make that workflow faster and more usable. With FineBI as the governed data foundation and Dora as the conversational layer, HR can shift from static reporting to continuous strategic insight. That is the future of HR reporting and analytics.
HR Reporting and Analytics Checklist
- Does the report answer a real business question?
- Does it use trusted HR reporting and analytics definitions?
- Does it compare against a baseline or benchmark?
- Does it explain the driver behind the change?
- Does it end with a recommendation or owner?
What is HR reporting and analytics?
HR reporting and analytics is the process of collecting, organizing, analyzing, and presenting workforce data so leaders can make better decisions about people, performance, and planning.
How is AI changing HR reporting and analytics?
AI makes reporting faster, more conversational, and more actionable by letting users ask questions in natural language and receive governed answers, charts, and recommendations.
###What metrics matter most in HR reporting and analytics?
Common metrics include headcount, turnover, retention, time-to-hire, engagement, performance trends, DEI indicators, and training progress.
Why do traditional HR dashboards fall short?
They are often reactive, inflexible, and weak on context, so they show numbers without explaining the drivers behind them.
How do FineBI and Dora work together?
FineBI provides the governed BI foundation and trusted metrics, while Dora adds a conversational AI layer for analysis, briefing, alerts, and follow-up workflows.
How can a company start improving HR reporting and analytics?
Start with one recurring business question, such as turnover risk, hiring bottlenecks, or engagement decline. Then define the metrics, confirm the data source, build a repeatable report, and add AI-assisted analysis only after the data foundation is trusted.
Final Thoughts
The goal of HR reporting and analytics is not to create more reports. It is to help HR and business leaders make better decisions about people. A strong report connects metrics to business context, explains what changed, and gives leaders a clear next step.
With FineBI as the governed BI foundation and Dora as the conversational AI layer, HR teams can reduce manual reporting work, respond faster to workforce changes, and turn HR reporting and analytics into a proactive decision-making system.
Introduction: What HR Reporting and Analytics Should Deliver
HR reporting and analytics has moved far beyond static monthly dashboards. For years, HR teams have relied on spreadsheets, recurring reports, and slide decks to track headcount, turnover, engagement, and hiring performance. Those reports can show what happened, but they often fail to explain why it happened or what to do next.
Today, a better model is emerging: conversational, AI-powered HR analytics. Instead of waiting for a new dashboard or asking an analyst to build a custom report, HR leaders can ask questions in natural language and get immediate answers, charts, and follow-up suggestions based on governed business data. That shift turns HR reporting and analytics from a backward-looking activity into a decision-making workflow.
With FineBI + Dora, HR teams can move from manual reporting to AI-assisted insight delivery. Users can ask for analysis in chat, view trusted charts, and receive scheduled summaries before important meetings, so HR becomes a strategic partner instead of a reporting desk. For teams building HR reporting and analytics at scale, that shift is the difference between collecting numbers and creating action.
FineBI provides the dashboard, metric, and semantic layer needed for trusted HR analysis, while Dora adds an AI Data Agent experience on top of that foundation. Together, they help HR teams move from manual report preparation to governed, conversational analysis.
What a Good HR Reporting and Analytics Report Should Answer
A strong HR reporting and analytics process should help the business answer three questions:
- What is happening across the workforce?
- Why is it happening?
- What should we do next?
That means the report should do more than display KPIs. It should connect metrics to business context, show changes over time, and point leaders toward action. A good HR reporting and analytics report is not just descriptive. It is diagnostic and, ideally, predictive.
What Is HR Reporting and Analytics?
HR reporting and analytics is the practice of collecting, organizing, analyzing, and presenting workforce data so HR teams and business leaders can make better people decisions. It connects data from HRIS, ATS, performance management, payroll, engagement surveys, and learning systems into a structured view of the workforce.
HR reporting usually focuses on presenting standardized metrics, such as headcount, turnover, time-to-hire, or absence rates. HR analytics goes deeper by explaining patterns, identifying drivers, comparing segments, and helping leaders decide what action to take.
In practice, HR reporting and analytics should combine both sides. A report should show the metric, explain the meaning, and recommend the next step.
Why Traditional HR Reporting and Analytics Falls Short
It Is Reactive
Traditional reports are usually built after the month closes or after someone requests them. By the time leaders see the numbers, the situation may already have changed. In HR reporting and analytics, that delay makes it harder to spot attrition risk, hiring bottlenecks, or engagement drops in time.
It Is Inflexible
If a leader wants to compare turnover by team, tenure, and manager, someone usually has to rebuild the report or export the data manually. That slows decision-making and weakens the value of HR reporting and analytics.
It Lacks Narrative
Charts can show the trend, but they often do not explain the cause. A spike in attrition or a drop in engagement still needs interpretation, especially in HR reporting and analytics workflows that support leadership decisions.
It Buries Context
Without drill-downs, governed definitions, and linked supporting data, HR teams struggle to connect a metric to the real reason behind it. That is why HR reporting and analytics should always include context, comparison, and next-step guidance.
Core Metrics in HR Reporting and Analytics
The exact metrics depend on the business, but most HR reporting and analytics programs should cover:
- Headcount and workforce composition
- Turnover and retention
- Time-to-hire and hiring funnel conversion
- Employee engagement and sentiment
- Performance and promotion trends
- DEI and pay equity indicators
- Training and skills development
The key is not collecting every possible metric. It is choosing the metrics that support a real business decision. Strong HR reporting and analytics focuses on the few metrics that leaders actually use.
Here are the main HR reporting and analytics areas to include:
- Workforce planning: headcount, open roles, internal mobility. This helps answer whether the company has the right people in the right teams.
- Recruiting: time-to-hire, offer acceptance rate, source quality. This helps identify where the hiring process is slowing down.
- Retention: voluntary turnover, regrettable attrition, tenure risk. This helps identify which teams or roles are at risk.
- Engagement: eNPS, survey scores, sentiment themes. This helps show where employee experience is improving or declining.
- Performance: goal completion, review ratings, promotion rate. This helps show whether high performers are being developed and retained.
- DEI: representation, pay equity, promotion equity. This helps show whether opportunities are distributed fairly.
A Step-by-Step Structure for HR Reporting and Analytics
1. Define the decision
Start with the question the report needs to answer. For example, is the report meant to reduce attrition, improve hiring speed, or track engagement?
2. Select the right KPIs
Choose a small set of metrics that directly support that decision. Avoid vanity metrics that look useful but do not change action.
3. Add context
Compare current performance with prior periods, business targets, team benchmarks, or peer groups.
4. Explain the drivers
Use drill-downs, filters, and segmentation to understand which teams, roles, locations, or managers are driving the change.
5. End with recommendations
Every report should close with a next step, owner, or follow-up action. That simple rule keeps HR reporting and analytics tied to business outcomes.
Common Mistakes in HR Reporting and Analytics
- Starting with data instead of a business question
- Tracking too many KPIs at once
- Using charts without context or explanation
- Failing to compare against prior periods or benchmarks
- Ending with no recommendation or owner
The strongest HR reporting and analytics work is clear, narrow, and tied to action. Good HR reporting and analytics also makes the story easy to scan for executives and managers.
How AI Changes HR Reporting and Analytics
AI Data Agents make HR reporting and analytics more conversational and more timely. Instead of waiting for a fixed report, HR teams can ask questions like:
- What is our voluntary turnover in engineering this month?
- Which team has the highest attrition risk?
- How did engagement scores change over the last quarter?
The agent can retrieve governed data, generate a chart, summarize the insight, and suggest next steps. That is the difference between static reporting and active decision support in HR reporting and analytics.
With FineBI + Dora, this workflow can be built on top of existing HR dashboards and trusted KPI definitions. FineBI manages the metrics, dashboards, permissions, and data model. Dora turns those governed assets into a conversational interface, so HR teams can ask follow-up questions, receive visual answers, and trigger scheduled briefings without rebuilding every report manually.
For example, an HRBP could ask Dora to summarize turnover risk before a business review. Dora can use the FineBI semantic layer to retrieve the right metrics, generate a chart, and explain which teams need attention.
Real-World HR Reporting and Analytics Examples
Recruiting
A talent acquisition leader can ask which roles are stuck in the funnel, where candidates drop off, and which sources produce the best retention. This is one of the most practical HR reporting and analytics use cases.
For example, a recruiting report can show time-to-fill by department, stage conversion by role, interview bottlenecks, and candidate source quality. Instead of only showing how many roles are open, the report should explain which roles are at risk and what action recruiters should take.
Engagement
An HRBP can review engagement scores by team, compare them to the company average, and identify whether a specific manager or location is driving the shift. In HR reporting and analytics, that kind of comparison turns a chart into a decision.
For example, an engagement report can combine eNPS, pulse survey comments, participation rates, and voluntary turnover. If one team has lower manager support scores and rising attrition, the report should highlight that connection.
Turnover
A people leader can look at attrition by tenure, function, and manager to understand whether a problem is isolated or systemic. That makes turnover reporting one of the most valuable parts of HR reporting and analytics.
For example, a turnover report can compare voluntary turnover against company average, show the affected tenure bands, and flag teams above a defined risk threshold.
Performance Management
A performance report can help leaders understand whether goals, reviews, promotions, and development opportunities are aligned. Instead of only showing review ratings, HR reporting and analytics should reveal whether high performers are being retained and whether low performance is concentrated in specific teams or job families.
Diversity, Equity, and Inclusion
DEI reporting requires careful, governed analysis. A strong HR reporting and analytics report can compare representation, promotion rates, hiring funnel diversity, and pay equity across job levels and tenure bands.
Workforce Planning
Workforce planning reports help leaders compare business demand with workforce capacity. They can show planned headcount, actual headcount, open roles, internal movement, and future hiring needs.
How AI Data Agents Work in HR Reporting and Analytics
An AI Data Agent like Dora sits on top of your trusted BI foundation. It understands business definitions such as voluntary turnover, regrettable attrition, and quality of hire, then uses those definitions to answer questions consistently across HR reporting and analytics workflows.
Conversation
Users ask in plain language and get instant responses with charts and summaries.
Personalization
An HRBP, recruiter, or people manager can each get different views based on role and responsibility.
Prediction
The agent can surface patterns, risks, and likely next issues before they become visible in a monthly report.
Governance
The agent still follows the company's data permissions and semantic rules, so the output stays auditable and controlled.
Scheduled Briefings
Dora can act as a daily or weekly briefing assistant for HR teams. Instead of asking analysts to prepare recurring updates, HR leaders can receive scheduled summaries for headcount changes, turnover trends, recruiting pipeline risks, and engagement signals.
Anomaly Alerts
Dora can also monitor HR reporting and analytics dashboards for unusual changes. If turnover rises above a defined threshold or engagement drops sharply in a specific team, the agent can alert the responsible HRBP and point them to the related FineBI dashboard for deeper analysis.
A Real HR Scenario
Imagine an HR Business Partner preparing for a quarterly review with the Head of Engineering. Attrition has increased, and the leadership team wants to know where the risk is highest.
Traditionally, the HRBP would need to pull data from several systems, clean it, build slides, and summarize the findings manually.
The HRBP might ask:
"Show me this month's voluntary turnover for the engineering department, broken down by team and tenure. Compare it to the company average and highlight any teams with a rate above 15%. Also, pull the last three months of employee sentiment survey results for those highlighted teams."
With Dora, the workflow becomes much faster:
- Retrieve trusted data from the governed FineBI semantic layer.
- Apply the correct business definitions for turnover and team segmentation.
- Generate charts and a summary in chat.
- Highlight teams above the risk threshold.
- Suggest next actions such as stay interviews or manager follow-up.
This is the practical value of AI in HR reporting and analytics: less manual assembly, more decision-ready insight.
In this scenario, FineBI works as the governed data foundation and visual analytics layer. Dora works as the AI assistant that understands the request, finds the right metrics, and returns the answer in a format that HR and business leaders can act on quickly.
Implementing Better HR Reporting and Analytics
Start with readiness
Audit your data sources, metric definitions, and permission model before automating anything.
Pick repeatable use cases
Start with recurring reporting work such as weekly headcount updates, monthly turnover summaries, or engagement digests.
Define success metrics
Measure impact in business terms, such as less time spent on reporting, faster risk detection, or better meeting preparation.
Build for governance
Make sure the BI layer, semantic layer, and AI agent all use the same trusted definitions.
FineBI is useful here because it lets teams centralize HR metrics, dashboard logic, and permission rules. Dora can then answer questions based on those governed definitions instead of generating unsupported answers from disconnected files.
Train the team
HR should evolve from report builders into data interpreters and workflow owners.
In a FineBI + Dora workflow, HR teams do not need to become technical analysts. They need to define business questions, KPI rules, risk thresholds, and follow-up actions. The platform handles the repeatable reporting and analysis workflow.
A Practical HR Reporting and Analytics Template
You can use this structure when building an HR report:
- Executive summary
- Business question
- Reporting scope
- Data sources
- KPI definitions
- Key findings
- Charts and tables
- Segment analysis
- Root-cause explanation
- Recommendations
- Owners and next steps
- Appendix
This template keeps HR reporting and analytics focused on decision-making. It also helps executives scan the report quickly without losing the details needed for deeper analysis.
FineBI + Dora for HR Reporting and Analytics
FineBI gives HR teams the trusted reporting foundation: dashboards, semantic models, and governed metrics from core people data sources. For HR reporting and analytics teams, that foundation matters because every metric stays consistent.
Dora adds the AI layer on top. It turns that foundation into a conversational assistant that can answer questions, generate visual summaries, deliver scheduled briefings, and monitor anomalies. Together, FineBI and Dora make HR reporting and analytics faster, more governed, and easier to scale.
This combination is useful because HR data is often scattered across many systems. FineBI can unify dashboards and governed metrics from HRIS, ATS, engagement surveys, performance systems, and other sources. Dora can then answer questions from that trusted layer instead of relying on generic prompts or disconnected files.
For HR teams, this means less time spent preparing recurring reports and more time spent interpreting insights, designing interventions, and supporting business leaders.
The most effective HR reporting and analytics setup combines trusted data, clear semantics, and repeatable AI workflows. That is what turns reporting into a strategic asset.
FineBI + Dora is especially useful for HR teams that need:
- A unified view of HR data from multiple systems
- Governed KPI definitions for turnover, headcount, hiring, and engagement
- Interactive dashboards for HRBPs, executives, recruiters, and managers
- AI chat analysis based on trusted BI assets
- Scheduled briefings before recurring HR meetings
- Alerts when key HR metrics cross risk thresholds
- A more scalable way to deliver HR reporting and analytics across the business
Conclusion: The Future of HR Reporting and Analytics
HR reporting and analytics is no longer just about collecting numbers. It is about helping leaders understand what is happening, why it is happening, and what they should do next.
AI Data Agents make that workflow faster and more usable. With FineBI as the governed data foundation and Dora as the conversational layer, HR can shift from static reporting to continuous strategic insight. That is the future of HR reporting and analytics.
HR Reporting and Analytics Checklist
- Does the report answer a real business question?
- Does it use trusted HR reporting and analytics definitions?
- Does it compare against a baseline or benchmark?
- Does it explain the driver behind the change?
- Does it end with a recommendation or owner?
FAQs
What is HR reporting and analytics?
HR reporting and analytics is the process of collecting, organizing, analyzing, and presenting workforce data so leaders can make better decisions about people, performance, and planning.
How is AI changing HR reporting and analytics?
AI makes reporting faster, more conversational, and more actionable by letting users ask questions in natural language and receive governed answers, charts, and recommendations.
What metrics matter most in HR reporting and analytics?
Common metrics include headcount, turnover, retention, time-to-hire, engagement, performance trends, DEI indicators, and training progress.
Why do traditional HR dashboards fall short?
They are often reactive, inflexible, and weak on context, so they show numbers without explaining the drivers behind them.
How do FineBI and Dora work together?
FineBI provides the governed BI foundation and trusted metrics, while Dora adds a conversational AI layer for analysis, briefing, alerts, and follow-up workflows.
How can a company start improving HR reporting and analytics?
Start with one recurring business question, such as turnover risk, hiring bottlenecks, or engagement decline. Then define the metrics, confirm the data source, build a repeatable report, and add AI-assisted analysis only after the data foundation is trusted.
Final Thoughts
The goal of HR reporting and analytics is not to create more reports. It is to help HR and business leaders make better decisions about people. A strong report connects metrics to business context, explains what changed, and gives leaders a clear next step.
With FineBI as the governed BI foundation and Dora as the conversational AI layer, HR teams can reduce manual reporting work, respond faster to workforce changes, and turn HR reporting and analytics into a proactive decision-making system.