Retail business intelligence transforms POS transactions, inventory records, customer interactions, and supply chain data into interactive dashboards that drive decisions at every level—from store floor to executive suite. In a sector where margins are thin and consumer expectations shift weekly, the ability to see what is happening now and understand why separates profitable retailers from those reacting too late.
This guide covers the core use cases, KPIs, dashboard examples, data sources, and implementation challenges of retail BI, with practical guidance on building self-service analytics using FineBI.
All dashboards in this article are created with the self-service analytics software FineBI. Click on the dashboards to interact!
What Is Retail Business Intelligence?
Retail business intelligence is the practice of collecting, integrating, analyzing, and visualizing retail-specific data to support operational, tactical, and strategic decisions. Unlike generic BI, retail BI focuses on domain-specific questions: Which stores are underperforming and why? Which SKUs are driving margin erosion? How effective was last week's promotion? What is the real-time stock position across channels?
Modern retail BI is characterized by:
- Self-service access. Store managers, merchandisers, and marketers explore data directly without waiting for IT-generated reports.
- Multi-source integration. POS, ERP, CRM, ecommerce, loyalty, foot traffic, and supply chain data converge in a single analytical layer.
- Real-time or near-real-time visibility. Dashboards refresh frequently enough to support intraday operational decisions.
- Interactive exploration. Drill-down from enterprise totals to region, store, category, and SKU level within seconds.
- Actionable output. Insights connect to workflows—replenishment triggers, markdown approvals, campaign adjustments—not just static charts.
Why Retailers Need Business Intelligence
Retail operates on volume, velocity, and variability. Three pressures make BI essential:
- Margin compression. Rising costs and price transparency mean retailers cannot afford blind spots in pricing, shrinkage, or inefficient assortment. BI surfaces margin leaks at granular levels.
- Channel complexity. Unified commerce requires visibility across physical stores, ecommerce, marketplaces, and wholesale. Siloed data creates conflicting truths; integrated BI creates a single source.
- Decision speed. Seasonal shifts, viral trends, and competitor promotions demand responses in hours, not weeks. Self-service dashboards compress the insight-to-action cycle.
Retailers who deploy BI effectively report measurable outcomes: reduced stockouts, improved sell-through rates, higher customer lifetime value, and faster promotional ROI assessment. The competitive gap between data-enabled and data-dependent retailers continues to widen.
Retail BI Data Sources
Retail BI draws from a diverse ecosystem. Each source answers different questions, and their combination creates analytical power no single system provides.
Integrating these sources manually is unsustainable. FineDataLink connects and synchronizes data from POS systems, ERP, CRM, ecommerce platforms, inventory systems, and supply chain databases, giving FineBI a reliable data foundation for retail dashboards. Automated pipelines ensure dashboards reflect current data without manual extraction or spreadsheet reconciliation.
Retail Business Intelligence Use Cases
Retail BI serves six primary analytical domains. Each maps to specific business questions and decision workflows.
These use cases are not isolated. Effective retail BI connects them: a promotion effectiveness analysis should link marketing spend to sales uplift, inventory depletion, and customer acquisition in a single view. Cross-domain visibility is what distinguishes retail BI from departmental reporting.
Retail BI Dashboard Examples
Dashboards should be designed around user roles and decision contexts, not data availability. Below are proven retail dashboard types with representative KPIs.
All dashboards referenced in this article can be built with FineBI's drag-and-drop interface, supporting drill-down, filtering, cross-highlighting, and scheduled refresh. Interactive exploration allows users to move from summary metrics to root-cause detail without requesting new reports.
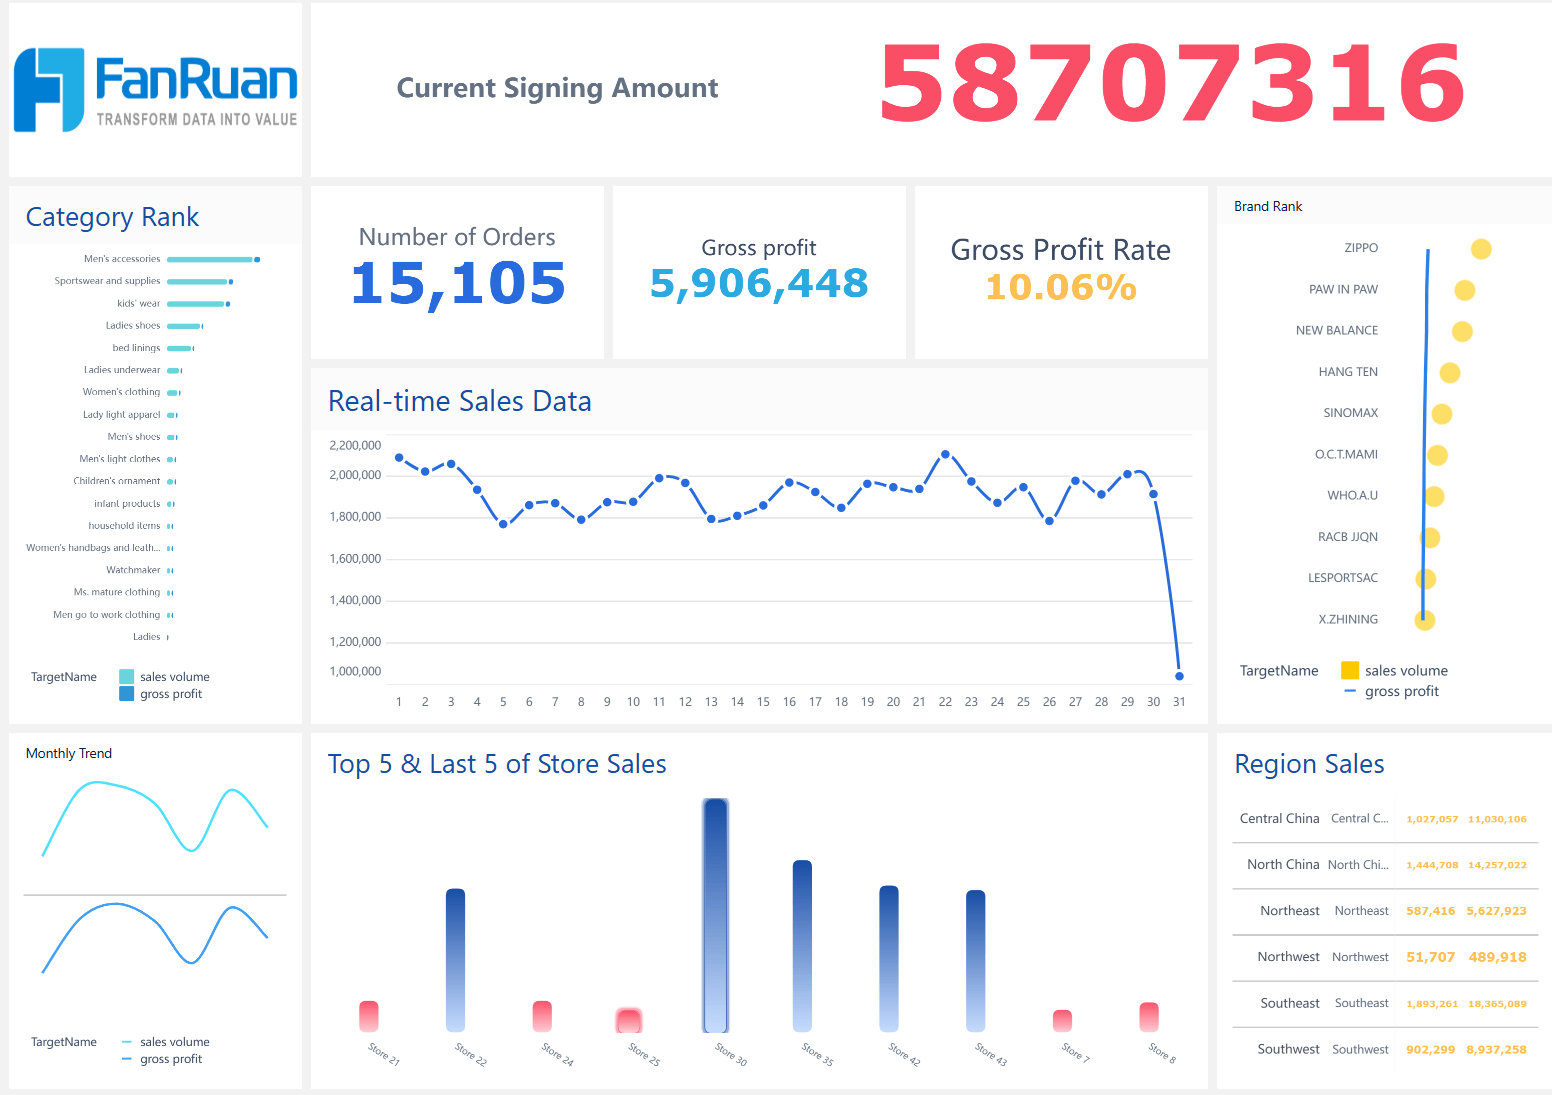
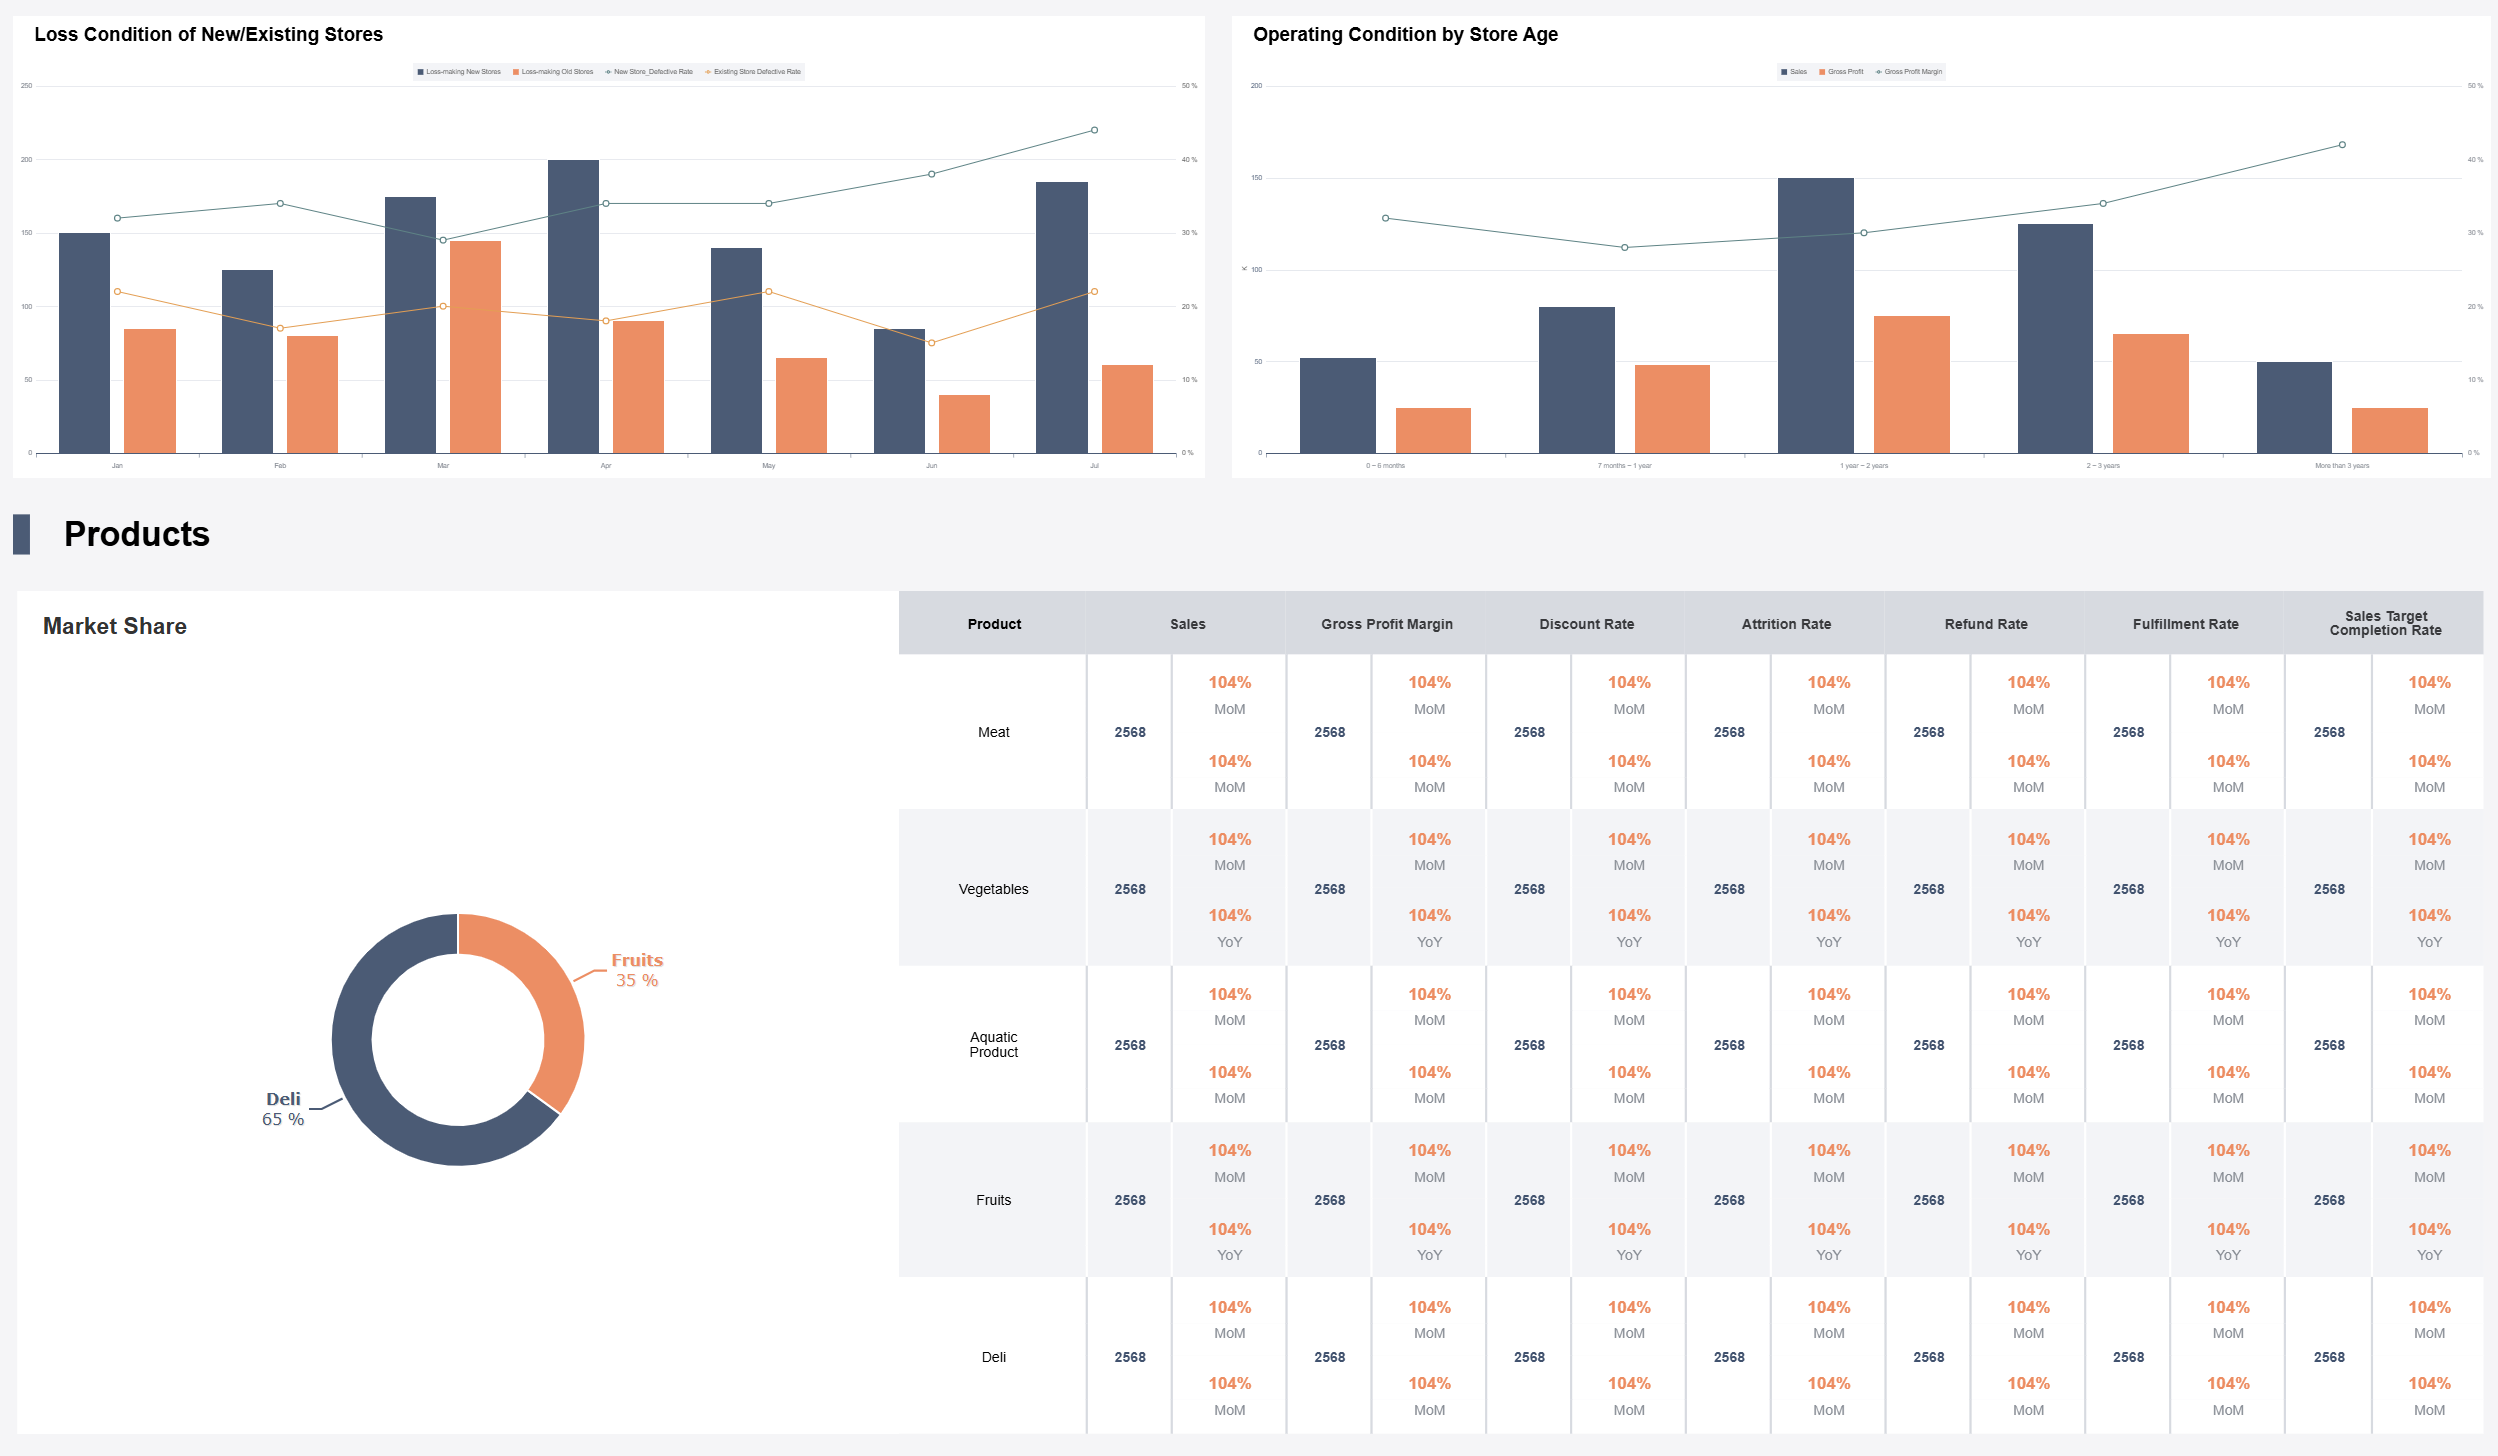
Sales Dashboard Template
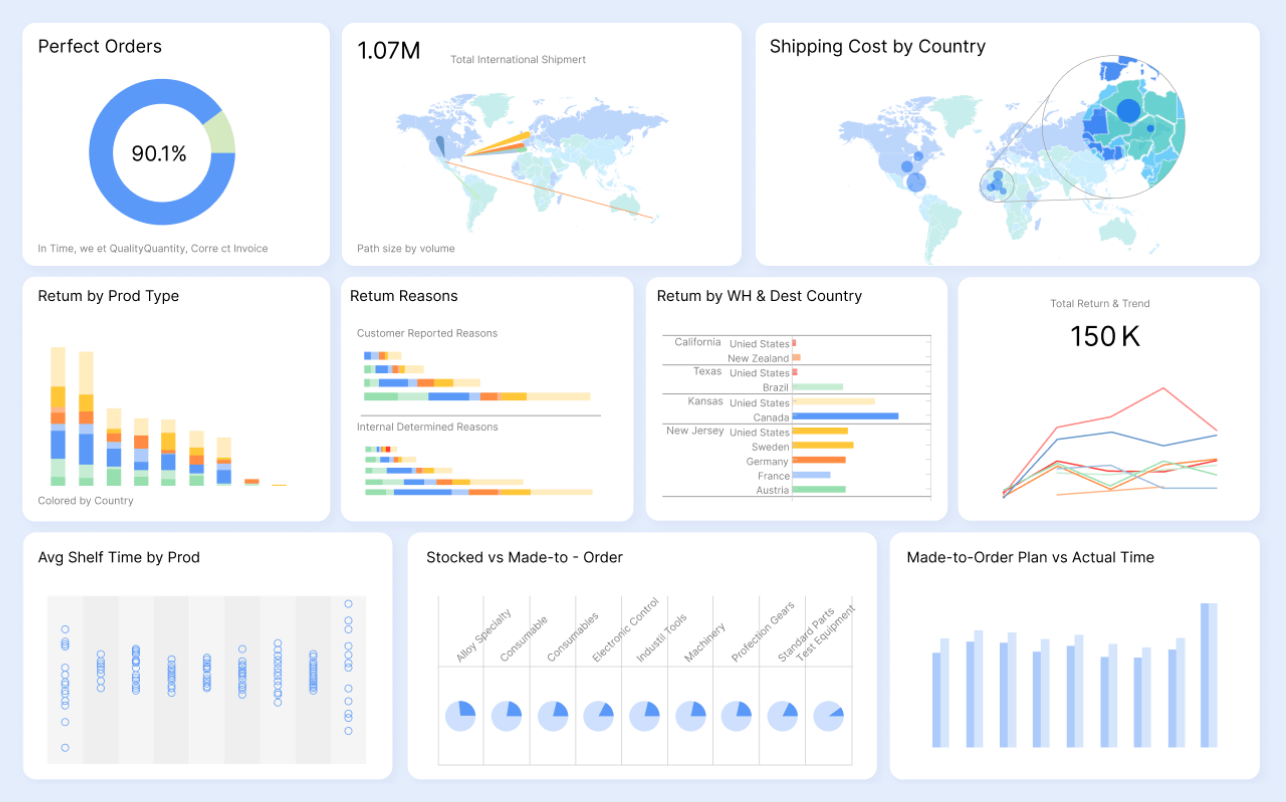
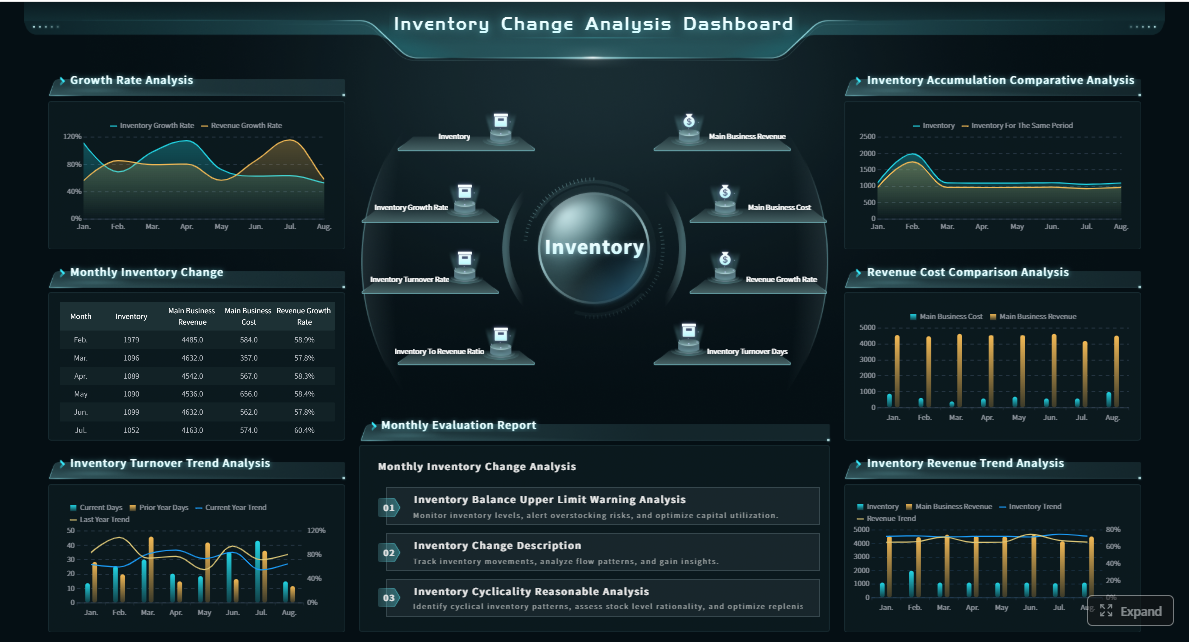
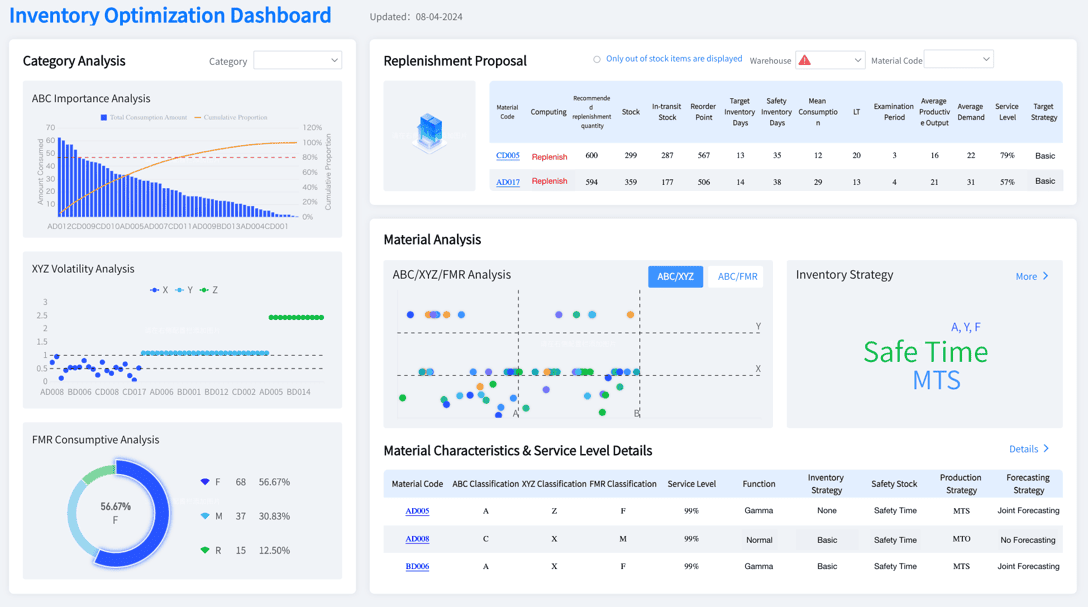
Inventory Dashboard Template
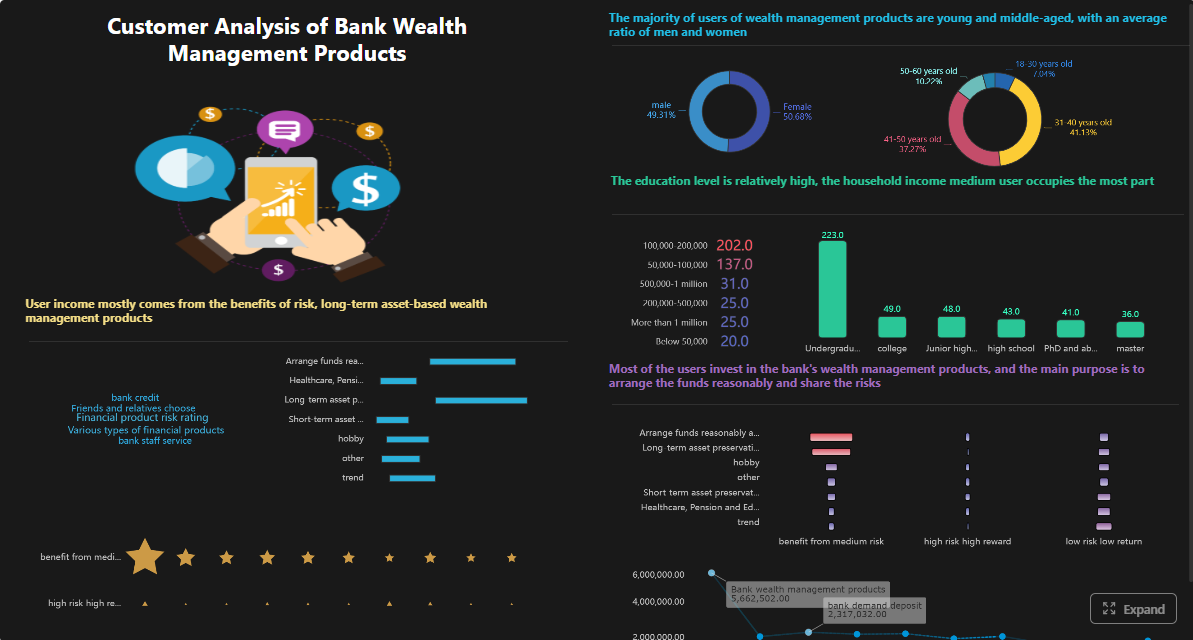
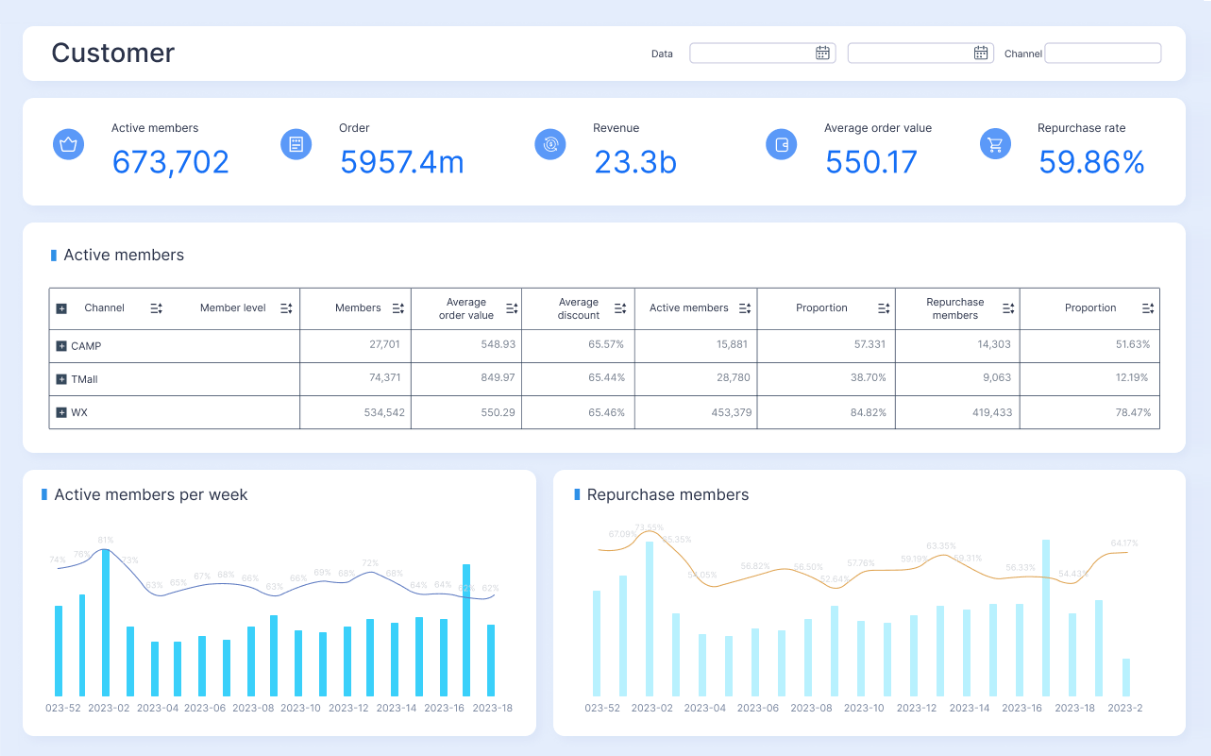
Customer Dashboard Template
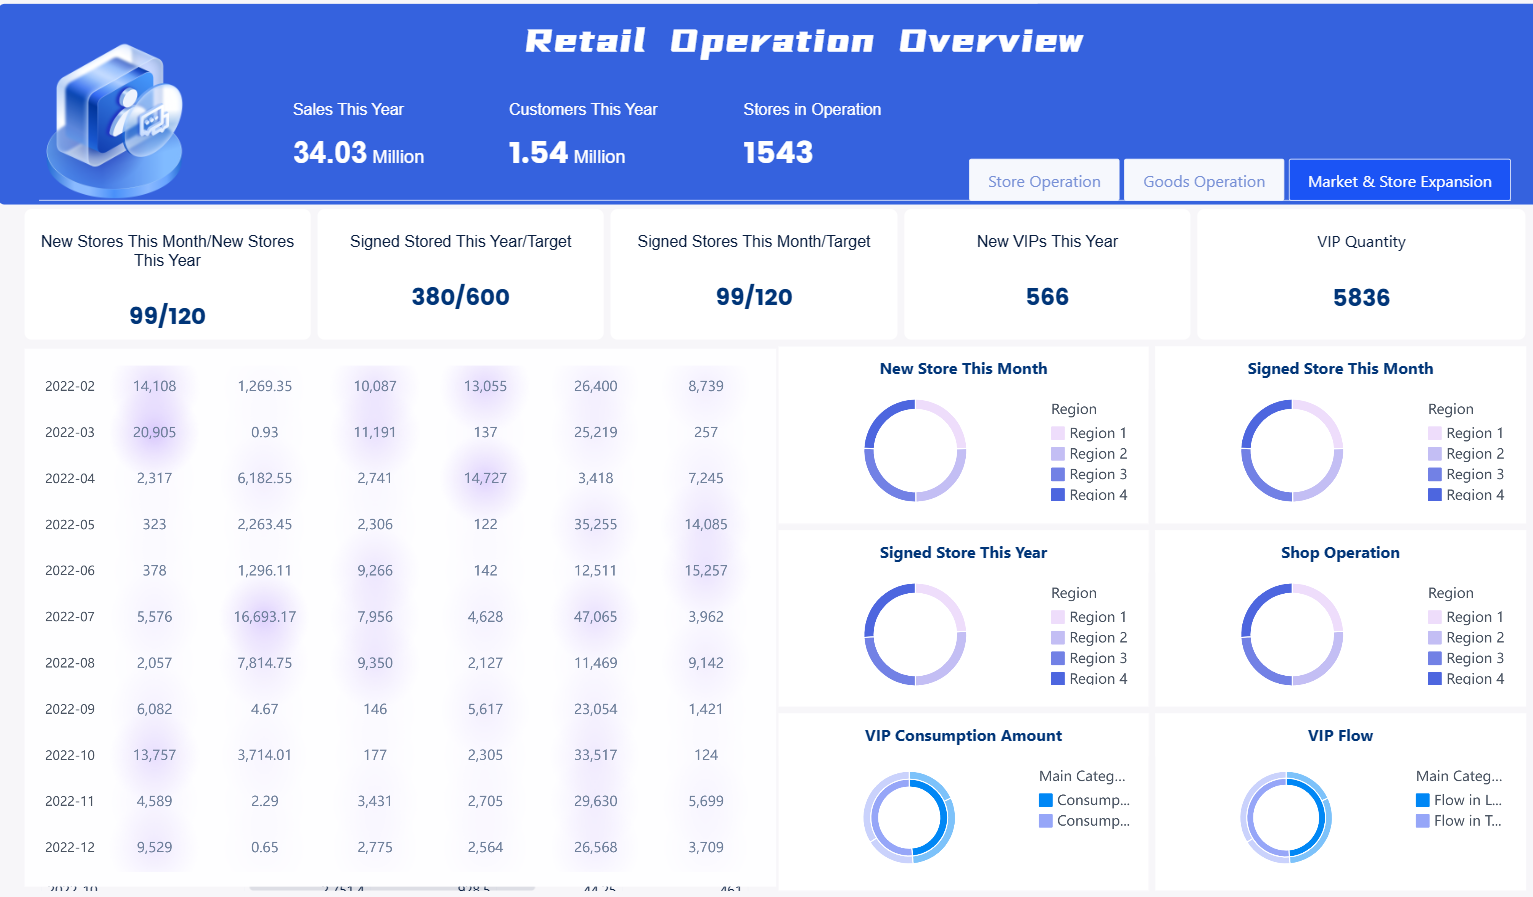
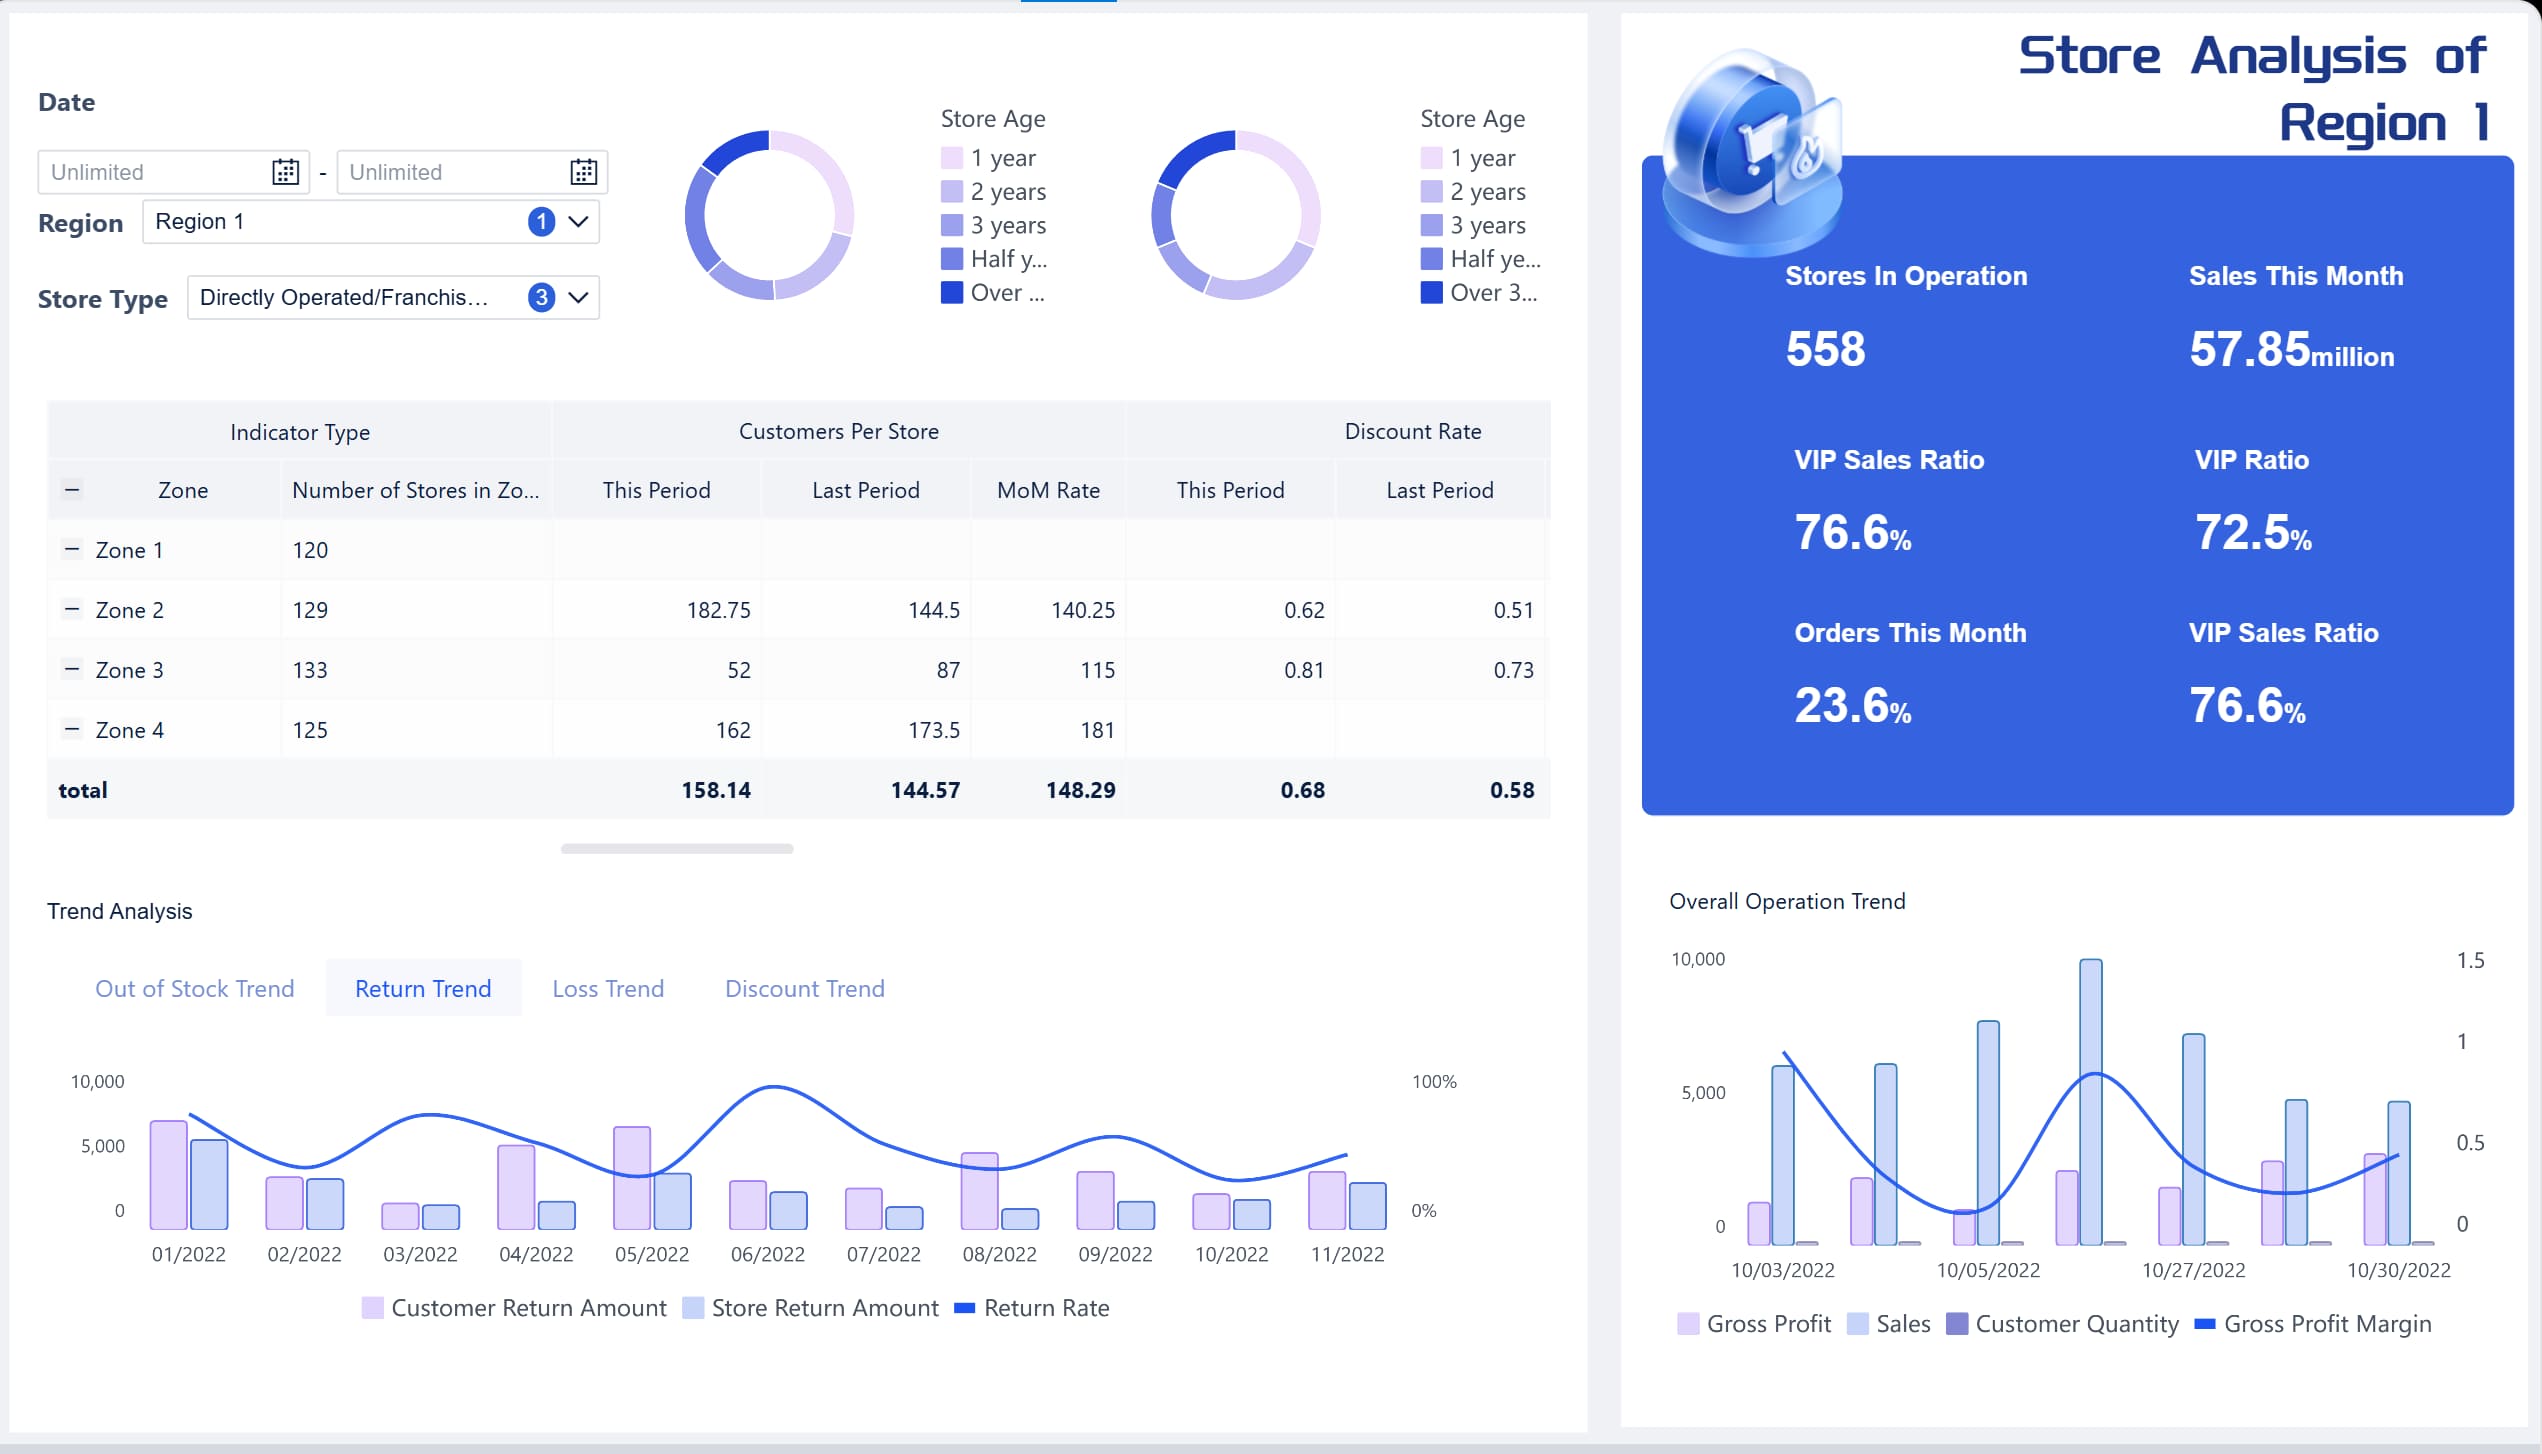
Store Dashboard Template
Explore FineBI for retail business intelligence dashboards →
Retail BI KPIs and Metrics
Selecting the right KPIs prevents dashboard overload. Prioritize metrics that directly inform action and align to organizational objectives.
Sales and Profitability
- Revenue: Total sales by period, store, channel, category, SKU.
- Gross Margin %: (Revenue − COGS) ÷ Revenue. Reveals true profitability after product cost.
- Average Order Value (AOV): Revenue ÷ Number of transactions. Indicates basket health.
- Comparable Store Sales Growth: Year-over-year sales change for stores open ≥12 months. Removes new-store noise.
- Sell-Through Rate: Units sold ÷ Units received. Measures merchandise effectiveness.
Inventory Efficiency
- Inventory Turnover: COGS ÷ Average inventory. Higher = more efficient capital use.
- Days of Supply: Average inventory ÷ (COGS ÷ 365). Shows how long current stock lasts.
- Stockout Rate: Lost sales due to unavailable items ÷ Total demand. Directly impacts customer satisfaction.
- Shrinkage %: Unaccounted inventory loss ÷ Revenue. Signals theft, damage, or process failure.
Customer Value
- Customer Lifetime Value (CLV): Predicted net profit from entire future relationship. Guides acquisition spend.
- Repeat Purchase Rate: Returning customers ÷ Total customers. Measures loyalty program effectiveness.
- RFM Score: Recency, Frequency, Monetary segmentation. Enables targeted retention and win-back campaigns.
- Net Promoter Score (NPS): Customer willingness to recommend. Leading indicator of loyalty and word-of-mouth.
- Conversion Rate: Transactions ÷ Foot traffic (or site visits). Measures selling effectiveness.
- Sales per Square Foot: Revenue ÷ Selling area. Benchmarks space productivity.
- Staff Productivity: Revenue ÷ Labor hours. Balances service quality against cost.
KPI selection should follow the "so what?" test: if a metric does not trigger a decision or investigation when it moves, remove it from the dashboard.
Challenges in Retail BI Implementation
Addressing these challenges requires treating retail BI as an organizational capability, not just a technology project. Technology enables; people and processes sustain.
How FineBI Supports Retail Business Intelligence
FineBI helps retail teams turn POS, inventory, customer, ecommerce, and supply chain data into interactive dashboards. Store managers can monitor sales and stock movement, merchandising teams can compare product performance, and executives can drill down from overall revenue to region, store, category, and SKU-level performance.
Key capabilities for retail BI include:
- Self-service dashboard builder. Drag-and-drop interface with pre-built retail templates for sales, inventory, customer, and store analytics. No coding required.
- Multi-source connectivity. Native connectors for common retail systems; FineDataLink handles complex ETL pipelines underneath.
- Interactive exploration. Drill-down, filtering, cross-highlighting, and parameter controls let users investigate root causes without returning to IT.
- Scheduled refresh and distribution. Automate data updates and push dashboard snapshots via email or embedded links to keep distributed teams aligned.
- Mobile-native experience. Responsive dashboards render correctly on phones and tablets for store managers and field staff.
- Enterprise-grade security. Row-level permissions ensure store managers see only their locations; regional managers see their territories; executives see consolidated views.
Explore FineBI for retail business intelligence dashboards →
From Retail Dashboards to Dora AI Data Agent
Retail dashboards show what is happening across sales, inventory, stores, and customers. Business users often need the next layer: why a metric changed, which store or category drove the movement, and what action to take before the next review cycle.
Dora helps business users ask follow-up questions, summarize weekly changes, detect unusual KPI movements, and receive role-based briefings based on trusted retail dashboards and business data. Dora operates as an AI analysis layer on top of governed FineBI dashboards—it does not replace them.
Practical applications for retail teams:
- Natural-language Q&A. Ask "Why did West Region same-store sales decline last week?" and receive a narrative summary grounded in actual dashboard data.
- Weekly performance summaries. Automatically generate concise briefings highlighting significant KPI movements across stores, categories, or campaigns.
- Anomaly detection. Surface unusual patterns in sell-through, stockout rates, or conversion that static thresholds may miss, with contextual explanations.
- Role-based briefings. Deliver personalized daily or weekly summaries tailored to each stakeholder's scope—store manager, regional director, or merchandising lead.
Retail dashboards provide visibility. Dora accelerates the path from visibility to understanding and action.
Learn more about Dora →


