Healthcare organizations generate massive volumes of data every day — patient records, billing claims, lab results, staffing schedules, equipment logs. Most of this data sits in separate systems that do not talk to each other. The result is decisions based on incomplete information, delayed reporting, and operational blind spots that affect both patient care and financial performance.
Healthcare business intelligence (BI) solves this problem. It integrates data from clinical, operational, and financial systems into unified dashboards and reports that give administrators, clinicians, and executives a real-time view of what is happening across the organization. When implemented correctly, healthcare BI reduces wait times, improves clinical quality, accelerates revenue cycles, and ensures regulatory compliance.
This guide covers what healthcare BI actually does in practice: which data sources feed it, which use cases deliver measurable value, which KPIs matter most, what dashboards look like, and how to implement BI in a healthcare environment while meeting HIPAA/GDPR requirements. FanRuan's product suite — FineDataLink, FineBI, FineReport, and Dora — is referenced as one practical implementation path, but the frameworks apply regardless of vendor.
What Is Healthcare Business Intelligence?
Healthcare business intelligence is the process of collecting, integrating, analyzing, and visualizing data from healthcare systems to support operational, clinical, and financial decision-making. Unlike generic BI, healthcare BI must handle sensitive patient data, comply with privacy regulations, and serve users with vastly different technical skills — from CFOs reviewing revenue dashboards to nurse managers monitoring patient flow.
Healthcare BI is not a clinical diagnostic tool. It does not replace physician judgment or electronic health record (EHR) clinical workflows. It operates at the operational and management layer: helping healthcare organizations run more efficiently, allocate resources better, control costs, improve patient experience, and meet reporting obligations.
The core components of a healthcare BI system are:
- Data integration from EHR, HIS, LIS/RIS, billing, scheduling, and device systems
- Data governance with role-based access, audit trails, and de-identification
- Analytics and visualization through dashboards, self-service analysis, and scheduled reports
- Distribution to stakeholders via web portals, mobile apps, email subscriptions, and AI-assisted Q&A
Why Healthcare Organizations Need BI
Healthcare faces unique pressures that make BI more than a nice-to-have:
- Rising costs and thin margins. Hospitals operate on average margins below 3%. Without visibility into cost drivers, waste goes undetected until quarterly reviews reveal damage already done.
- Regulatory complexity. HIPAA, GDPR, CMS reporting, Joint Commission standards, and state-level mandates require consistent, auditable data. Manual report compilation introduces errors and delays.
- Patient expectations. Patients compare healthcare experiences to retail and hospitality. Wait times, communication gaps, and billing surprises drive dissatisfaction and churn.
- Staff shortages. Burnout and turnover are chronic. BI helps optimize scheduling, reduce administrative burden, and identify workload imbalances before they cause crises.
- Data silos. Clinical, financial, and operational data live in separate systems. Decisions made from one system's perspective miss cross-functional impacts.
BI addresses these pressures by creating a single source of truth that spans departments. When the CFO, COO, and CMO all work from the same integrated dataset, alignment replaces guesswork.
Healthcare BI Data Sources

Understanding which systems feed healthcare BI is essential for scoping any implementation. Each source contributes distinct analytical value:
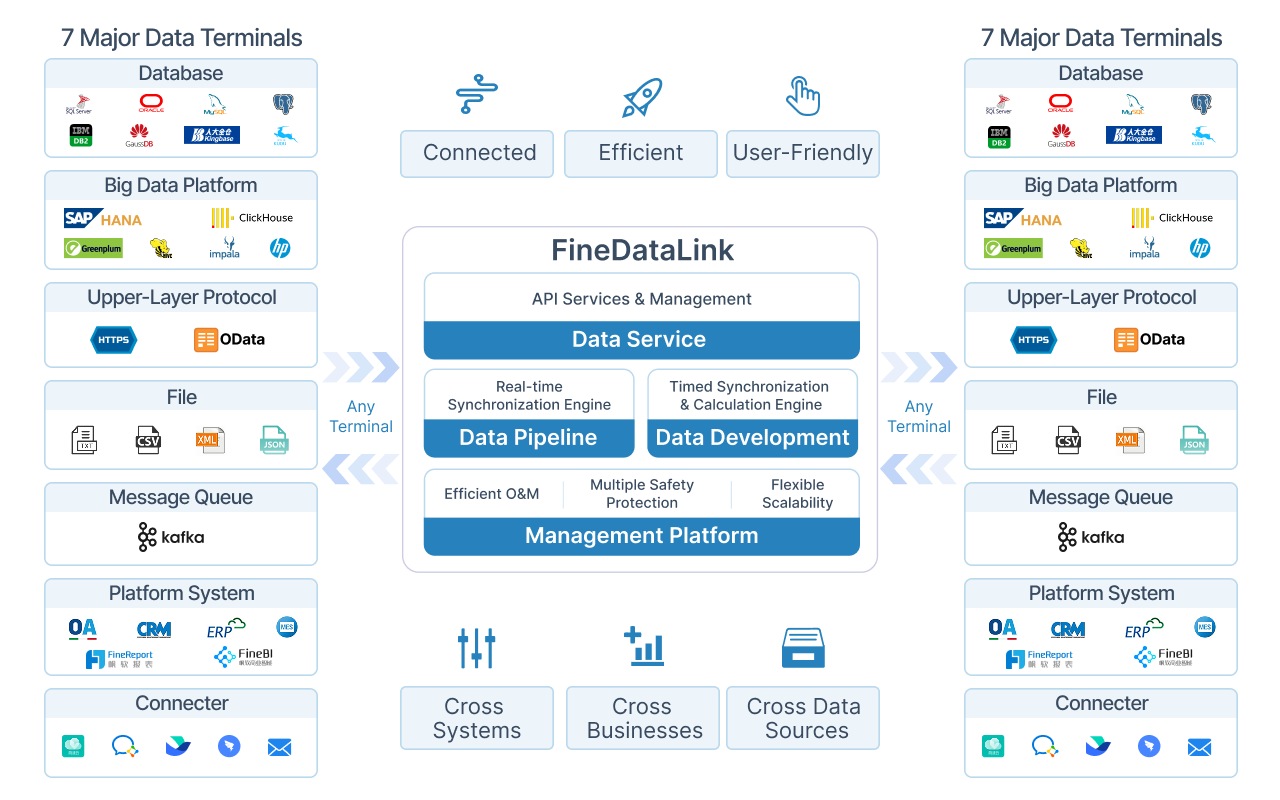
Integration reality: These systems rarely share native connectors. EHR vendors use proprietary APIs. Billing systems export flat files. Device data streams via HL7 or FHIR protocols. A healthcare BI implementation must include a dedicated data integration layer — such as FineDataLink — that connects, normalizes, and synchronizes these sources before analytics can begin.
Healthcare Business Intelligence Use Cases
Healthcare BI delivers value across six primary domains. Each use case maps to specific data sources and measurable outcomes:
Patient Flow Analysis
Track patients from admission through discharge. Identify bottlenecks in ED triage, OR turnover, and discharge processing. Reduce average length of stay (ALOS) without compromising care quality. Dashboards show real-time bed occupancy, pending discharges, and predicted admissions.
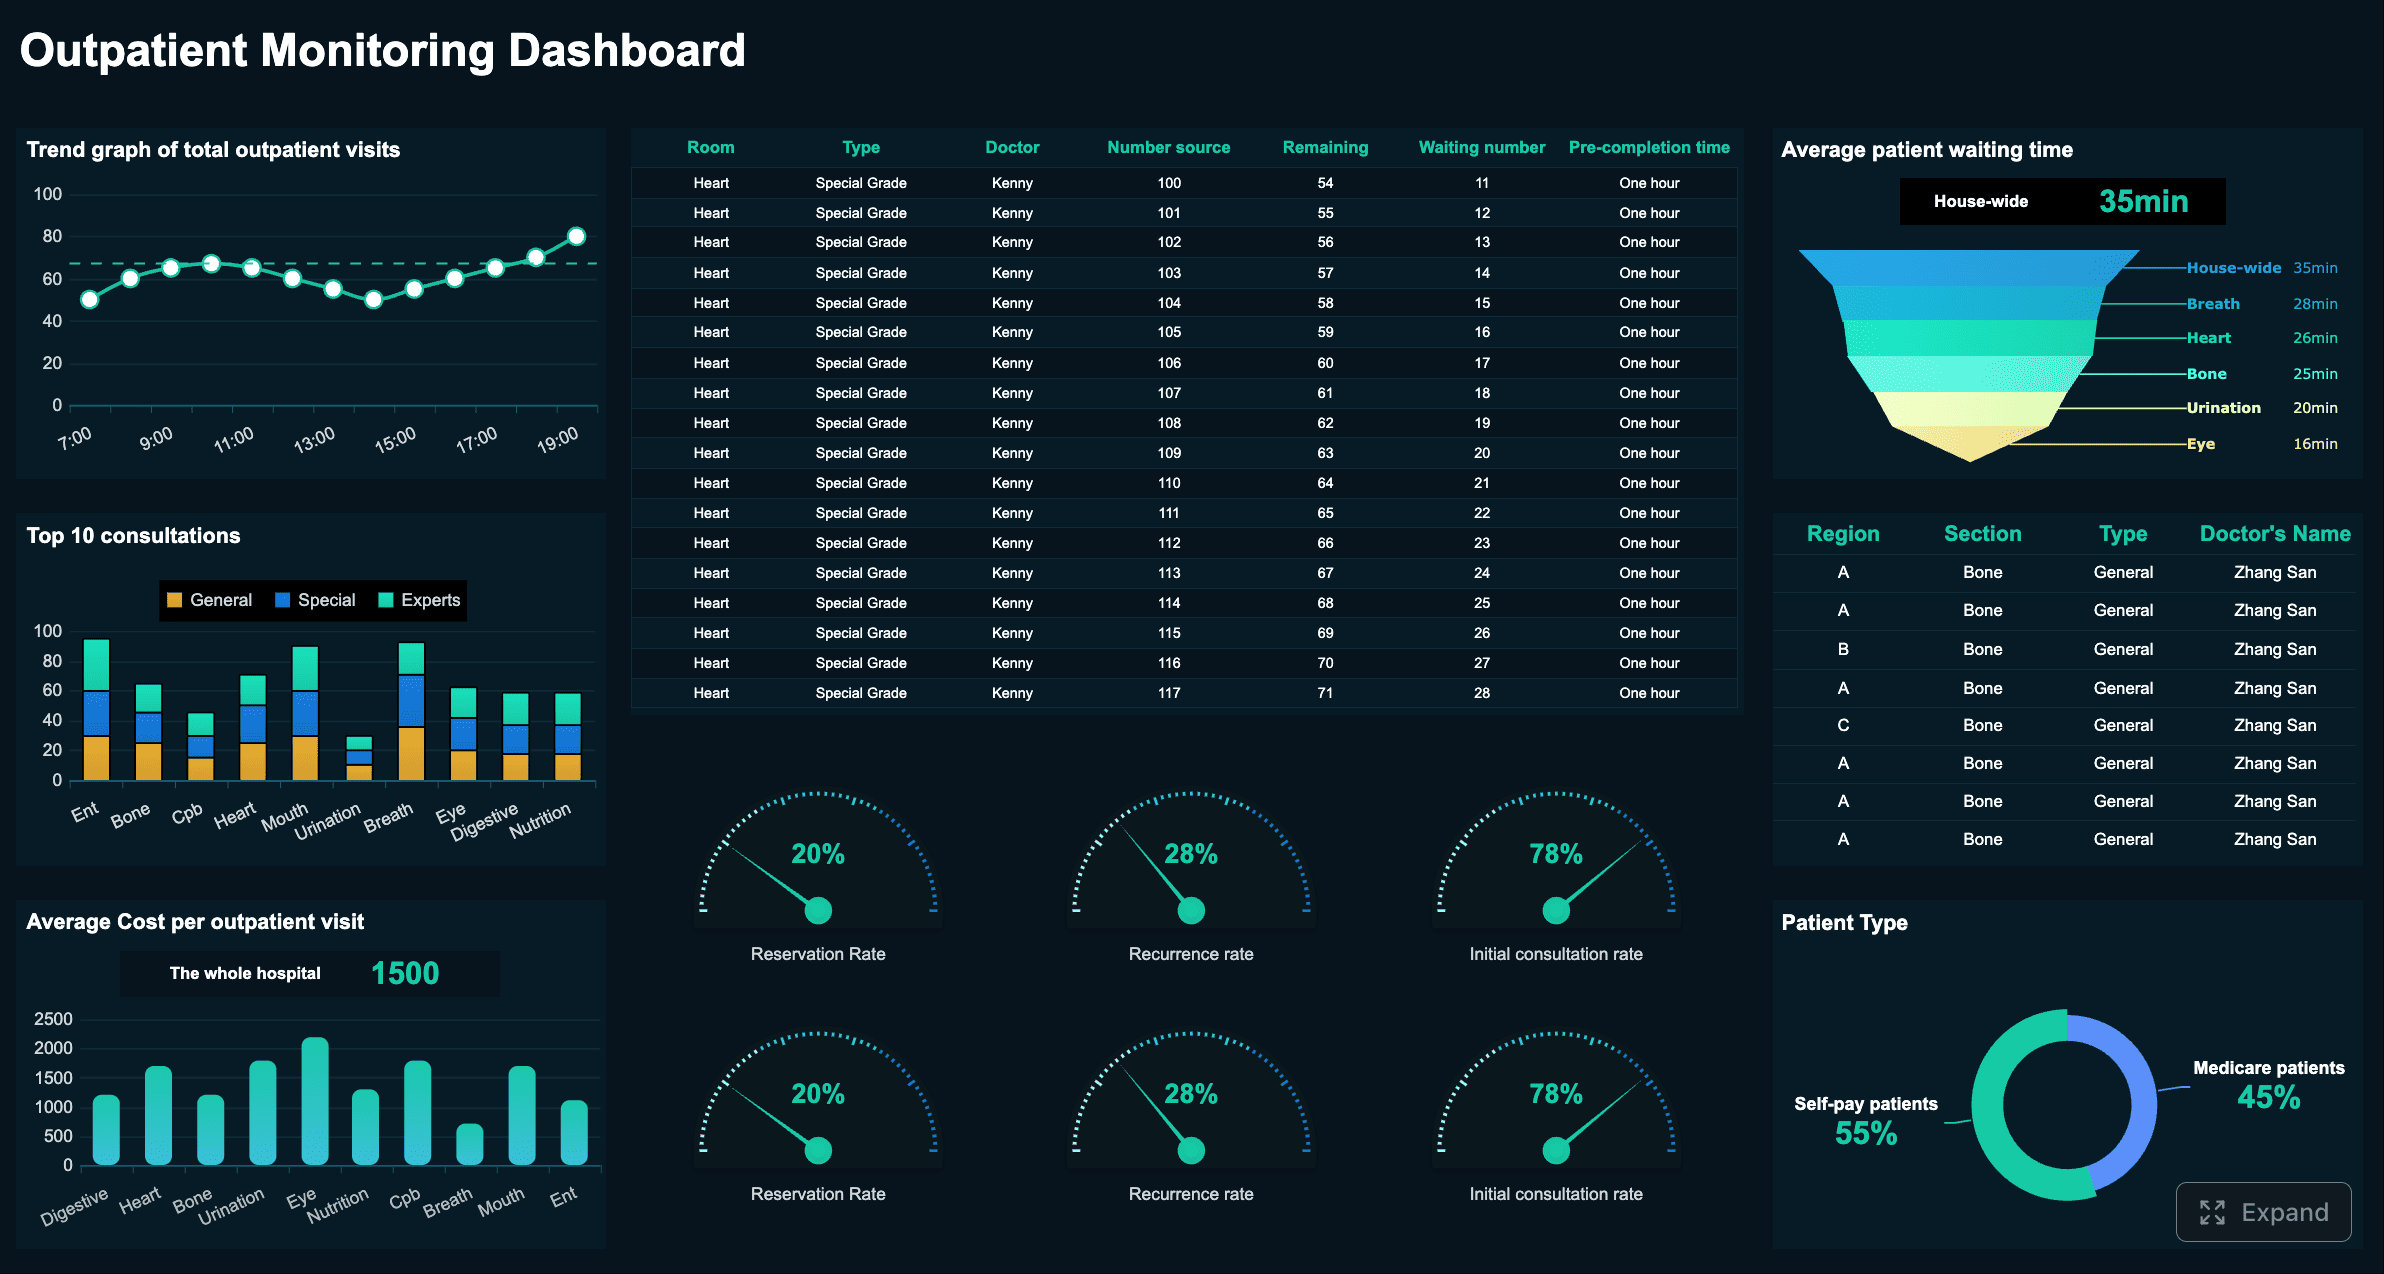
Click to View This Live Dashboard
Clinical Quality Monitoring
Monitor readmission rates, hospital-acquired infection (HAI) rates, medication error rates, and treatment outcome variance. Flag departments or units that deviate from benchmarks. Support quality improvement programs with data rather than anecdote.
Revenue Cycle Management
Track claim submission timelines, denial rates by payer and reason code, days in accounts receivable (A/R), and net collection rate. Identify billing process breakdowns before they become cash flow crises. Compare reimbursement rates across payers to inform contract negotiations.
Resource Planning
Match staffing levels to predicted patient volume. Track equipment utilization rates to justify capital purchases or redistribute underused assets. Monitor department-level workload distribution to prevent burnout hotspots.
Executive Reporting
Provide hospital leadership with a consolidated view of patient volume, service line profitability, operational efficiency, and financial health. Replace monthly PDF packets with interactive dashboards that update automatically.
Compliance Reporting
Generate audit-ready reports for CMS, Joint Commission, HIPAA, and state regulators. Maintain access logs showing who viewed which patient data and when. Ensure reporting consistency across departments and facilities.
KPIs and Metrics of Healthcare BI
KPIs translate raw data into actionable signals. The right KPIs depend on the dashboard's audience and purpose:
KPI design principles for healthcare
- Tie every KPI to a decision. If no one will act differently based on this metric, do not track it.
- Define calculation methodology explicitly. "Readmission rate" means different things to different departments. Document numerator, denominator, time window, and exclusion criteria.
- Set thresholds and alerts. Static numbers get ignored. Color-coded thresholds (green/yellow/red) and automated alerts drive action.
- Benchmark externally when possible. Compare against national averages (e.g., CMS benchmarks, AHA data) to contextualize internal performance.
- Review and retire. KPIs that were relevant last year may not be relevant now. Conduct quarterly KPI reviews with stakeholders.
Healthcare BI Dashboard Examples
Effective healthcare dashboards share three traits: they answer a specific question, they update automatically, and they respect user roles. Here are five practical examples:
1. ED Operations Dashboard
Audience: ED manager, charge nurse. Shows real-time patient count by acuity level, average door-to-provider time, LWBS (left without being seen) rate, and pending consults. Updates every 5 minutes via streaming data from HIS and EHR.
2. Revenue Cycle Dashboard
Audience: Revenue cycle director, CFO. Displays clean claim rate, denial rate by category, A/R aging buckets, and cash-on-hand trend. Includes drill-down from summary to individual claim detail. Refreshes daily from billing system.
3. Clinical Quality Dashboard
Audience: Quality officer, department chairs. Tracks HAI rate, readmission rate, mortality index, and patient safety indicators by unit. Monthly trend lines with benchmark overlays. Data sourced from EHR and quality registry.
4. Staffing and Resource Dashboard
Audience: Nursing supervisor, HR. Shows scheduled vs. actual staffing by shift, overtime hours, agency spend, and patient-to-nurse ratio. Integrates scheduling system with census data from HIS.
5. Executive Scorecard
Audience: CEO, board. Consolidates top-line metrics: total patient volume, net operating margin, patient satisfaction score, quality composite index, and strategic initiative progress. Auto-distributed weekly via FineReport; accessible anytime in FineBI.
Each dashboard should enforce role-based access control: the CFO sees financial detail that nurses cannot; the quality officer sees clinical identifiers that administrators cannot. This is not optional — it is a HIPAA requirement.
Healthcare BI Implementation Checklist
Implementing healthcare BI is a phased process. Skipping steps leads to low adoption and compliance risk.
Critical success factor: Involve clinical and operational stakeholders from Day 1. BI projects led solely by IT produce technically correct dashboards that nobody uses. Projects co-designed with end users produce tools that change behavior.
Challenges: Data Privacy, Integration, and Adoption
Healthcare BI faces challenges that generic BI does not. Addressing them upfront prevents costly rework.
Data Privacy and Regulatory Compliance
Healthcare data is governed by HIPAA (US), GDPR (EU), and local regulations. Every BI implementation must include:
- Role-based access control (RBAC): Users see only data appropriate to their role. Clinicians see patient-level detail; administrators see aggregated views.
- Audit trails: Every query, export, and access event is logged. Logs must be tamper-proof and retained per regulatory requirements.
- De-identification and masking: Patient identifiers are removed or masked in non-clinical dashboards. Re-identification requires explicit authorization.
- Encryption: Data encrypted at rest and in transit. Encryption keys managed separately from data storage.
- Business Associate Agreements (BAAs): Any third-party BI vendor handling PHI must have a signed BAA. Verify this before procurement.
- Data retention policies: Define how long historical data is kept, when it is archived, and when it is destroyed. Align with regulatory minimums and organizational needs.
Data Integration Complexity
Healthcare systems are notoriously fragmented. EHR vendors offer limited APIs. Legacy systems export CSV files. Device data uses proprietary protocols. Integration requires:
- Pre-built connectors for common healthcare systems (EHR, HIS, LIS, billing)
- Support for healthcare data standards (HL7, FHIR, DICOM)
- Incremental sync to avoid full-table reloads on large clinical datasets
- Schema change detection to handle EHR upgrades without pipeline breakage
FineDataLink addresses these challenges with 100+ connectors, CDC-based incremental sync, automatic structure synchronization, and error queue handling for failed loads.
User Adoption Resistance
Healthcare professionals are time-constrained and skeptical of tools that add administrative burden. Common adoption barriers and solutions:
Adoption is not a training problem — it is a trust problem. Trust is built through accuracy, transparency, and demonstrated value.
How FanRuan Supports Healthcare Business Intelligence
FanRuan provides a complete product stack for healthcare BI, covering data integration, self-service analytics, formatted reporting, and AI-assisted analysis:
How they work together in healthcare
1. FineDataLink integrates data from EHR, HIS, billing, scheduling, and device systems into a unified data layer, applying de-identification and quality rules during sync.
2. FineBI turns integrated data into interactive dashboards for patient flow, clinical quality, revenue cycle, and resource management — with role-based access enforced at the row and column level.
3. FineReport generates formatted reports for regulatory submissions, board meetings, and departmental reviews — scheduled and distributed automatically.
4. Dora enables operations and management teams to ask follow-up questions about dashboard data, receive summarized insights, and get alerted to unusual KPI movements — all within governed data boundaries.
This stack is designed for healthcare's specific constraints: sensitive data handling, multi-role access, regulatory reporting, and non-technical user accessibility.
From Healthcare BI Dashboards to Dora AI Data Agent
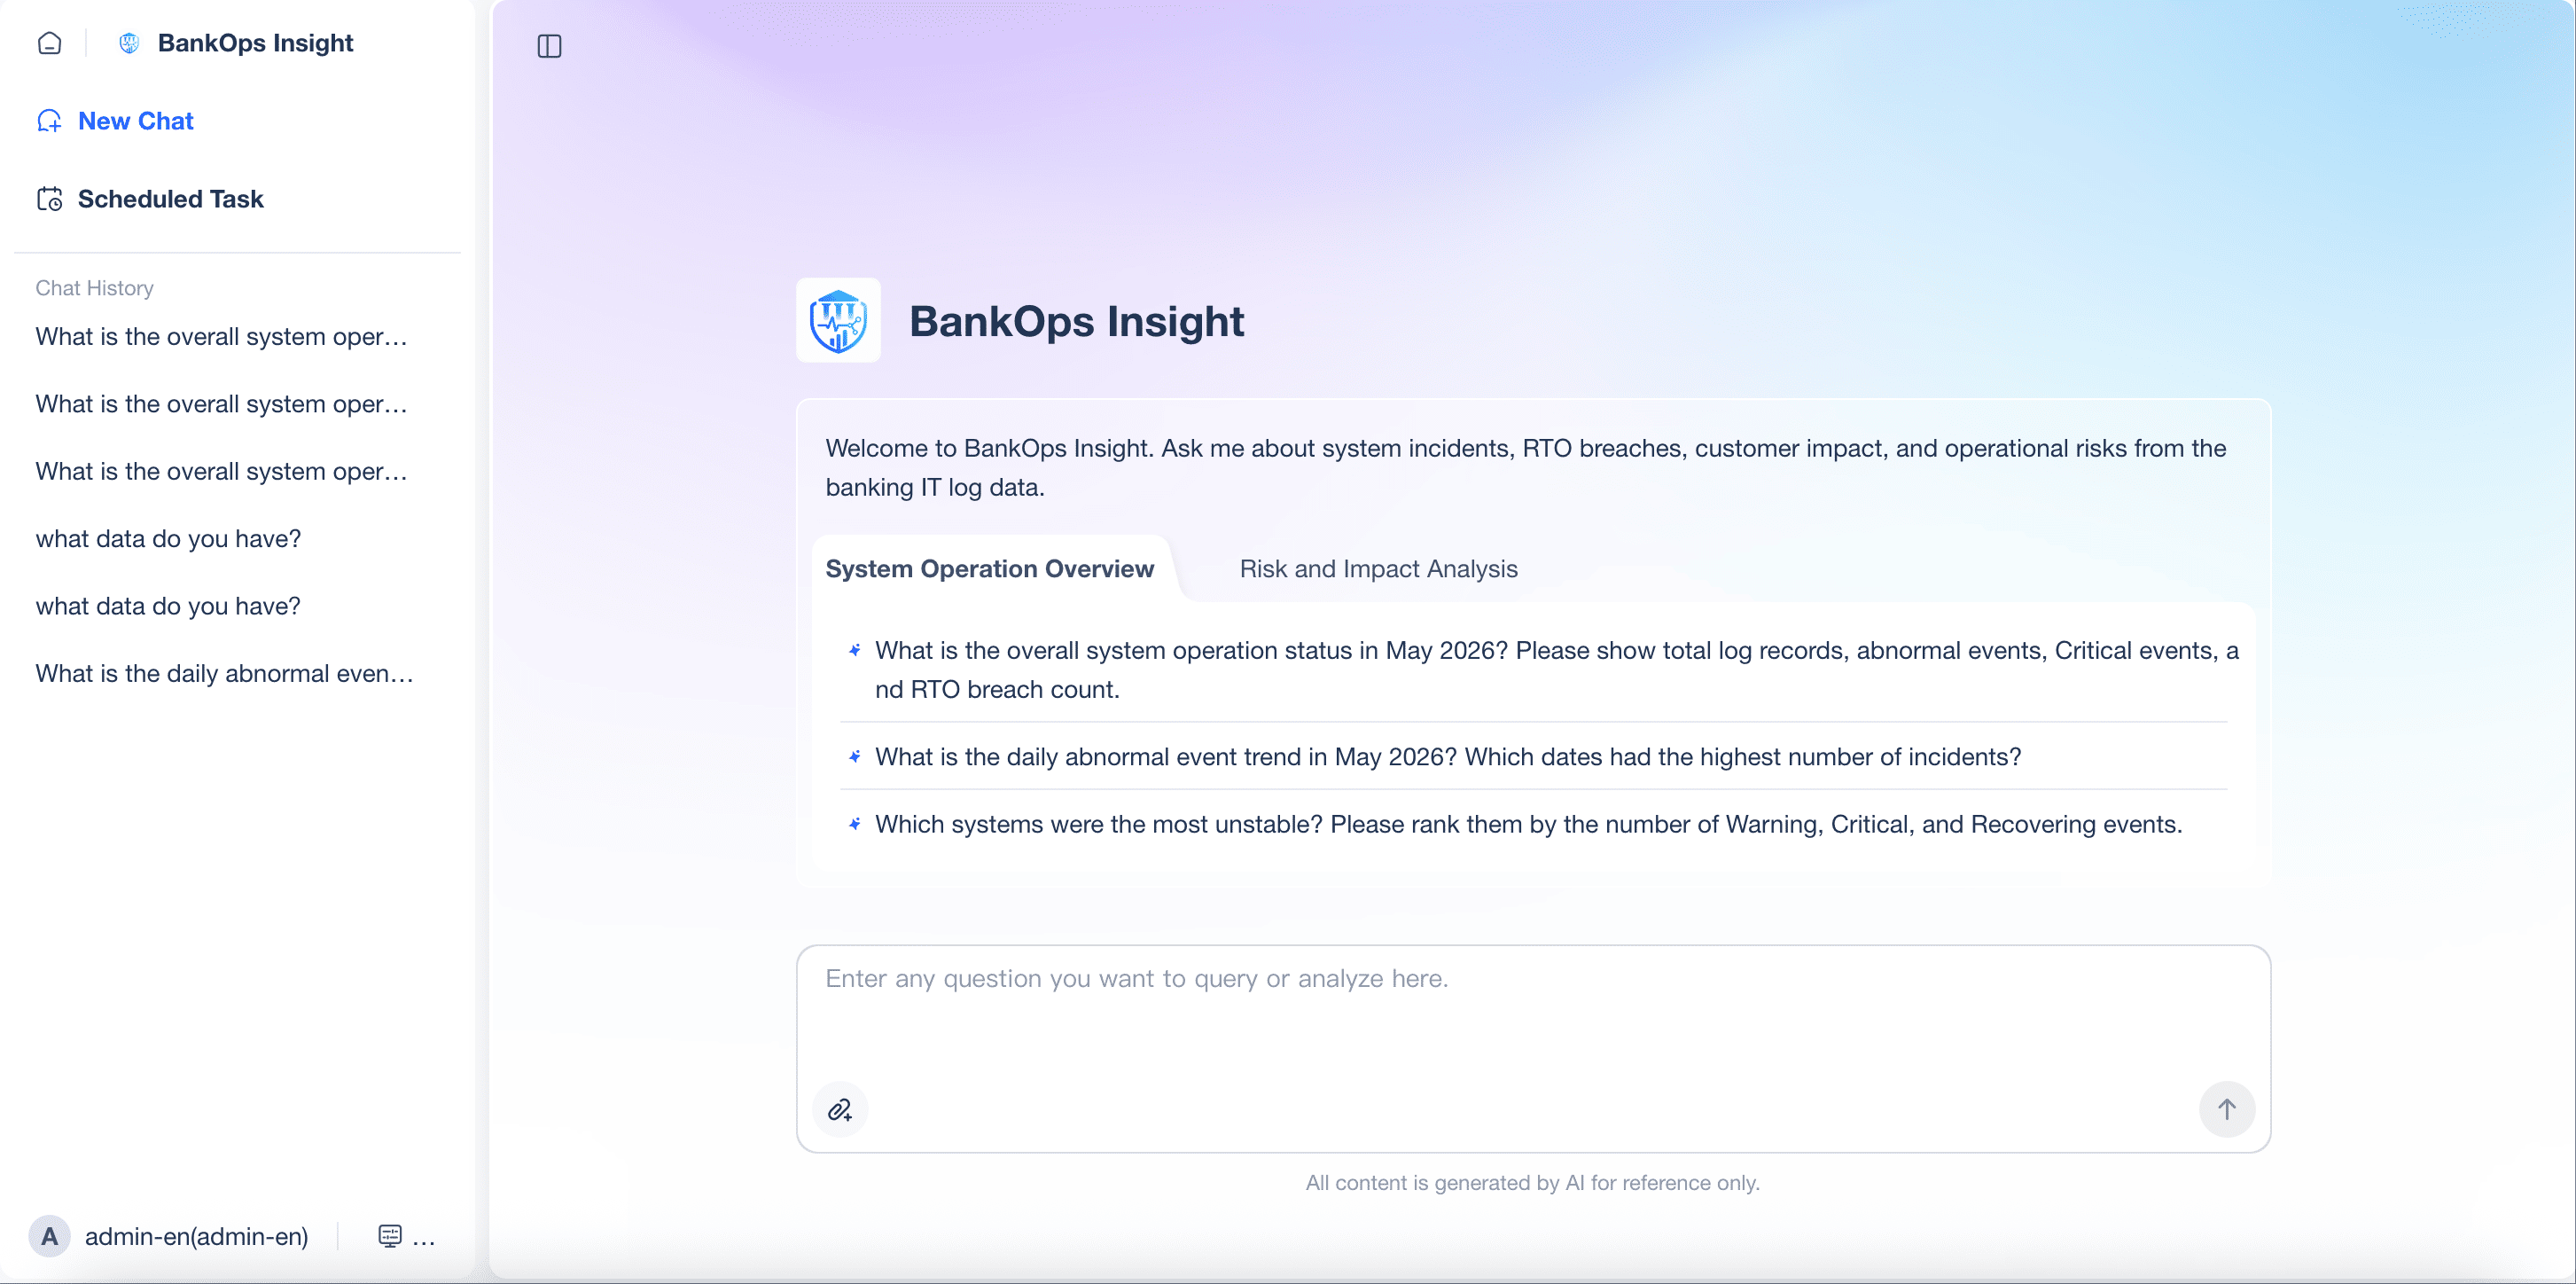
Healthcare BI dashboards show what is happening across patient care, operations, and finance. Dora helps healthcare and operations teams ask follow-up questions, summarize changes, detect unusual KPI movements, and receive scheduled briefings based on trusted dashboards, reports, and governed data assets.
Practical applications of Dora in healthcare operations (not clinical diagnosis):
- Operational Q&A: "What was our average ED wait time last week compared to the prior month?" answered instantly from governed dashboard data.
- Trend summarization: Weekly executive briefing auto-generated from key dashboards, highlighting notable changes and anomalies.
- Anomaly detection: Alert when claim denial rate exceeds threshold or bed occupancy drops unexpectedly, with context on potential causes.
- Scheduled briefings: Daily or weekly summaries delivered to department heads, replacing manual report compilation.
- Follow-up analysis: After viewing a revenue cycle dashboard, ask "Which payer has the highest denial rate this quarter?" without building a new report.
Important boundary: Dora operates on operational and management data, not clinical decision-making. It summarizes trends, explains KPI movements, and answers operational questions. Clinical diagnosis, treatment recommendations, and patient care decisions remain the responsibility of licensed healthcare professionals.
When healthcare BI dashboards are well-designed and governed, Dora extends their reach to users who need insights but lack the time or skill to navigate complex dashboards manually.


