A table in data management organizes information into rows and columns, making it easier for you to view and work with your data. When you understand the different types of tables, you can choose the right structure for your needs. For example, some tables handle static data, while others, like PivotTables, support advanced analysis and help you extract insights from large datasets. This knowledge lets you manage data more efficiently, adapt to changing requirements, and improve your workflow. Tools such as FineReportfurther enhance your ability to organize and analyze data across various scenarios.
Types of Tables: What are Tables?
Table structure
When you work with tables in data management, you use a powerful tool for organizing information. In data management software, especially relational databases, a table is a structure that arranges data into rows and columns. Each row holds a record, such as a customer or product, while each column represents a field like an address or account number. This structure helps you store and retrieve data efficiently.
Here are the key components that define a table in database systems:
Component
Description
Columns
Fields or attributes that hold specific types of information in a vertical arrangement.
Rows
Also known as tuples or records, representing data for a specific entity in a horizontal format.
Column Names
Unique identifiers for each column, indicating the type of data stored.
Data Items
Specific values stored in the intersection of rows and columns.
Data Types
Defines the kind of data each column can store, ensuring data integrity.
Primary Key
A unique identifier for each row, ensuring no duplicates exist.
Foreign Key
A reference to a primary key in another table, establishing relationships between tables.
You can see that the structure of tables in data management provides clarity and consistency. This makes it easier for you to manage large amounts of data and maintain accuracy.
Table functions
Tables in data management serve several important functions. You use tables to store, organize, and analyze data. When you enter new information, the table structure ensures that each piece of data goes into the correct place. You can sort, filter, and search for specific records quickly.
Tables also help you link related data. For example, you might connect customer records to orders using keys. This relationship allows you to track business activities and generate reports. You can use tables to summarize data, calculate totals, and identify trends.
Tip: When you design tables in data management, focus on clear structure and logical organization. This approach helps you avoid errors and makes your data easier to use.
Tables in data management support many tasks, from simple record keeping to complex analysis. You rely on tables to keep your data organized and accessible, which is essential for making informed decisions.
Understanding thetypes of tablesin data management helps you organize, store, and analyze data more effectively. Each table type serves a unique purpose in databases and reporting systems. You will see how these tables work in real-world scenarios and how tools like FineReport support their creation and management.
Data tables
Data tables form the foundation of most databases. You use a data table to store information in rows and columns. Each row represents a record, and each column holds a specific attribute. For example, a customer data table might include columns for customer ID, name, and email address. You can quickly add, update, or delete records in a data table.
Type of Data Table
Description
Basic Data Table
A fundamental structure consisting of rows and columns, used to record information.
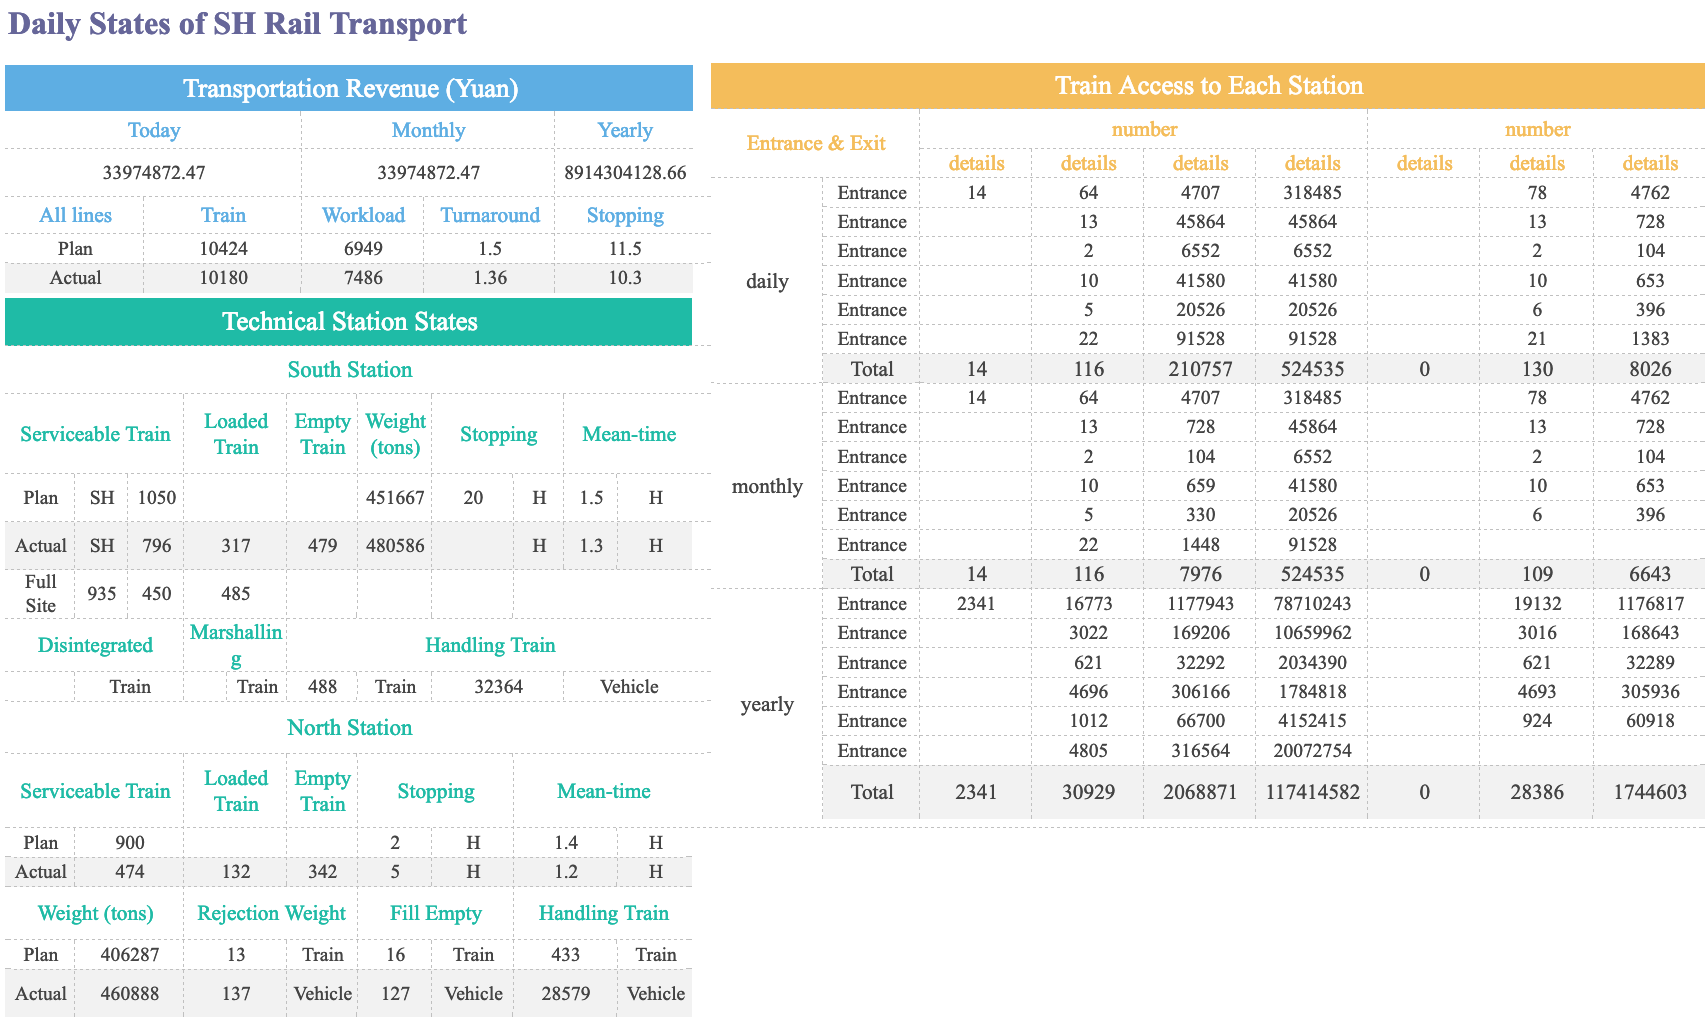
Cross-Tab Report
Groups and organizes data in a summarized way for better intelligibility in business intelligence.
E-commerce Sales Report
Displays product name, category, monthly sales figures, and revenue for performance tracking.
Customer Feedback Survey
Compiles survey results to analyze customer satisfaction and identify areas for improvement.
You often use data tables to track sales, inventory, or employee records. In data management, these tables help you maintain accurate and accessible information. FineReportsupports data tables by allowing you to connect to multiple databases, import Excel files, and design reports with multiple sheets. You can also use parameter queries to filter and analyze data efficiently.
Relational tables
Relational tables are a key part of relational databases. You organize data into tables that represent entities, such as customers or orders. Each table contains rows and columns, and you use primary and foreign keys to define relationships between tables. This structure supports normalization, which reduces data redundancy and improves integrity.
You store data in separate tables for each entity.
You use SQL to manage and retrieve information.
You join tables using keys to analyze data across different entities.
For example, an airline database might have a "travelers" table with traveler IDs and names, and a "passports" table with passport IDs and traveler IDs. You can join these tables to find which traveler holds a specific passport.
Table Name
Attributes
travelers
traveler_id, name
passports
passport_id, traveler_id, ...
Relational databases rely on relational tables to ensure data consistency. FineReportconnects to various relational databases, including MySQL, Oracle, and SQL Server. You can design reports that pull data from multiple relational tables, visualize relationships between tables, and perform advanced SQL queries for data analysis.
Decision tables help you manage complex business rules in a clear and structured way. You use a decision table to list all possible conditions and actions, making it easier to evaluate scenarios and make consistent decisions. Each row represents a rule, while columns define conditions and outcomes.
Feature/Benefit
Description
Structure
Decision tables simplify complex business logic into a digestible format.
Evaluation
They help evaluate and execute complex decisions consistently.
Clarity
Decision rules are defined precisely, allowing for efficient analysis of various scenarios.
Completeness
By listing all possible combinations of conditions, they ensure no scenarios are missed.
Flexibility
As business needs change, decision tables can be easily modified by adding rows or columns.
Communication
They provide a shared framework that reduces miscommunication between IT and business teams.
Efficiency
Decision tables break down complex decisions into smaller sub-decisions for structured decision-making.
You might use a decision table to automate loan approvals or insurance claims. FineReportenhances decision tables by supporting interactive effects, parameter passing, and component linkage. You can click on data points to update related charts or tables, making your decision processes more dynamic and transparent.
HTML tables
HTML tables display tabular data on web pages. You use HTML tags to define the structure:
Element
Purpose
<table>
Starts the table
<tr>
Defines a row
<th>
Used for headers
<td>
Used for data cells
You often use HTML tables to present data in a browser, such as product lists or schedules. In data management, HTML tables help you share information online in a structured format. FineReportgenerates reports in HTML format, allowing you to embed tables in web applications or dashboards. You can customize the appearance and make your data accessible on any device.
Pivot tables
Pivot tables give you a powerful way to analyze data. You can summarize large datasets, reorganize information, and spot trends or outliers. A pivot table lets you transform rows and columns to view your data from different perspectives. For example, you can create a sales report that shows totals by region and product.
Summarizes large amounts of data
Transforms unorganized datasets into structured tables
Helps identify patterns, trends, and insights
Pivot tables are essential for data analysis in business intelligence. You use them to generate insightful reports and make informed decisions. FineReport supports pivot tables through cross-tab reports and dynamic templates. You can drag and drop fields, group data, and apply hierarchical formulas to analyze data quickly and accurately.
Note: Choosing the right types of tables in data management ensures you can store, organize, and analyze data efficiently. FineReportprovides robust support for all these table types, helping you build flexible and insightful reports.
FineReport'sMultiple Built-in Templates For Report
When you start creating and managing tables in data management, you lay the foundation for organized data storage and efficient data processing. In most database management systems, you follow a clear process to set up a new table. First, you create a new data table and give it a name that reflects its contents, such as "Customers" or "Orders." Next, you add fields to define the type of data each column will hold. You can also import tables from CSV files, which helps you move existing data into your database quickly.
Here is a typical process for creating a table in data management software:
Create a new data table and assign a descriptive name.
Add fields for each data attribute, such as "Name," "Email," or "Order Date."
Adjust settings, like icons or field types, to match your needs.
Import data from external files if needed, specifying headers and column names.
You may face challenges during table creation, such as ensuring mobile users can view data without scrolling or managing tables without advanced technical skills. Fixed column sizes and accessibility can also affect how you display and use your data.
Managing tables in FineReport
FineReport streamlines creating and managing tables in data management by offering user-friendly tools and intelligent features. You can use the Template Detection Assistant, which guides you through template creation and helps you avoid performance issues. FineReport also detects potential problems and suggests optimizations, making your experience smoother.
Feature
Benefit
Template Detection Assistant
Guides you during template creation for better performance.
Performance Issue Detection
Identifies issues and helps you improve your templates.
Optimization Suggestions
Recommends ways to enhance your table creation process.
For ongoing management, FineReportsupports dynamic data tables. You can query tables in your dataset dynamically, filter data based on changing conditions, and define datasets with parameters for customized queries. This flexibility helps you adapt to evolving data analysis and reporting needs.
Aspect
Description
Dynamic Data Tables
Query tables dynamically for flexible data management.
Dynamic Conditions
Filter data using various conditions for adaptable queries.
Implementation Method
Define datasets with parameters for customized data processing.
Data entry and integration
Efficient data entry and integration are essential for organized data storage and effective data processing. FineReport provides robust data entry forms that simplify collecting and updating information. You can design forms for tasks like employee onboarding or customer records, ensuring accurate and consistent data input.
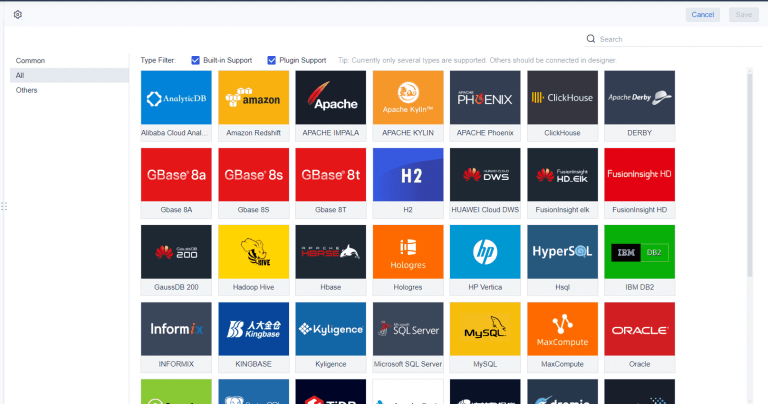
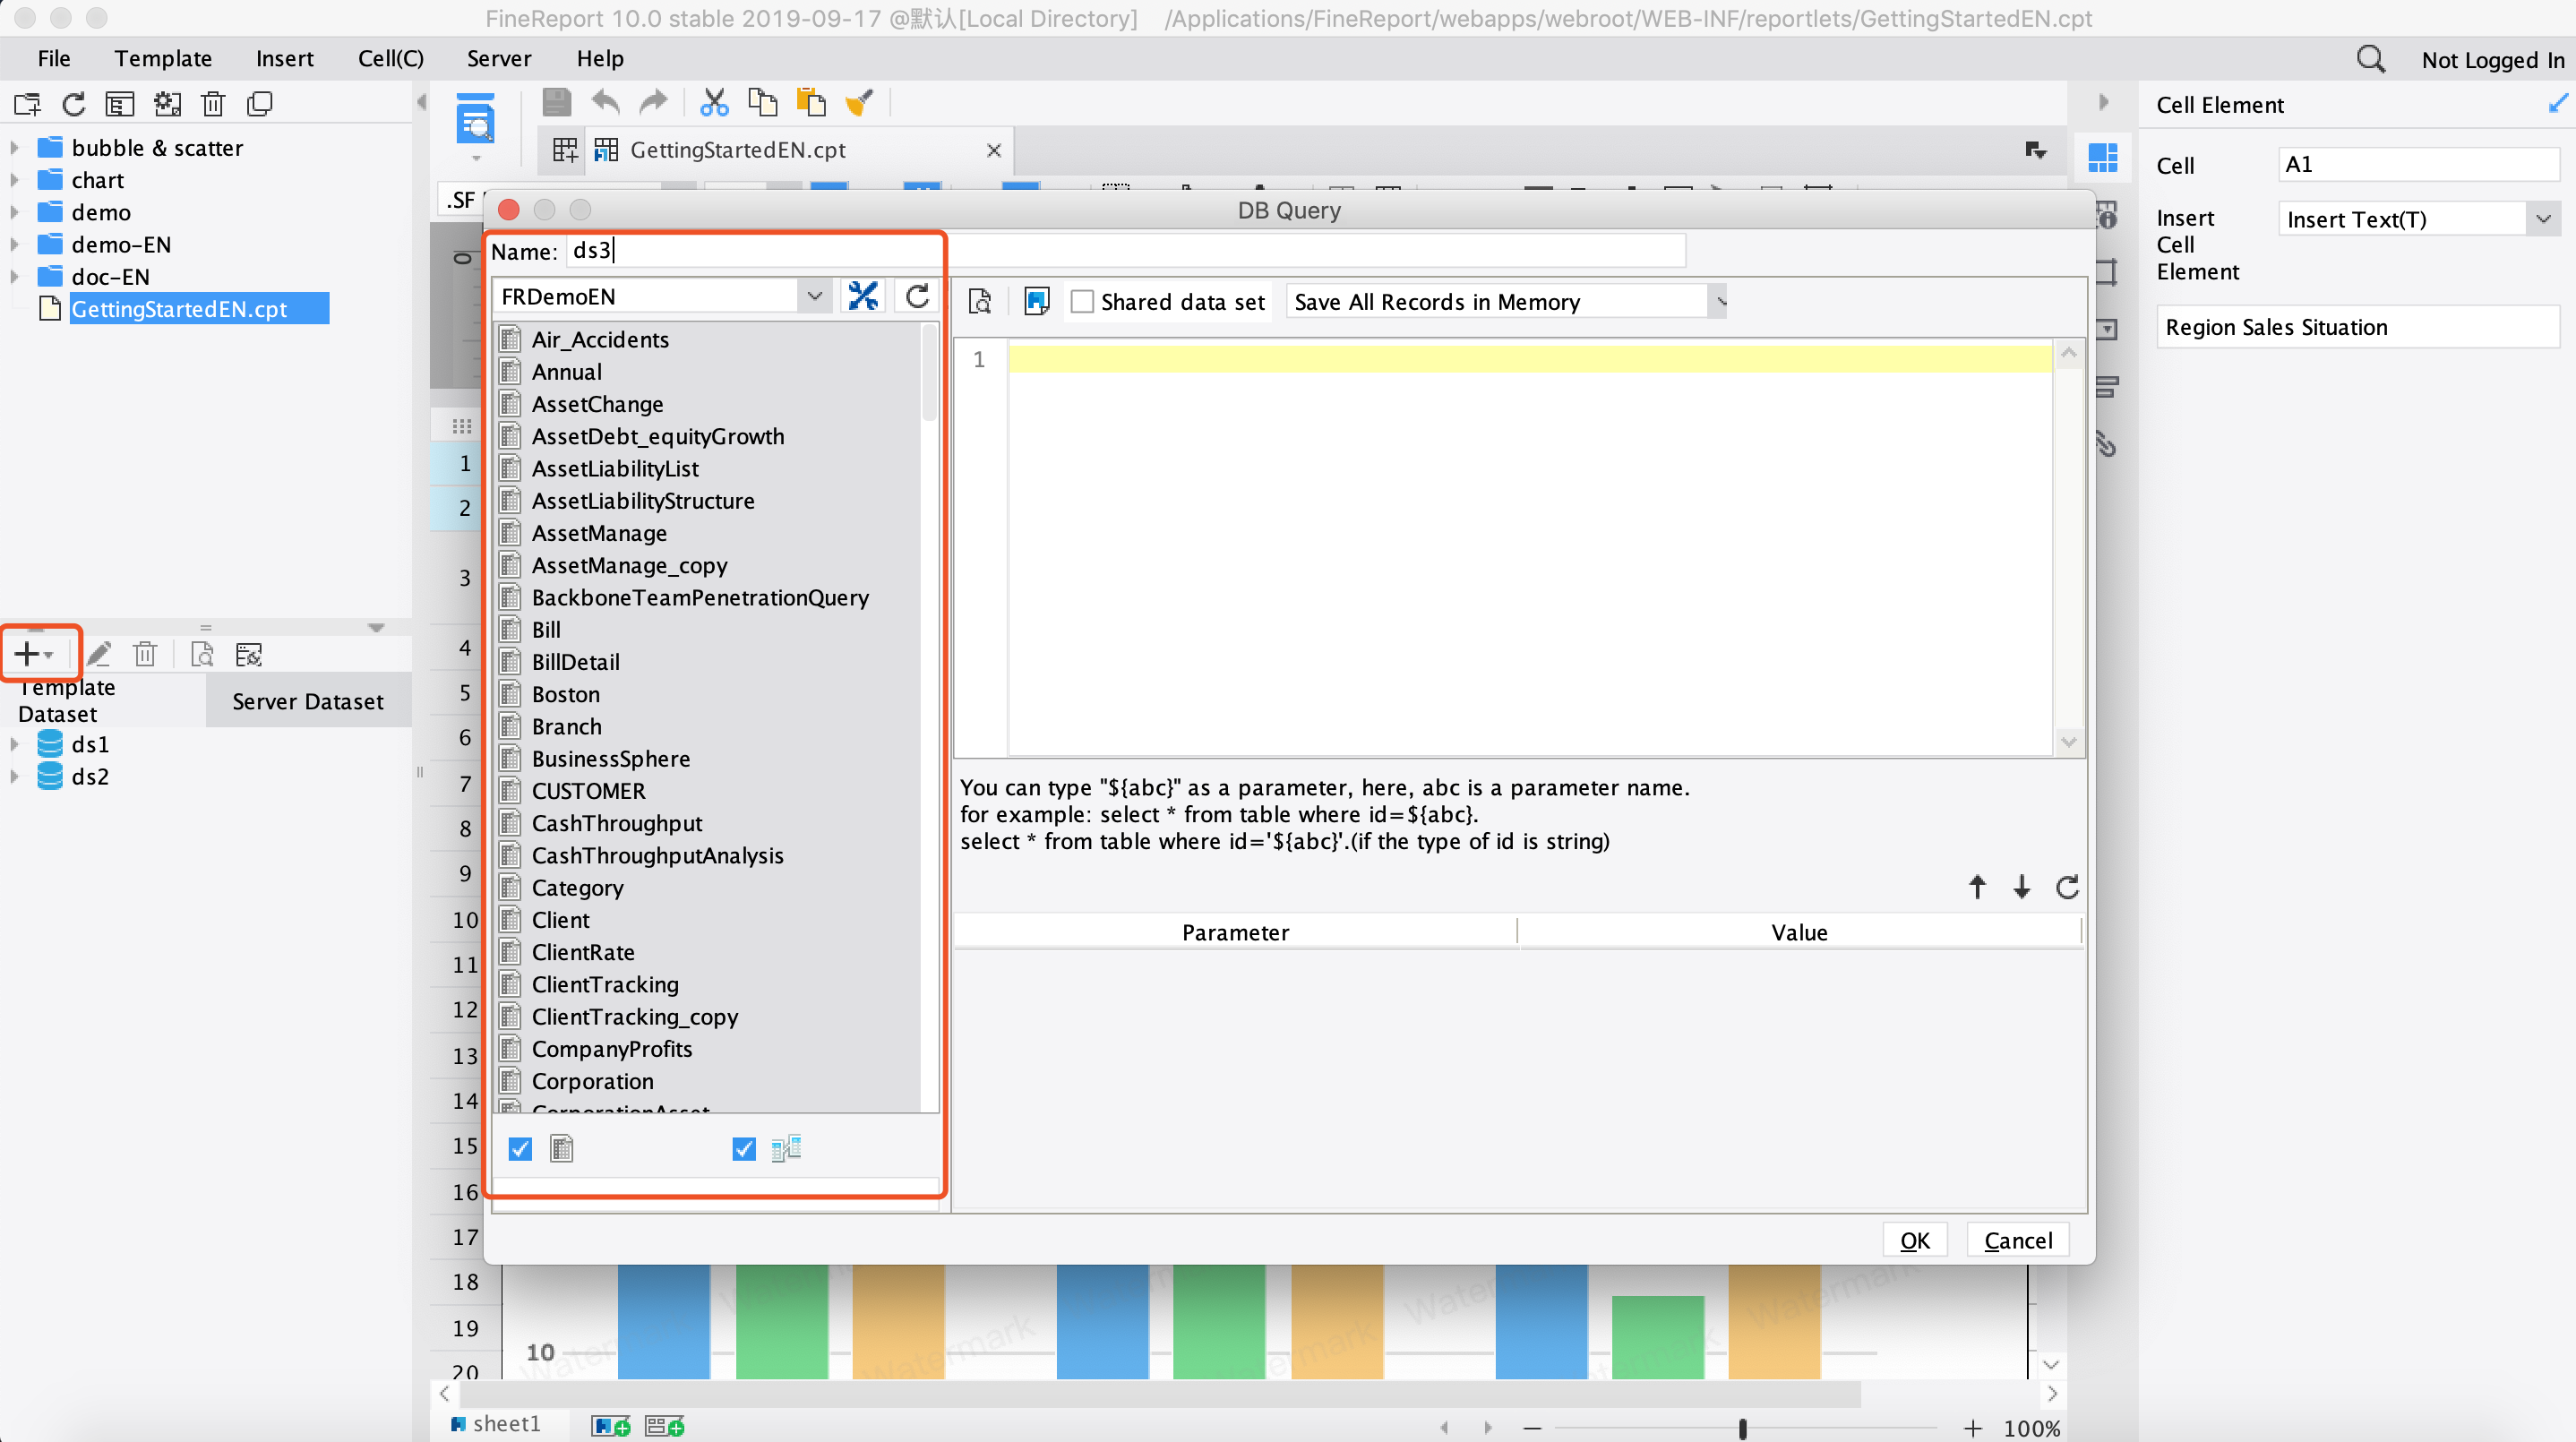
FineReport excels in multi-source integration. You can connect to multiple databases and file types, making it easy to combine data from different sources. The platform offers visual SQL building, syntax prompts, and auto-completion for field names. You can also use FineReportformulas within SQL queries and generate parameter filtering statements visually. These features support seamless data integration and enhance your ability to manage complex data environments.
Feature
Description
SQL Simplification
Simplifies SQL entry and integrates queries with editing tools.
Visual SQL Building
Supports visual query creation and parameter filtering.
Syntax Prompt and Auto-completion
Enhances user experience with field name suggestions.
Support for FineReport Formulas
Allows formulas within SQL queries for advanced data analysis.
Parameter Filtering
Generates filtering statements visually for multi-source data integration.
By mastering creating and managing tables in data management, you ensure your database remains organized and ready for advanced data analysis and reporting. FineReportempowers you to handle these tasks efficiently, supporting both traditional database management systems and modern dbms platforms.
You interact with tables in data management to drive business decisions and improve operational efficiency. Business users rely on tables to track sales, monitor inventory, and manage customer records. Decision tables present rules in an intuitive format, making it easy for you to review and update business logic without programming skills. This approach enhances collaboration between departments and reduces misunderstandings. You benefit from comprehensive documentation and simplified updates, which help you adapt quickly to changing business needs.
Benefit
Explanation
Accessible to nontechnical stakeholders
Decision tables present rules in an intuitive format, enabling business users to review and modify rules without programming skills.
Enhanced collaboration
They foster better communication between technical teams and business stakeholders by providing a shared understanding of logic.
Reduced cognitive load
The layout simplifies complex rules into manageable components, aiding in error identification.
Comprehensive documentation
Decision tables serve as self-documenting tools, laying out conditions, rules, and outcomes clearly.
Easy updates
They allow for straightforward adjustments to logic as business needs change, without extensive redevelopment.
Avoiding misunderstandings
The tabular format minimizes misinterpretation, making decision processes transparent for all stakeholders.
You use tables in data managementto ensure that your data remains organized and accessible for reporting and analysis.
IT and data teams
IT professionals and data analysts play a crucial role in managing tables in data management. You plan, maintain, and optimize database systems to support business operations. Your tasks include database administration, data warehousing, and analytics functions. You store business logic and prepare data for consumption in centralized locations. You create interactive dashboards and charts to visualize data and support decision-making.
Task
Description
Database Administration
Involves planning, maintaining, and managing databases, often under traditional IT roles.
Data Warehousing
Focuses on storing business logic and preparing data for consumption in a centralized location.
Analytics Functions
Utilizes data from warehouses to create interactive charts and dashboards for reporting.
You ensure that tables in data management remain secure, scalable, and efficient for all users.
Everyday users
You use tables in data management for daily tasks such as organizing schedules, tracking expenses, or comparing information. Everyday users benefit from static data tables for viewing information and interactive tables for sorting and filtering. Flat data tables help you make quick comparisons, while hierarchical tables allow you to explore parent-child relationships in your data.
Static data tables: Designed for viewing only, no editing allowed.
Interactive data tables: Allow sorting, filtering, and inline editing.
Flat data tables: Each row stands alone, ideal for quick comparisons.
Hierarchical data tables: Show parent-child relationships, often with expandable rows.
You rely on tables in data management to keep your information clear and accessible, whether you work in a business environment or manage personal data.
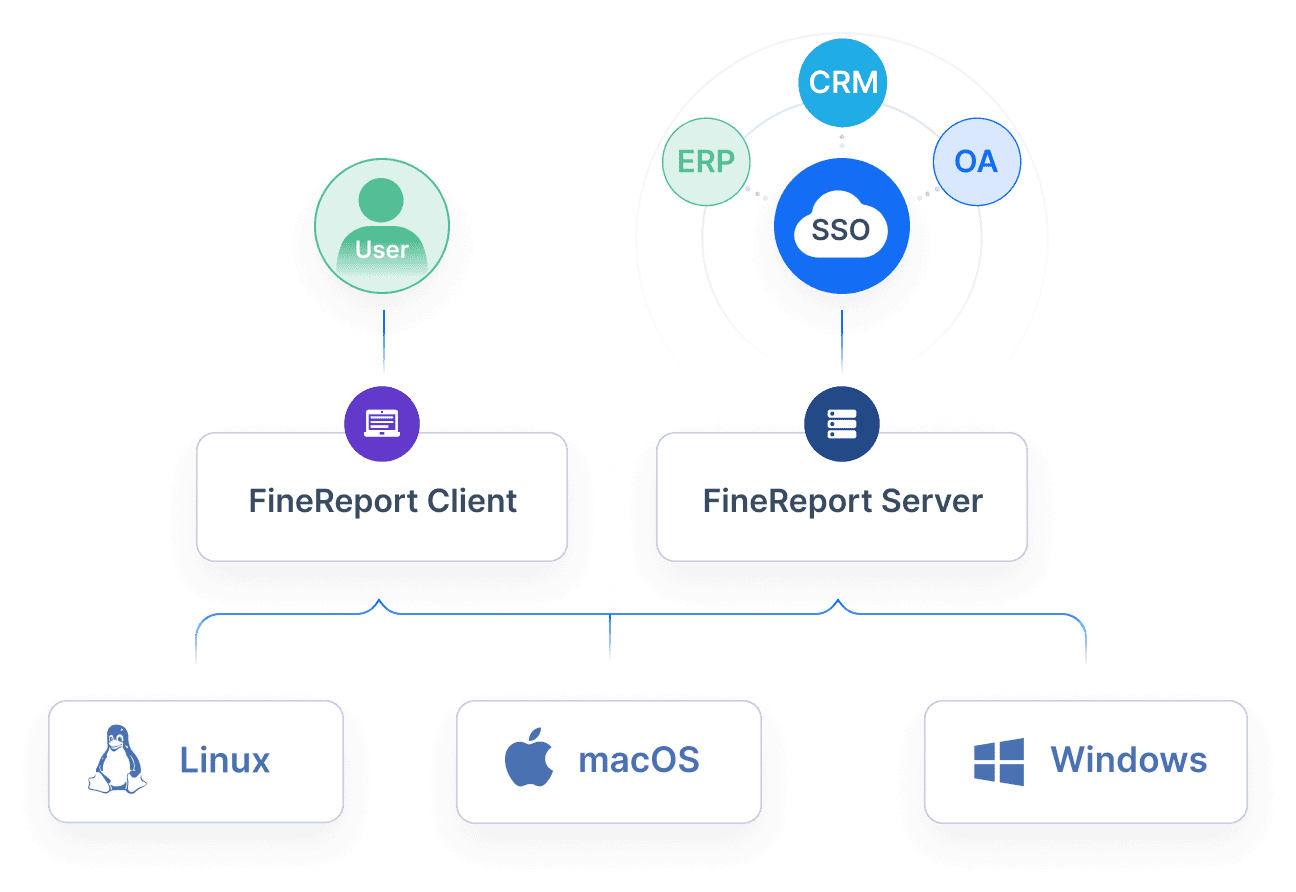
FineReportsupports all types of users with flexible reporting and dashboard tools. You can create custom reports, visualize data from multiple sources, and access dashboards on any device. FineReport’s intuitive design helps you manage tables in data management efficiently, whether you are a business user, IT professional, or everyday user.
Understanding different table types and mastering table management empowers you to make smarter, data-driven decisions. When you choose the right tools, you unlock new ways to organize, analyze, and present information. FineReport helps you achieve measurable benefits:
You communicate financial insights clearly to a wider audience.
You enhance presentation and user engagement.
You tell better stories through data.
You understand patterns and trends easily.
You drive productivity and decision-making efficiency.
Explore FineReportto create, manage, and visualize tables that fit your business needs.
Real-time insights to optimize production, logistics, and decisions.
FAQ
What are tables in data management used for?
Tables in data management help you organize, store, and analyze information. You use them to keep records, track changes, and support decision-making. Tables make it easy to sort, filter, and retrieve data for business or personal use.
How do tables in data management improve data accuracy?
Tables in data management use structured rows and columns. You enter data in specific fields, which reduces errors. You can set rules for data types and use validation to ensure each entry meets your standards.
Can you connect tables in data management to different data sources?
You can link tables in data management to many data sources, such as databases, spreadsheets, and cloud services. This connection lets you combine information from multiple places and analyze it together.
What is the difference between static and dynamic tables in data management?
Static tables in data management show fixed information. You cannot change the data easily. Dynamic tables let you update, filter, and sort data in real time. You use dynamic tables for interactive analysis and reporting.
How does FineReport support tables in data management?
FineReport helps you create, manage, and visualize tables in data management. You can design reports, connect to various data sources, and use dashboards for analysis. FineReport makes it easy to handle complex data tasks.