Sustainability reporting becomes difficult the moment ESG data leaves a few spreadsheets and turns into a board-level, regulator-facing, investor-scrutinized process. Enterprise teams need more than raw metrics—they need a controlled, repeatable system that can collect data across entities, standardize methodologies, document ownership, and produce disclosure-ready outputs with evidence behind every number. A sustainability reporting dashboard solves that operational problem by turning fragmented ESG inputs into a single, auditable workflow for reporting, review, and publication.
Click To Try The Dashboard
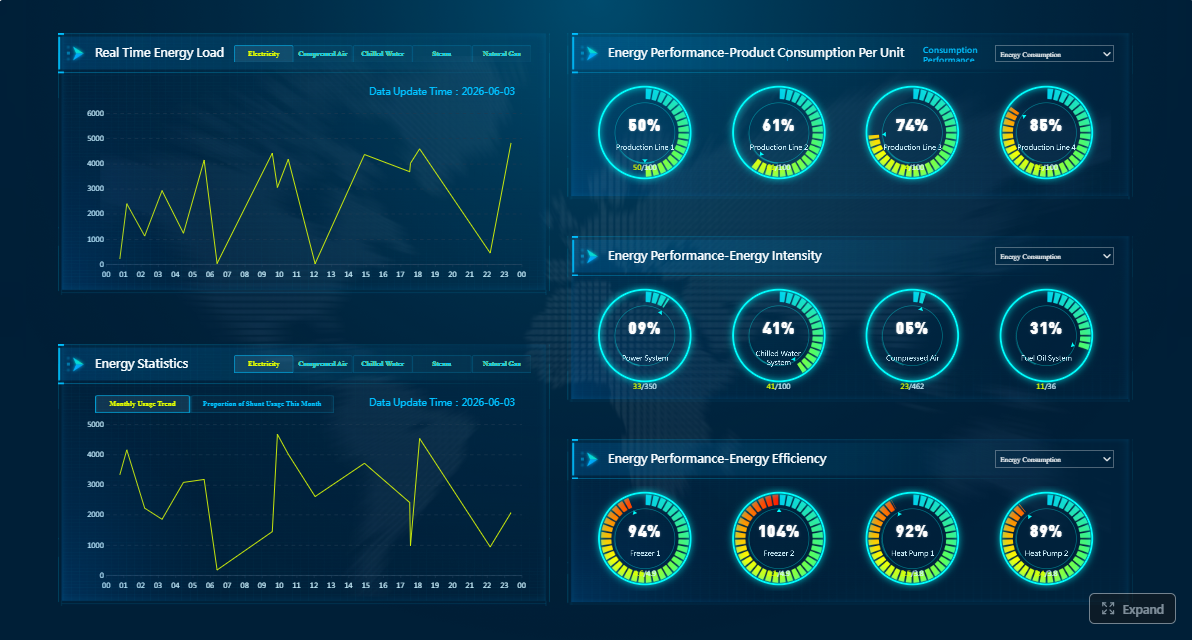
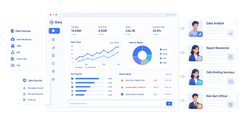
All reports in this article are built with FineReport
Sustainability reporting dashboards: what they do and why enterprise teams rely on them
A sustainability reporting dashboard is the operational command center for ESG disclosure. It brings together environmental, social, and governance data from internal systems, suppliers, finance records, spreadsheets, and manual submissions into one structured reporting environment. Instead of asking teams to chase files, validate numbers by email, and reconcile versions at quarter-end or year-end, the dashboard centralizes the process.
For enterprise organizations, that centralization matters because sustainability reporting now touches multiple functions at once. Finance wants reconciliation and consolidation discipline. Sustainability teams need framework alignment and data completeness. Legal wants reviewable language and documented claims. Internal audit and assurance teams need evidence, timestamps, and approval records. A well-designed dashboard connects these groups around a single source of truth.
There is also an important distinction between tracking ESG data and managing disclosures. Raw tracking tells you what was reported by a site, business unit, or supplier. Disclosure management tells you whether the data is complete, approved, supported, aligned to reporting boundaries, and ready for publication. That is the difference between a data repository and a sustainability reporting system executives can trust.
Key Metrics (KPIs) enterprise dashboards should include
Scope 1 Emissions: Direct greenhouse gas emissions from owned or controlled operations.
Scope 2 Emissions: Indirect emissions from purchased electricity, steam, heating, or cooling.
Scope 3 Emissions: Value chain emissions across upstream and downstream activities.
Energy Consumption: Total energy use by source, site, business unit, or geography.
Renewable Energy Share: Percentage of total energy sourced from renewables.
Water Withdrawal and Discharge: Water usage and release metrics by facility or region.
Waste Generated and Diverted: Total waste volume plus recycling, reuse, or landfill split.
Workforce Headcount: Total employees segmented by region, contract type, or business unit.
Health and Safety Incidents: Recordable incidents, lost-time rates, and severity trends.
Diversity Representation: Workforce and leadership composition across defined categories.
Training Hours: Learning and compliance training completed by employees.
Supplier ESG Coverage: Percentage of suppliers assessed, onboarded, or reporting required data.
Policy Compliance Status: Adoption and attestation levels for governance and ethics policies.
Data Completion Rate: Share of required ESG data points submitted on time.
Approval Cycle Time: Time required for review, escalation, and final sign-off.
Exception Rate: Number or percentage of records flagged for missing values, anomalies, or failed validation.
Evidence Attachment Rate: Percentage of reported disclosures backed by supporting files or references.
Version History Depth: Number of revisions logged for each disclosure item.
Assurance Readiness Score: Internal measure of whether data, controls, and evidence meet review standards.
What audit-ready disclosures require from data, controls, and governance
Audit-ready sustainability reporting is not just about having figures available. It requires data quality, process discipline, and governance structures that hold up under internal review, external assurance, and regulatory scrutiny.
Core data requirements for credible reporting
Credible sustainability reporting depends on data that is complete, traceable, and time-stamped. Enterprise teams typically need to collect information across emissions, energy, labor practices, safety, diversity, governance, and supplier-related metrics. Each data point should be connected to a source, a reporting period, a methodology, and a responsible owner.
Without this foundation, reported ESG numbers quickly become vulnerable. If a reviewer cannot determine where a figure came from, which version is final, who approved it, or whether the reporting boundary changed mid-cycle, disclosure risk rises sharply. That is why leading organizations build dashboards with metadata, evidence links, submission dates, and business rules from the start.
Version control is equally important. Sustainability reporting often involves late adjustments, scope changes, estimation updates, and narrative rewrites. A dashboard should preserve historical versions, show who made changes, and flag whether updated values affect previously approved disclosures. This protects both reporting integrity and management confidence.
Clear ownership also matters. Every material metric should have a named owner responsible for submission, review, and explanation. Shared accountability sounds collaborative, but in practice it often leads to delayed data, unapproved estimates, and unclear escalation paths.
Internal controls that reduce reporting risk
Strong controls convert sustainability reporting from a best-effort exercise into a governed enterprise process. At minimum, enterprise teams should implement:
Structured review workflows to ensure initial submissions are validated before entering draft disclosures.
Approval chains that reflect organizational accountability across local teams, functional owners, and executives.
Exception handling rules that identify outliers, missing fields, duplicate records, or methodology deviations.
Evidence retention practices that preserve invoices, meter logs, calculation files, supplier attestations, and policy documents.
Role-based access controls so only authorized users can submit, edit, approve, or publish data.
These controls do more than reduce errors. They strengthen assurance readiness, improve board reporting, and support confidence from regulators, investors, and other external stakeholders. If finance-grade controls are absent, sustainability reporting tends to remain fragile, manual, and difficult to defend.
How enterprise teams turn ESG data into a disclosure workflow
The most effective sustainability reporting programs do not start with the report. They start with the reporting architecture: obligations, boundaries, owners, controls, and timelines. Once those are defined, the dashboard becomes the workflow engine that moves data toward disclosure.
Mapping data sources to reporting obligations
Enterprise teams usually work with a mix of ERP systems, EHS platforms, HR systems, utility records, procurement tools, supplier surveys, spreadsheets, and finance consolidation files. The first step is mapping those sources to actual disclosure requirements.
That means asking:
Which frameworks or standards apply?
Which entities are in scope?
Which topics are material?
Which metrics require primary data versus estimates?
Where are the highest-risk gaps today?
The dashboard should then connect each required disclosure item to its source system, owner, collection method, validation rule, and evidence requirement. This is the only practical way to avoid last-minute scrambling when disclosure deadlines approach.
Before drafting begins, teams must also define reporting boundaries. Global organizations often struggle here. Operational control may differ from financial control. Supplier data may sit outside direct ownership. Acquisitions and divestitures may affect comparability. A dashboard should make these boundary definitions visible and consistent, not buried in offline memos.
Building a repeatable reporting process
A repeatable sustainability reporting process usually follows a structured sequence:
Define scope and obligations
Confirm reporting frameworks, legal entities, material topics, reporting boundaries, and disclosure calendar.
Collect source data
Pull data from systems, manual forms, supplier inputs, and finance records into standardized templates or connectors.
Validate and reconcile
Run checks for completeness, anomalies, duplicates, unit consistency, and alignment with prior periods or financial data.
Assign ownership and resolve exceptions
Route flagged records to responsible teams for correction, explanation, or approval.
Draft disclosures and narratives
Convert validated numbers into decision-ready tables, charts, commentary, and methodology language.
Complete executive and legal review
Review metrics, claims, assumptions, and wording before sign-off.
Publish and archive
Release the report and preserve all supporting data, evidence, and version history for future assurance or regulatory review.
Cross-functional collaboration is what keeps this process on schedule. Sustainability teams cannot do it alone. Finance provides consolidation discipline. Operations supplies primary activity data. HR owns people metrics. Legal reviews disclosure language. Procurement helps close supplier data gaps. Internal audit or risk teams help test controls before publication.
Using external expertise when internal capacity is limited
Not every enterprise has the internal bandwidth to build a mature sustainability reporting process quickly. External specialists can add value when organizations need help with:
Change management across regions or business units
The key is to use outside support to strengthen internal capability, not to create long-term dependency. The dashboard and workflow should remain owned by the enterprise, even if advisors help design the system.
Frameworks, finance alignment, and disclosure expectations to watch
Sustainability reporting is shaped by a moving mix of frameworks, standards, assurance expectations, and market demands. Dashboards should be designed with that reality in mind.
Major frameworks and standards shaping enterprise reporting
Most enterprise sustainability reporting programs are influenced by a combination of global and regional frameworks. Common examples include:
GRI for broad impact-focused sustainability disclosures
SASB-based concepts for industry-specific financially material topics
TCFD-aligned structures for climate governance, risk, strategy, and metrics
ISSB-style requirements for investor-oriented sustainability disclosure
ESRS and CSRD-related expectations for more prescriptive, structured reporting in applicable jurisdictions
Some frameworks are more principle-based, allowing companies flexibility in how they explain impacts and material topics. Others are more prescriptive, requiring clearly defined disclosures, data structures, and process rigor. Dashboard design should reflect the level of specificity required. If your obligations are becoming more structured, your data model and workflow must become more structured too.
Sustainability reporting increasingly depends on finance-grade processes. That does not mean finance owns every ESG metric. It means the reporting system needs the same discipline finance teams already use for consolidation, close cycles, controls, adjustments, approvals, and evidence retention.
When sustainability reporting follows financial reporting calendars, governance improves. Teams know when data is due, when reviews happen, how exceptions are escalated, and what constitutes final sign-off. This also improves comparability across periods and reduces the risk of last-minute disclosure changes.
Finance teams are particularly valuable in:
Entity consolidation
Period close discipline
Control design
Audit trail requirements
Materiality governance
Reconciliation between sustainability and financial disclosures
The closer sustainability reporting gets to enterprise reporting norms, the more reliable and defensible it becomes.
Tracking market and standard-setting developments
Disclosure expectations are still evolving. Enterprise teams should monitor updates that may affect data structures, reporting scope, or collection methods. This includes:
New or revised reporting standards
Jurisdiction-specific implementation guidance
Assurance expectations
Platform and taxonomy updates
Investor pressure on comparability and consistency
Anti-greenwashing scrutiny on unsupported claims
Dashboards should be configurable enough to adapt without forcing a full rebuild every time reporting requirements change.
Benefits, common challenges, and mistakes to avoid
Done well, sustainability reporting creates value far beyond compliance. Done poorly, it creates rework, credibility risk, and executive frustration.
Business value beyond compliance
A strong sustainability reporting dashboard improves enterprise performance in several ways:
Better investor communication through clearer, more consistent disclosures
Higher internal accountability because owners, deadlines, and approvals are visible
Faster reporting cycles by reducing manual collection and reconciliation work
Improved target tracking through period-over-period performance visibility
Stronger strategic planning because leadership can see where risks, gaps, and opportunities are emerging
It also improves confidence in published numbers. That matters when external stakeholders compare statements over time or challenge whether claims are supported by underlying evidence.
Common implementation challenges
Even well-resourced organizations face recurring challenges in sustainability reporting:
Fragmented source systems across business units and regions
Inconsistent methodologies for emissions, labor, or supplier metrics
Weak ownership at the metric or entity level
Manual spreadsheet dependence
Changing disclosure expectations
Incomplete supplier data
Limited granularity for entity-level reporting
Poor documentation of assumptions and estimates
Global enterprises often struggle most with local variation. Sites may report in different units, use different definitions, or follow different submission timelines. Without a dashboard that standardizes rules and surfaces exceptions, these differences create major downstream reporting risk.
Avoiding overstatement and weak claims
One of the biggest risks in sustainability reporting is saying more than the evidence supports. Unsupported claims, inconsistent narratives, or poorly evidenced metrics can damage trust quickly. This is especially dangerous when sustainability language is reviewed separately from underlying data.
Enterprise teams should avoid:
Publishing ambitious claims without measurable support
Reusing narrative language that no longer matches current data
Mixing methodologies across reporting periods without explanation
Hiding estimation uncertainty
Treating incomplete supplier data as complete coverage
Presenting isolated outputs as proven impact
The better approach is disciplined transparency. Report what is verified, explain methodologies clearly, acknowledge limitations, and show progress without overstating certainty.
How to choose the right dashboard approach for your organization
Selecting the right sustainability reporting dashboard is less about visual appeal and more about operational fit. The tool must support your disclosure process, not just display ESG charts.
Practical criteria for evaluating tools
When assessing options, focus on the capabilities that make sustainability reporting scalable and audit-ready:
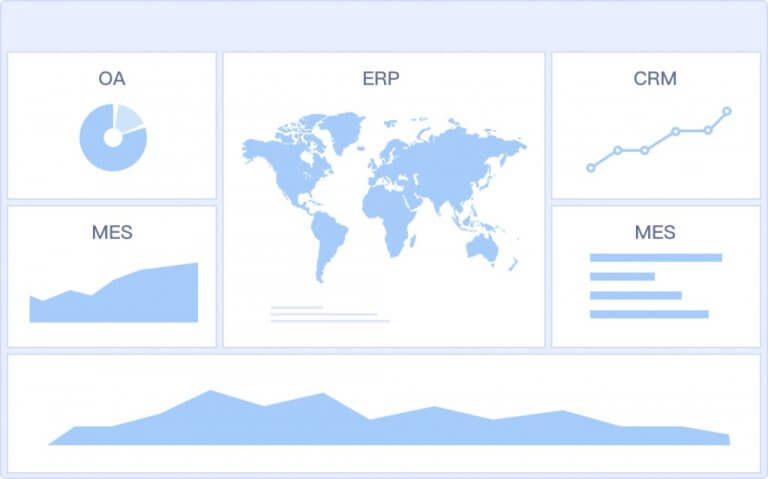
Integration depth: Can it connect to ERP, HR, EHS, procurement, and spreadsheet-based inputs?
Workflow support: Does it manage review, approval, escalation, and sign-off?
Framework coverage: Can it align metrics and narratives to multiple reporting requirements?
Audit trail quality: Does it preserve version history, timestamps, user actions, and evidence?
Data modeling flexibility: Can it handle entity hierarchies, reporting boundaries, and methodology changes?
Validation controls: Can it enforce rules for completeness, consistency, and exception detection?
Security and access control: Can it separate submitter, reviewer, approver, and publisher roles?
Template readiness: Does it accelerate dashboard creation and disclosure output?
Scalability: Can it support global reporting with local data ownership?
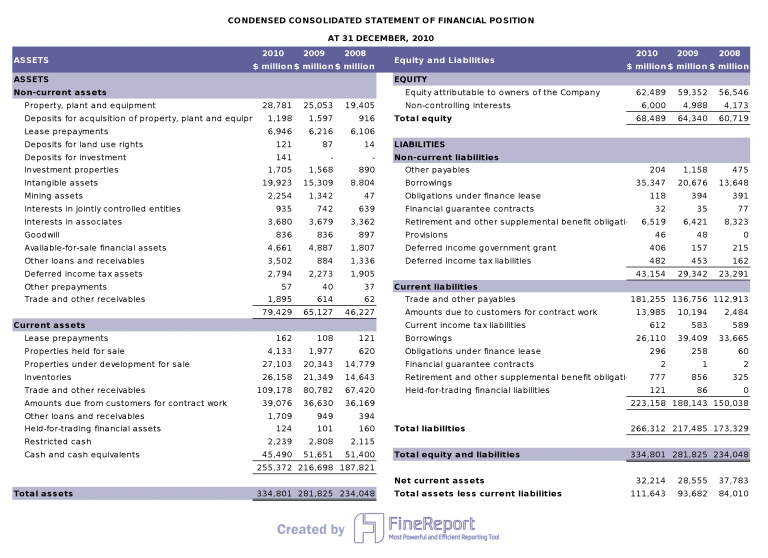
Publication support: Can it help transform validated data into final reporting outputs?
Questions to ask before rollout
Before implementation, leadership should answer a few critical questions:
Who owns the end-to-end sustainability reporting process?
Which disclosures matter most in the next 12 to 24 months?
Where is the highest current data risk?
Which metrics require the strongest evidence chain?
What systems contain the most reliable source data?
How much of the process is still manual today?
Which stakeholders need workflow visibility?
How will the organization handle methodology changes and restatements?
These answers determine whether the dashboard should start as a reporting accelerator, a controls platform, or a broader disclosure management solution.
A simple roadmap from manual reporting to an audit-ready system
A practical roadmap usually looks like this:
Assess the current state
Inventory data sources, owners, frameworks, pain points, and high-risk disclosures.
Prioritize the reporting scope
Focus first on the most material metrics and the biggest control gaps.
Standardize definitions and ownership
Create shared metric logic, boundary rules, and accountability by entity and function.
Implement workflow and validation controls
Replace email-based reviews and uncontrolled spreadsheets with governed processes.
Automate dashboards and disclosure outputs
Build repeatable views for management, assurance readiness, and publication support.
Expand over time
Add supplier data, more entities, more frameworks, and stronger assurance support as maturity grows.
Build sustainability reporting the scalable way with FineReport
Building this manually is complex; use FineReport to utilize ready-made templates and automate this entire workflow. For enterprise teams, that means turning disconnected ESG spreadsheets, source systems, and review chains into a governed sustainability reporting process with dashboards, permissions, audit trails, and role-based workflows.
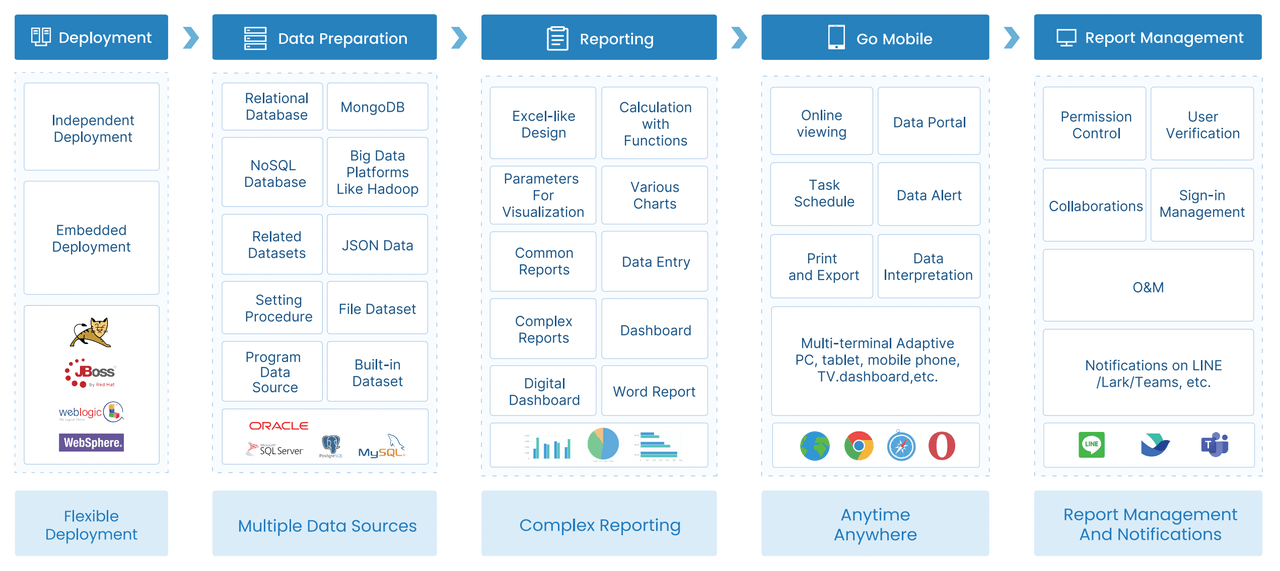
FineReport is especially well-suited for organizations that need to combine data integration, dashboard design, workflow control, and enterprise-scale reporting in one environment. Instead of building a custom reporting layer from scratch, teams can accelerate deployment using configurable templates, connect multiple data sources, and create disclosure-focused dashboards that support both internal management and external reporting.
After methodology and process design are in place, FineReport helps enterprise teams operationalize them faster—without relying on fragile manual reporting packs. That is the difference between surviving one reporting cycle and building a system that scales.
Get Ready-to-Use Dashboard Templates in Fine Gallery
If your organization is under pressure to make sustainability reporting faster, more defensible, and more audit-ready, the next step is straightforward: standardize the workflow, centralize the data, and automate the dashboard layer before reporting complexity grows further.
A sustainability reporting dashboard is a centralized system for collecting, validating, reviewing, and publishing ESG data. It helps enterprise teams turn scattered inputs into disclosure-ready information with clear ownership and traceability.
It creates controls around data sources, approvals, timestamps, version history, and supporting evidence. This makes it easier for internal reviewers, auditors, and assurance teams to verify how each reported figure was produced.
Most enterprise dashboards track emissions, energy, water, waste, workforce, safety, diversity, supplier coverage, and governance metrics. They also monitor process KPIs such as completion rates, exception rates, approval cycle time, and evidence attachment rates.
Companies should map dashboard fields, workflows, and evidence requirements to the reporting standards they must follow. A flexible dashboard makes it easier to adapt disclosures as regulations and framework expectations change.
Spreadsheets can track data, but they often break down when multiple teams, entities, and versions are involved. A dashboard adds governance, workflow control, and a reliable audit trail that supports enterprise-scale reporting.
Product Trial
FineReport
Pixel-perfect reports · Interactive dashboards · Easy data entry · Digital twins