A supply chain control tower dashboard gives you a unified view of your entire supply chain. You use this tool to centralize data, monitor operations, and gain real-time visibility into every process. With a supply chain control tower, you can track shipments, inventory, and supplier performance from one place. FineReport helps you create these dashboards quickly, connecting multiple data sources and delivering clear, actionable insights for your business.
Supply Chain Control Tower Dashboard Overview
What Is a Supply Chain Control Tower Dashboard
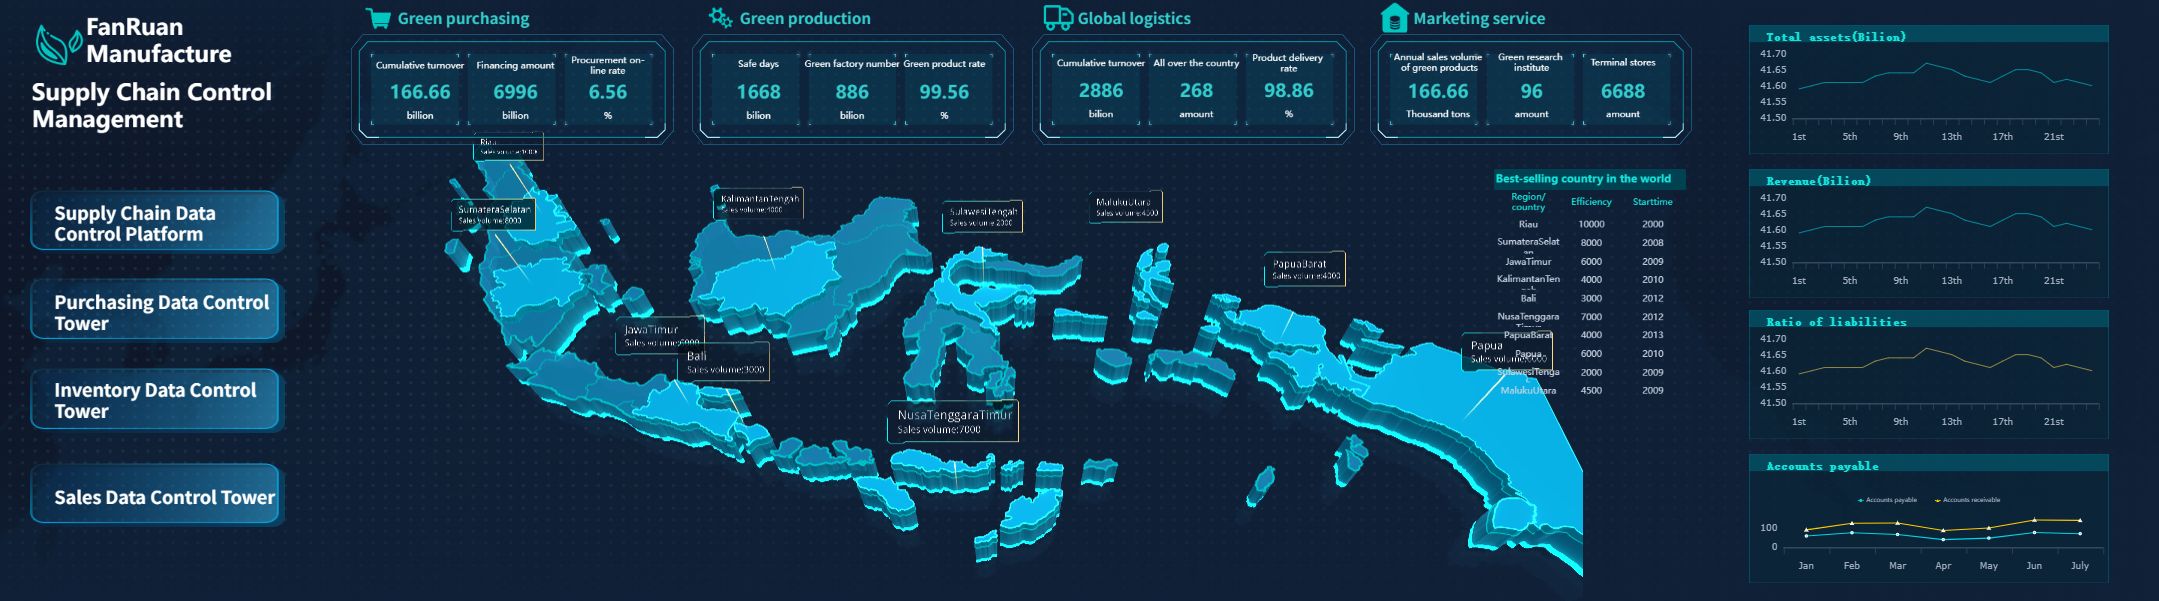
You use a supply chain control tower dashboard to manage and monitor your supply chain from a single location. This dashboard acts as your command center, giving you the tools to track shipments, inventory, and supplier performance. You see every part of your supply chain in one place, which helps you make better decisions and respond quickly to changes.
A supply chain control tower brings together data from different systems. You get a complete view of your operations, including warehouses, suppliers, and logistics partners. The dashboard uses advanced analytics and supply chain analytics to help you spot trends, predict problems, and find opportunities for optimization. You can rely on real-time insights to guide your actions and improve your results.
FineReport makes it easy for you to build a supply chain control tower dashboard. You connect data from multiple sources, including IoT devices and external partners. The dashboard displays key metrics and actionable insights, so you can focus on what matters most. You can customize the dashboard to fit your business needs and access it from any device.
Tip: When you use a supply chain control tower dashboard, you gain end-to-end visibility. This means you see every step in your supply chain, from procurement to delivery.
Here is a table showing the main functions of a supply chain control tower dashboard:
Function
Description
Real-time visibility
You get end-to-end visibility of your supply chain, connecting data across different systems.
Predictive analytics
The dashboard helps you anticipate disruptions and prioritize your responses.
Data integration
You integrate data from many sources, including IoT, to improve visibility and decision-making.
You need centralized data to manage your supply chain effectively. A supply chain control tower collects, organizes, and analyzes data from many sources. You pull information from internal systems, partner networks, and external feeds like weather or traffic. This centralization gives you a clear picture of your supply chain and helps you make smart decisions.
With real-time visibility, you see what is happening as it occurs. You track package locations, monitor warehouse activity, and check supplier status instantly. The dashboard uses IoT sensors and AI to provide real-time insights and alert you to potential issues before they become problems. You can act quickly and keep your supply chain running smoothly.
FineReport supports data integration and real-time monitoring. You connect your databases, spreadsheets, and external systems to one dashboard. You use advanced analytics to uncover data-driven insights and improve supply chain visibility. FineReport helps you build e2e supply chain control towers that support supply chain management and drive optimization.
You organize all your supply chain data in one place.
You integrate information from different departments and partners.
You use real-time insights to improve decision-making and respond to changes.
You rely on actionable insights to guide your supply chain strategy.
Note: Centralized data and real-time visibility are essential for effective supply chain management. You need both to achieve end-to-end visibility and make informed decisions.
Key Features of Supply Chain Control Tower Dashboard
Real-Time Monitoring and Analytics
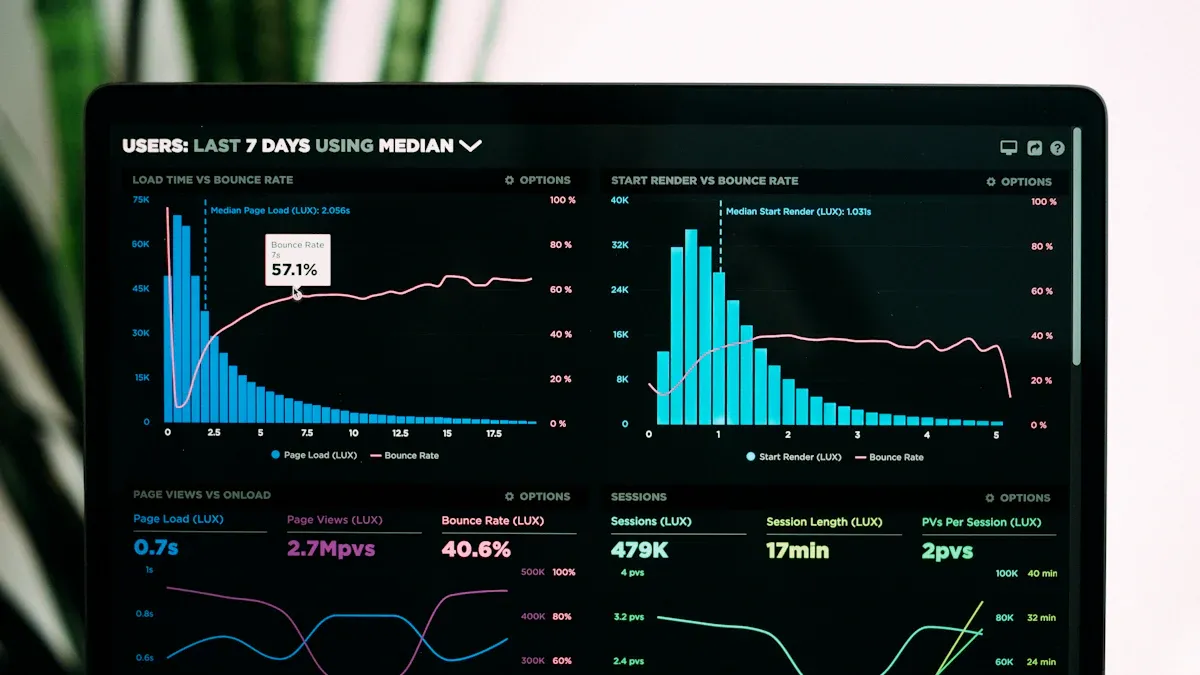
You need to monitor your supply chain at every stage. A supply chain control tower dashboard gives you business metrics for tracking throughput and performance. You see near real-time operational data, which helps you improve supply chain visibility and make better decisions. You can watch shipments, inventory, and supplier activities as they happen.
FineReport lets you connect with systems like TMS, ERP, and MES. You get complete product traceability and access to operational information. You can use supply chain analytics to spot trends, predict problems, and respond quickly. The dashboard brings together data from different networks and external events, so you get actionable insights in a personalized view.
You detect issues early with alerts for delays or backlogs.
You use predictive analytics to support informed decision-making.
You track shipping, warehousing, and supplier performance in real time.
Tip: Real-time visibility helps you act fast and keep your supply chain running smoothly.
Data Integration with FineReport
You need strong data integration to manage your supply chain. FineReport connects your databases, spreadsheets, and external systems into one dashboard. You can pull information from internal sources, partner networks, and feeds like weather or traffic. This integration gives you end-to-end visibility and helps you make smart decisions.
FineReport supports multi-source data connection. You can combine data from SQL databases, Excel files, and cloud platforms. The dashboard organizes and analyzes this data, so you see the full picture. You can drill down into details or view summary reports. FineReport’s drag-and-drop designer makes it easy to build custom dashboards without coding.
Note: Data integration is key for supply chain control tower dashboards. You need to connect all your systems to get accurate, up-to-date information.
Customizable Dashboards and Mobile Access
You want dashboards that fit your needs. FineReport lets you customize layouts, charts, and alerts for different user roles. You can set custom alerts for important issues, define thresholds for inventory, and apply rules for different conditions. The dashboard integrates these alerts for better supply chain planning.
Notifications for significant supply chain issues based on user-defined threshold values.
Threshold Definition
Users can set specific values for alerts, such as minimum inventory levels.
Rule Application
Alerts can be customized based on different attributes, conditions, and periods.
Dashboard Integration
Custom alerts can be added to dashboards for enhanced visualization of supply chain planning.
FineReport supports mobile dashboards and 3D dashboards. You can access key metrics on your phone or tablet, so you stay informed wherever you are. The 3D dashboard helps you visualize complex data, like logistics routes or warehouse layouts, in a clear and interactive way. You can use mobile BI to monitor KPIs, track trends, and drill down into data on the go.
You customize dashboards for executives, managers, or frontline staff.
You use mobile access to check supply chain status anytime.
You visualize data in 3D for smarter decisions.
Tip: Customizable dashboards and mobile access help you respond quickly and keep everyone aligned.
Business Benefits of Supply Chain Control Tower
A supply chain control tower dashboard transforms how you manage your supply chain. You gain a single source of truth for all your operations. This tool helps you make faster decisions, improve efficiency, and reduce risks. You see every part of your supply chain in real time, which means you can act quickly and stay ahead of problems. FineReport gives you the tools to unlock these benefits, supporting your supply chain management with actionable insights and end-to-end visibility.
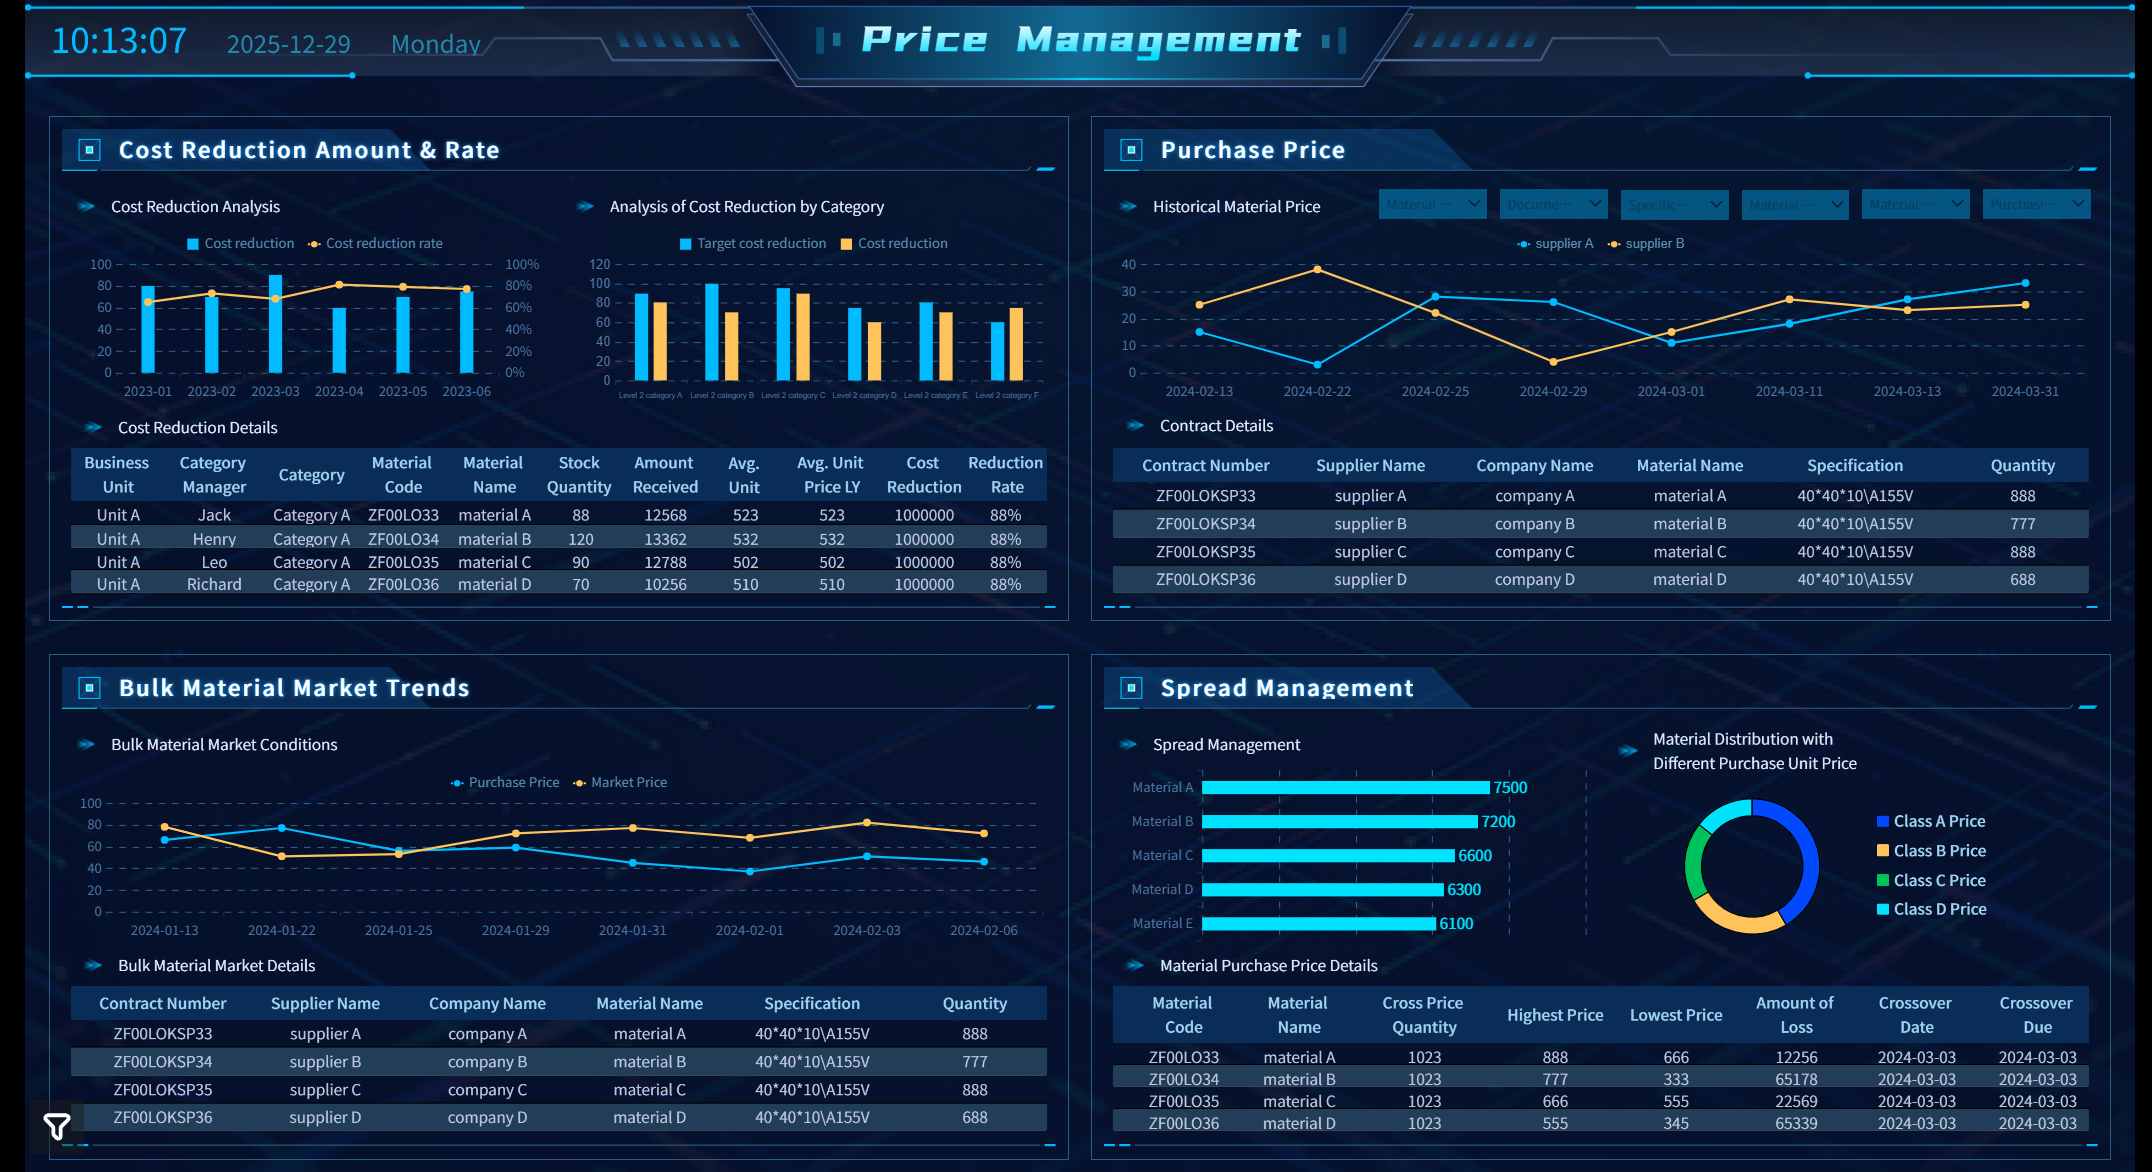
Enhanced Decision Making
You make better decisions when you have the right information at the right time. A supply chain control tower dashboard gives you real-time data and analytics. You can spot trends, predict disruptions, and respond before issues grow. The dashboard brings together data from many sources, so you see the full picture.
Here is how dashboards improve your decision speed:
Impact Area
Description
Real-time visibility
Dashboards provide current data, eliminating delays associated with outdated reports.
Proactive response
Enables teams to address issues before they escalate, reducing response times significantly.
Alignment with business strategy
Insights from dashboards help drive key business outcomes like customer satisfaction and cost efficiency.
Identification of trends and risks
Helps organizations spot opportunities and challenges faster than competitors.
Reduction in disruption response time
Response time can decrease from days to hours, enhancing operational efficiency.
FineReport supports scenario modeling and predictive analytics, so you can test different strategies and see possible outcomes before making a move.
You boost efficiency when you connect every part of your supply chain. The dashboard ensures smooth data flow and clear communication between teams. You can track key performance indicators and spot bottlenecks quickly.
Functionality
Contribution to Process Efficiency
End to end data connectivity
Ensures smooth flow-paths across the supply chain.
Visibility
Provides real-time insights into key supply chain KPIs.
Analytics
Enables predictive analysis and informed decision-making.
Execution
Enhances communication between executive and operational teams.
Companies using real-time data have reduced logistics costs by up to 15%. FineReport helps you automate reporting and streamline workflows, so you save time and resources.
You need to manage risks and work closely with your partners. The dashboard gives you tools for real-time monitoring, automated alerts, and predictive risk scoring. You can plan for "what-if" scenarios and prepare for disruptions.
Real-time monitoring dashboards provide dynamic command centers with automated alerts for critical thresholds.
Predictive risk scoring systems flag suppliers entering high-risk territory, enabling proactive management.
Scenario planning tools allow for 'what-if' modeling to assess the impact of potential disruptions.
You also improve collaboration. All partners see the same real-time data, which reduces information silos. Structured workflows and transparent accountability help everyone work together and trust each other.
Benefit
Description
Shared Visibility
All partners have access to the same real-time data, reducing information silos.
Structured Workflows
Defined processes streamline collaboration and decision-making among partners.
Transparent Accountability
Clear roles and responsibilities enhance trust and cooperation among supply chain partners.
With FineReport, you build a supply chain control tower that supports supply chain visibility, risk management, and strong partnerships.
Types of Supply Chain Control Tower Dashboards
Logistics Control Tower
You use a logistics control tower to manage transportation and delivery across your supply chain. This dashboard gives you real-time visibility into shipments and assets. You track every movement and see updates as they happen. The dashboard integrates logistics data from many sources, so you never miss important information. Advanced analytics help you predict disruptions and find ways to improve efficiency. Automated alerts notify you about delays or risks, allowing you to act before problems grow. You also get tools for collaboration, making it easier to communicate with suppliers, carriers, and customers.
Real-time end-to-end visibility for shipments and assets
Integration of logistics data from multiple sources
You improve transportation management by identifying issues early, consolidating data, and enhancing teamwork. This leads to better on-time delivery and higher customer satisfaction.
Inventory Control Tower
You rely on an inventory control tower to oversee stock levels across all locations. The dashboard centralizes inventory data, giving you a clear view of what you have and where it is stored. Demand forecasting aligns inventory with market needs, reducing the risk of stockouts or overstock. Automated alerts let you know when it is time to reorder, streamlining the restocking process. You avoid costly mistakes and keep your supply chain running smoothly.
FineReport supports inventory dashboards by integrating data from warehouses, sales, and suppliers. You customize alerts and reports to match your business needs. This flexibility helps you maintain optimal inventory and respond quickly to changes.
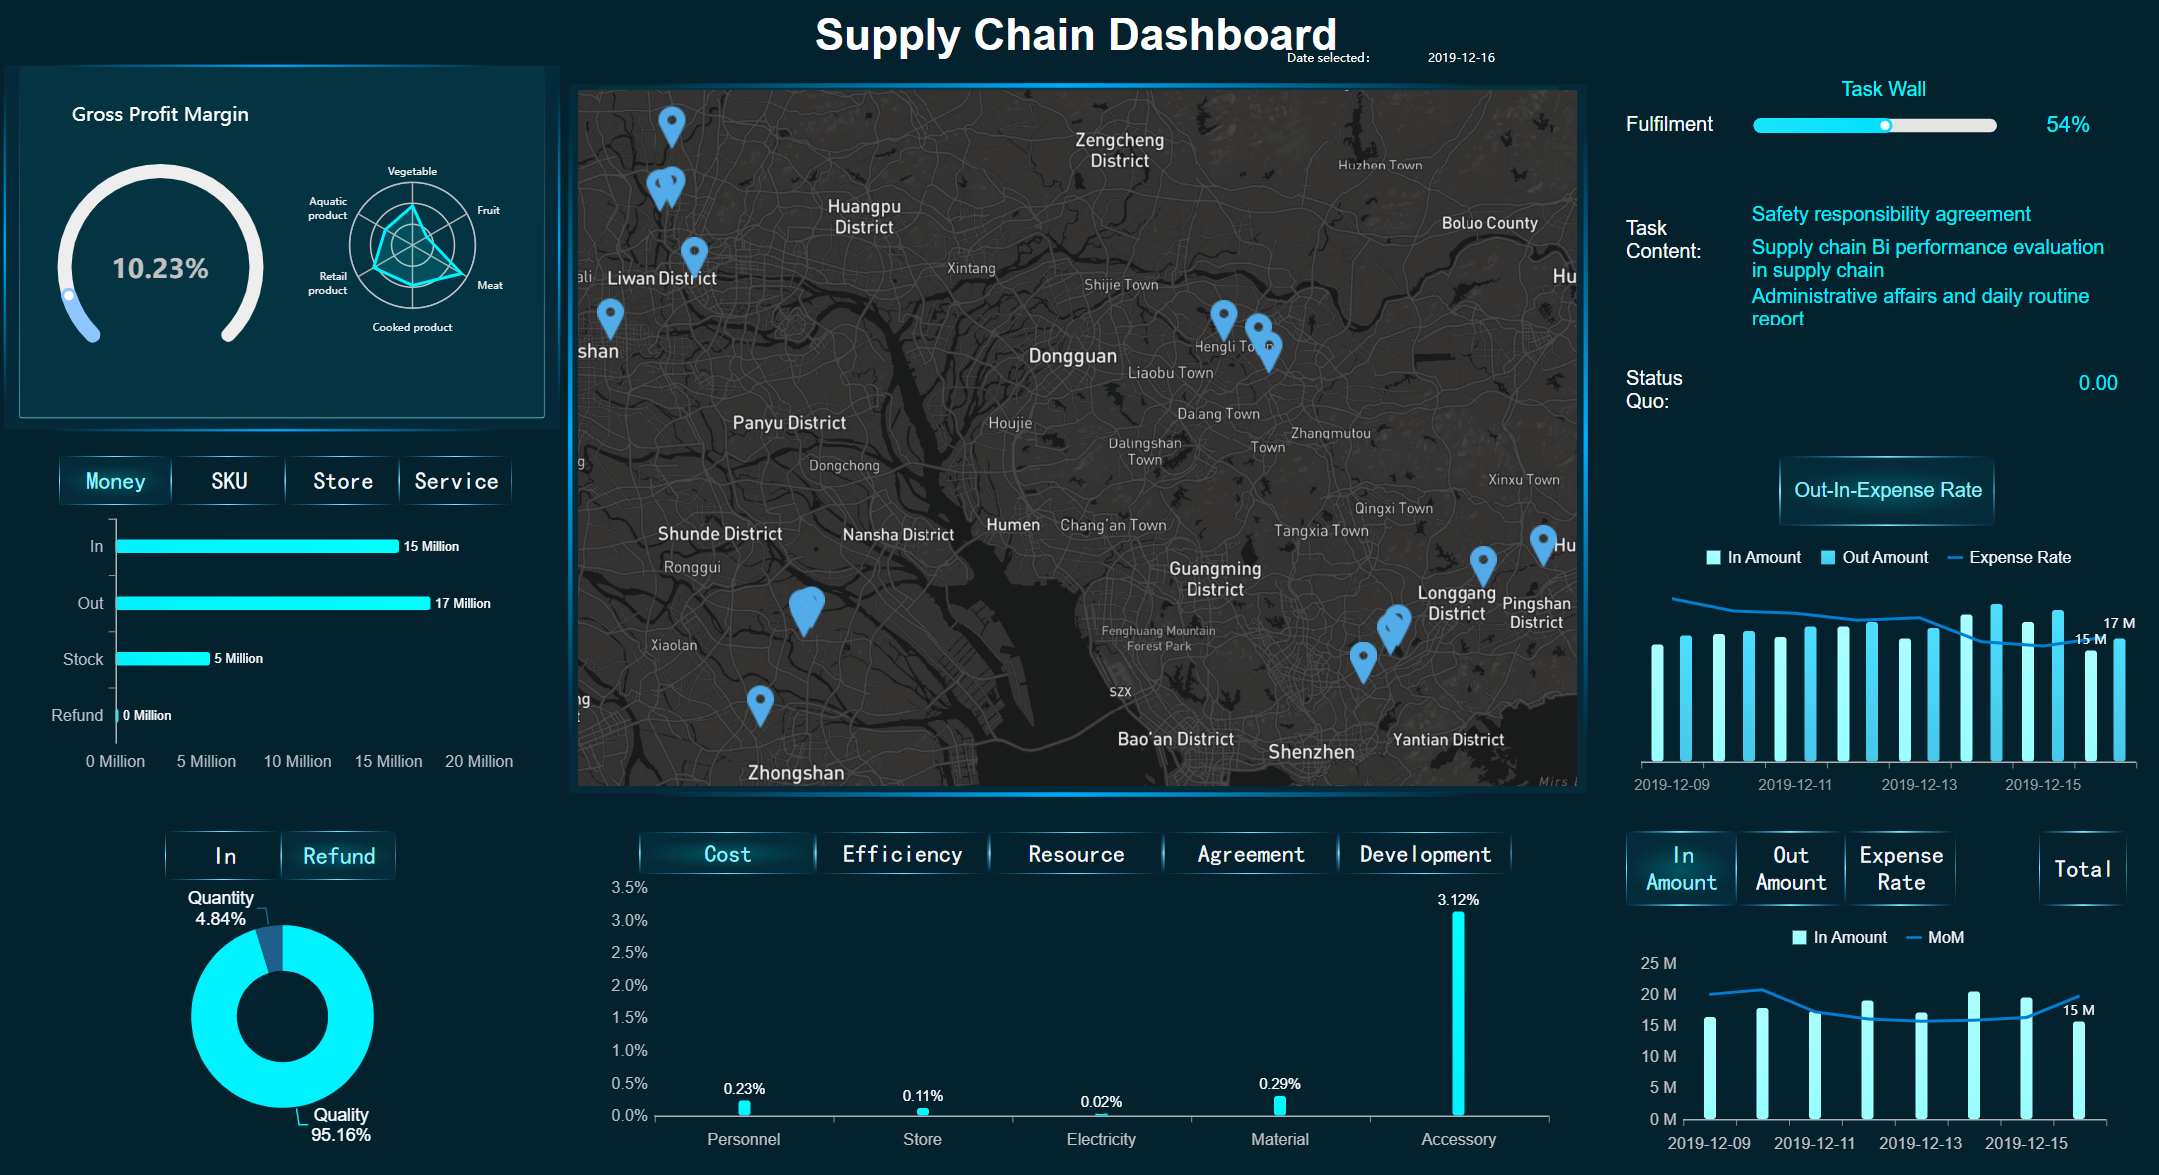
You use an end-to-end supply chain dashboard to monitor every part of your supply chain, from procurement to delivery. This dashboard breaks down data silos and provides context for decision-making. You get real-time updates, dynamic alerts, and collaboration tools that help you resolve issues quickly. Predictive analytics guide you to anticipate problems before they happen.
Feature
Control Tower
Dashboard
Data Analytics
Integrates data from all enterprise sources with AI for actionable insights
Typically limited to historical data analysis
Context
Provides context by breaking down data silos across the end-to-end supply chain
Lacks comprehensive context for decision-making
Control
Enables adjustments across the supply chain for efficiency
Offers a static view without control capabilities
Dynamic
Provides real-time updates and alerts for potential issues
Presents a snapshot of data at a specific time
Real-Time Collaboration
Facilitates collaboration with stakeholders to resolve issues
Limited collaboration features
Forward-thinking
Utilizes predictive analytics to anticipate issues before they arise
Generally reactive, focusing on past events
FineReport gives you the flexibility to build any type of supply chain control tower dashboard. You integrate data from ERP, MES, and SRM systems. You use low-code tools to create dashboards that fit your business. Real-time insights and benchmarking features help you compare performance and make better decisions.
Tip: Choose the dashboard type that matches your supply chain goals. FineReport adapts to your needs, whether you focus on logistics, inventory, or the entire supply chain.
Implementing a Supply Chain Control Tower Dashboard
Data Quality and Integration
You need high-quality data to build a reliable supply chain control tower dashboard. Poor data can lead to conflicting information and loss of confidence among decision makers. Sometimes, teams even return to manual tracking methods when dashboards show errors. You may face issues like duplicate records, missing fields, inconsistent naming, and outdated reference information. Data governance and integration problems often cause delays and inaccuracies.
To ensure seamless data integration, you should follow a structured approach. Here is a table outlining the key phases:
Phase
Description
Phase 1: Identifying and Prioritizing Business Objectives
Work with stakeholders to set clear goals for your dashboard.
Phase 2: Analyzing, Detecting, and Developing Response Strategies
Review current processes, find gaps, and create strategies using thorough data analysis.
Phase 3: Enabling Through Technology, Design, and Deployment
Choose the right tools, like FineReport, to connect all your data sources and create a unified view.
Phase 4: Continuous Improvement
Monitor performance, set KPIs, and refine your dashboard over time.
Tip: Always check your data sources for accuracy before integrating them into your dashboard.
Change Management and User Training
You must prepare your organization for change when you introduce a new dashboard. Modify structures and cultures to support the new system. Develop a clear strategy and vision. Engage stakeholders, including supply chain partners and internal teams. Integrate systems and data from multiple sources to achieve real-time visibility.
"User training is crucial for the successful implementation of supply chain control tower dashboards as it ensures that stakeholders can effectively interpret and utilize the information presented. A well-designed dashboard must resonate with its audience and be user-friendly, allowing relevant stakeholders to easily understand the significance of the metrics displayed and how their actions contribute to overall supply chain success."
You should provide hands-on training and support. This helps users understand how to use the dashboard and make better decisions.
FineReport Implementation Best Practices
FineReport offers a proven methodology for dashboard implementation. You start by connecting all your data sources using FineReport’s drag-and-drop designer. Customize dashboards for different roles, such as executives or frontline staff. Use mobile and 3D dashboards to give users access anywhere.
You can learn from customer stories like Kintetsu World Express. They improved operational efficiency by integrating multiple data sources and providing real-time dashboards for customer and logistics information. You should monitor results, gather feedback, and update your dashboards regularly to keep them effective.
Note: Successful implementation depends on strong data quality, clear change management, and ongoing user training.
A supply chain control tower dashboard gives you a clear view of your entire supply chain. You use it to unify operations, anticipate risks, and make better decisions. FineReport helps you build dashboards that improve efficiency and customer satisfaction.
You can use predictive analytics to foresee problems and protect your business. Explore FineReport to create dashboards that support your supply chain goals.
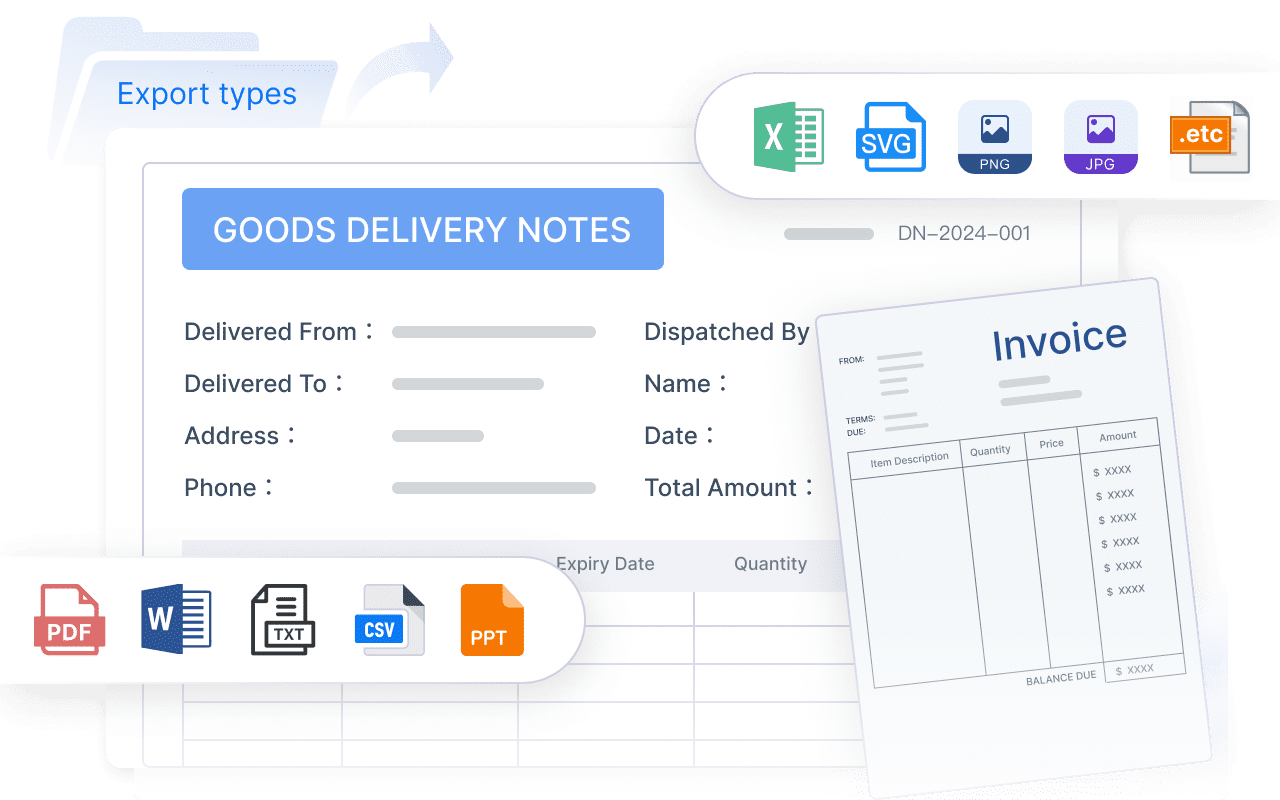
Access a wealth of case studies, industry insights, and solution guides to accelerate digital transformation.
FAQ
What is a supply chain control tower dashboard?
You use a supply chain control tower dashboard to monitor and manage your supply chain in one place. It gives you real-time data, alerts, and analytics to help you make better decisions.
Can you access FineReport dashboards on mobile devices?
Yes, you can view and interact with FineReport dashboards on your phone or tablet. The mobile dashboard lets you track key metrics and respond quickly, wherever you are.
How does FineReport integrate data from different sources?
FineReport connects to databases, spreadsheets, and cloud platforms. You use its drag-and-drop designer to combine data from multiple sources into one dashboard for complete visibility.
What types of supply chain dashboards can you build with FineReport?
You can create logistics, inventory, and end-to-end supply chain dashboards. FineReport lets you customize layouts and features to match your business needs.