You want to do well in 2026? Try the operation dashboard templates——the right dashboard helps you check results, improve sales performance and also helps you use data to manage better. And software like FineReport make this simple, giving you real-time insights and steady quality.
Why Operations Dashboard Templates Matter

Real-Time Data for Business Success
You want your business to work well. The right operations dashboard template lets you see what is happening right now. Real-time data means you do not need to wait for reports. You can find problems early and fix them fast.
- Real-time dashboards give you quick insights for doing better.
- They connect your plans with what is really happening.
- You can see how you use resources and where to get better.
Let’s check out some key performance indicators that real-time dashboards track:
| Key Performance Indicators (KPIs) | Description |
|---|---|
| Machine Production Schedules | Shows if your machines meet demand. |
| Defect Rates | Tells you where quality problems happen. |
| Average Response Times | Measures how fast your team helps customers. |
| Call Volumes | Helps you get ready for busy customer service. |
When you use these dashboards, everyone sees the same numbers. This keeps your team working together and helps you reach goals faster. FanRuan wants to help you with data, so you always know how your business is doing.
Impact on Decision-Making and Performance
Operations dashboard templates do more than show numbers. They turn data into easy-to-understand pictures. This helps you see patterns, find problems, and make smart choices fast.
Here is how operations dashboards help you make better choices:
- They put your KPIs in one place.
- You can see patterns and find problems quickly.
- Leaders can answer big questions in seconds.
A good dashboard puts all your reports, tools, and analytics together. Everyone can see the newest updates, so teamwork gets better and things move faster. When you focus on customers, you know what to measure and how to improve. This is how you use data to get real results.
Essential Operations Dashboard Templates for 2026
If you want your business to run well, you need the right operations dashboard template. These templates help you see what is important. You can find problems early and make better choices. FineReport lets you build dashboards easily. This way, you can focus on what helps your business grow. Each template below matches FanRuan’s goal. They want to give you clear data and help you get better.
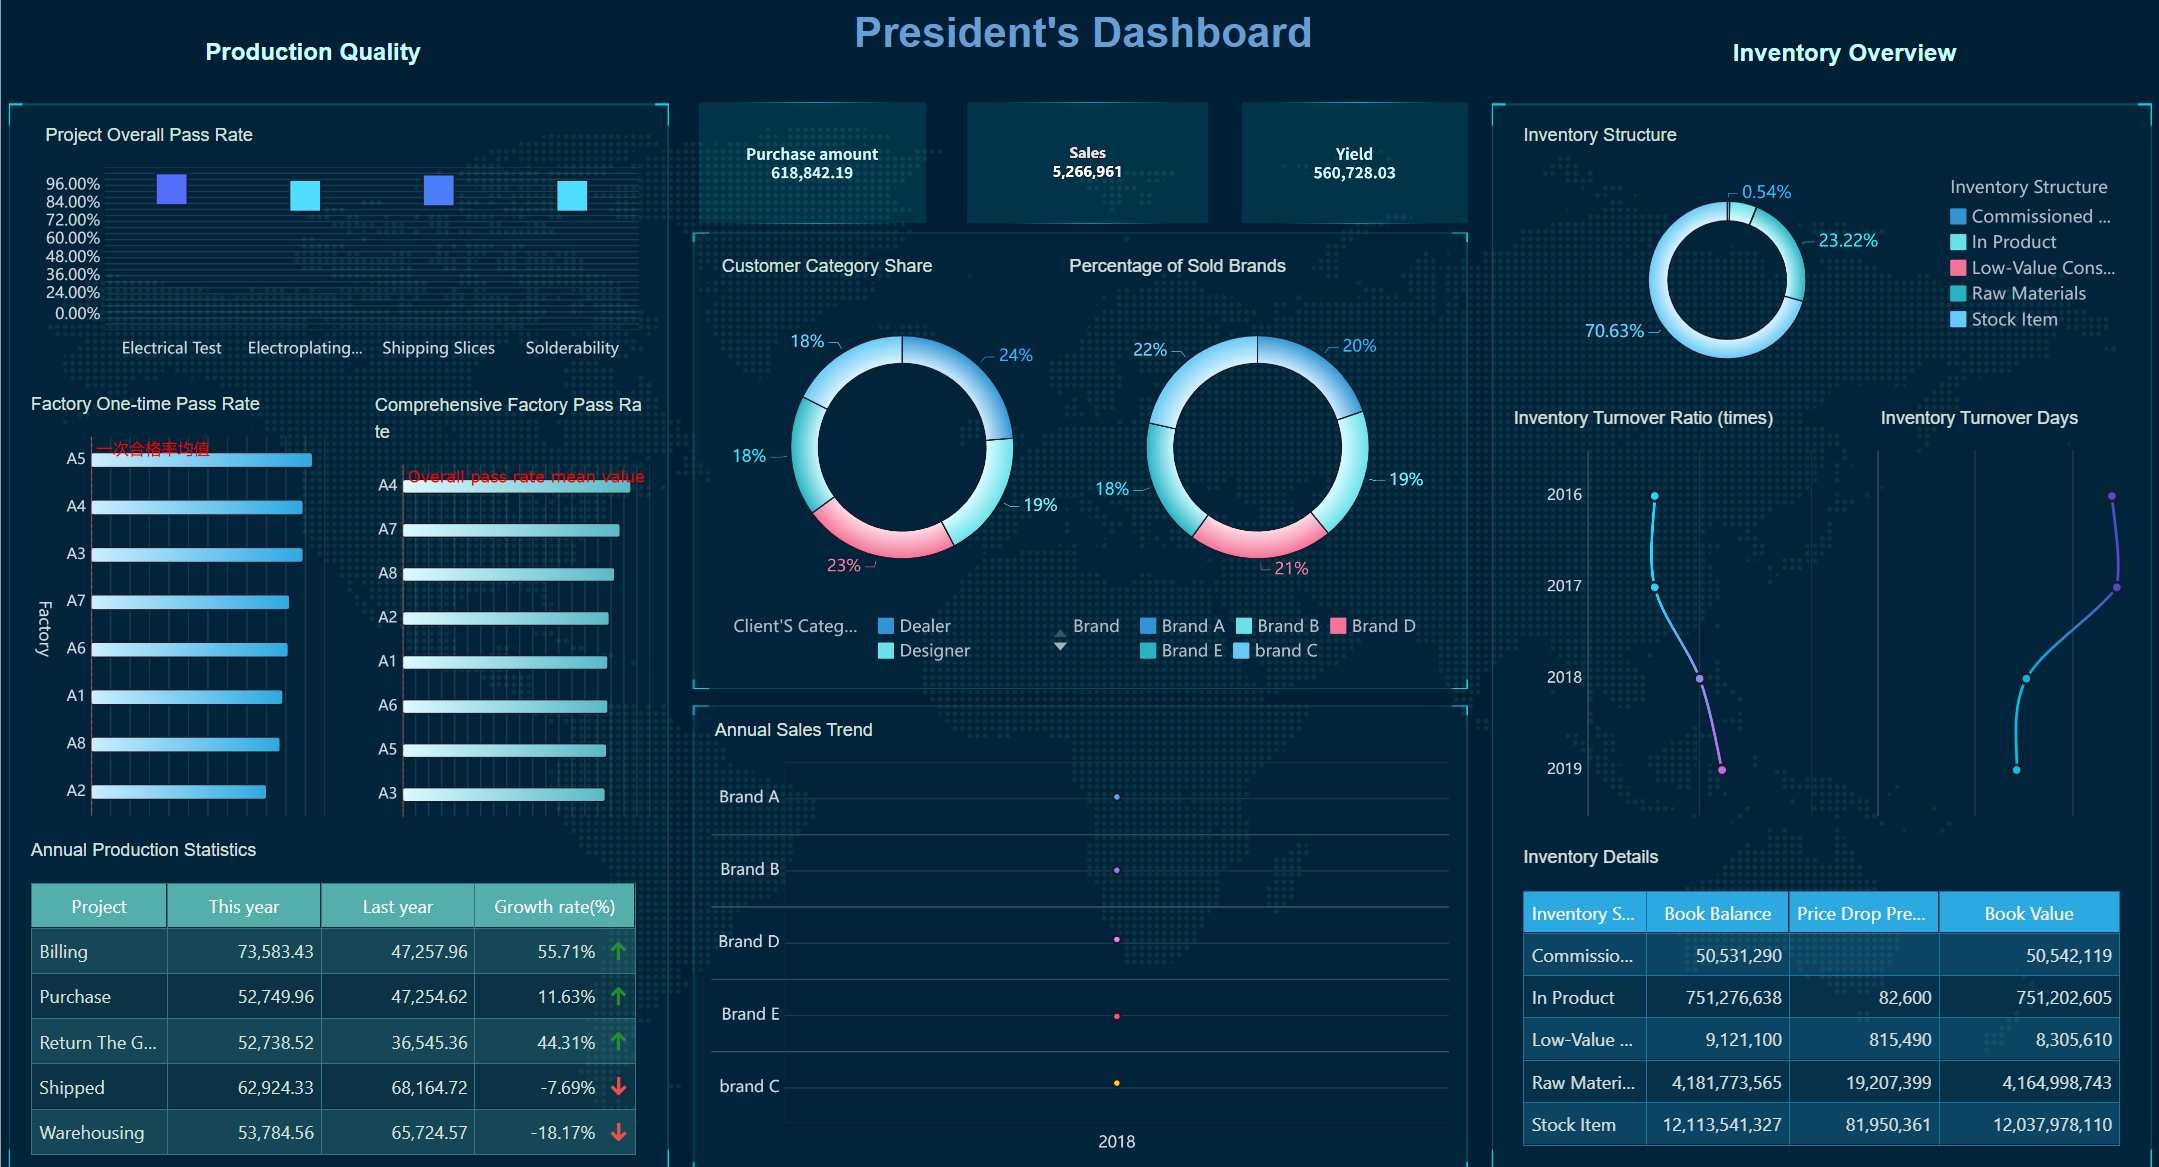
Executive Dashboard Template
Leaders need a dashboard that is quick and easy to read. The executive dashboard template gives them this. It shows big numbers and trends. This helps you make smart choices fast. Here is what you get:
| Feature | Benefit |
|---|---|
| Visual and Intuitive | You see hard data in a simple way. |
| High-Level and Strategic | You look at the big picture, not just small things. |
| Real-Time or Near-Real-Time | You always see the newest numbers. |
| Customizable | You can change the dashboard for your needs. |
| Interactive | You can click to see more about any number or trend. |
FineReport lets you build this dashboard with easy tools. You can connect to any data source, like power bi dashboards. This keeps your leaders working together. This template puts the most important KPIs in front.
KPI Dashboard Template
If you want to check your goals, you need a kpi dashboard. This template puts your key performance indicators in one spot. You can see if you are doing well or need to change. With FineReport, you can set up alerts, watch trends, and share updates with your team.
The kpi dashboard template helps you:
- Watch how you are doing on your main goals.
- Find problems before they get big.
- Share results so your team stays on track.
You can connect this dashboard to power bi dashboards or other tools. This helps your business run well and reach your goals. It is one of the best kpi dashboards for growing businesses.
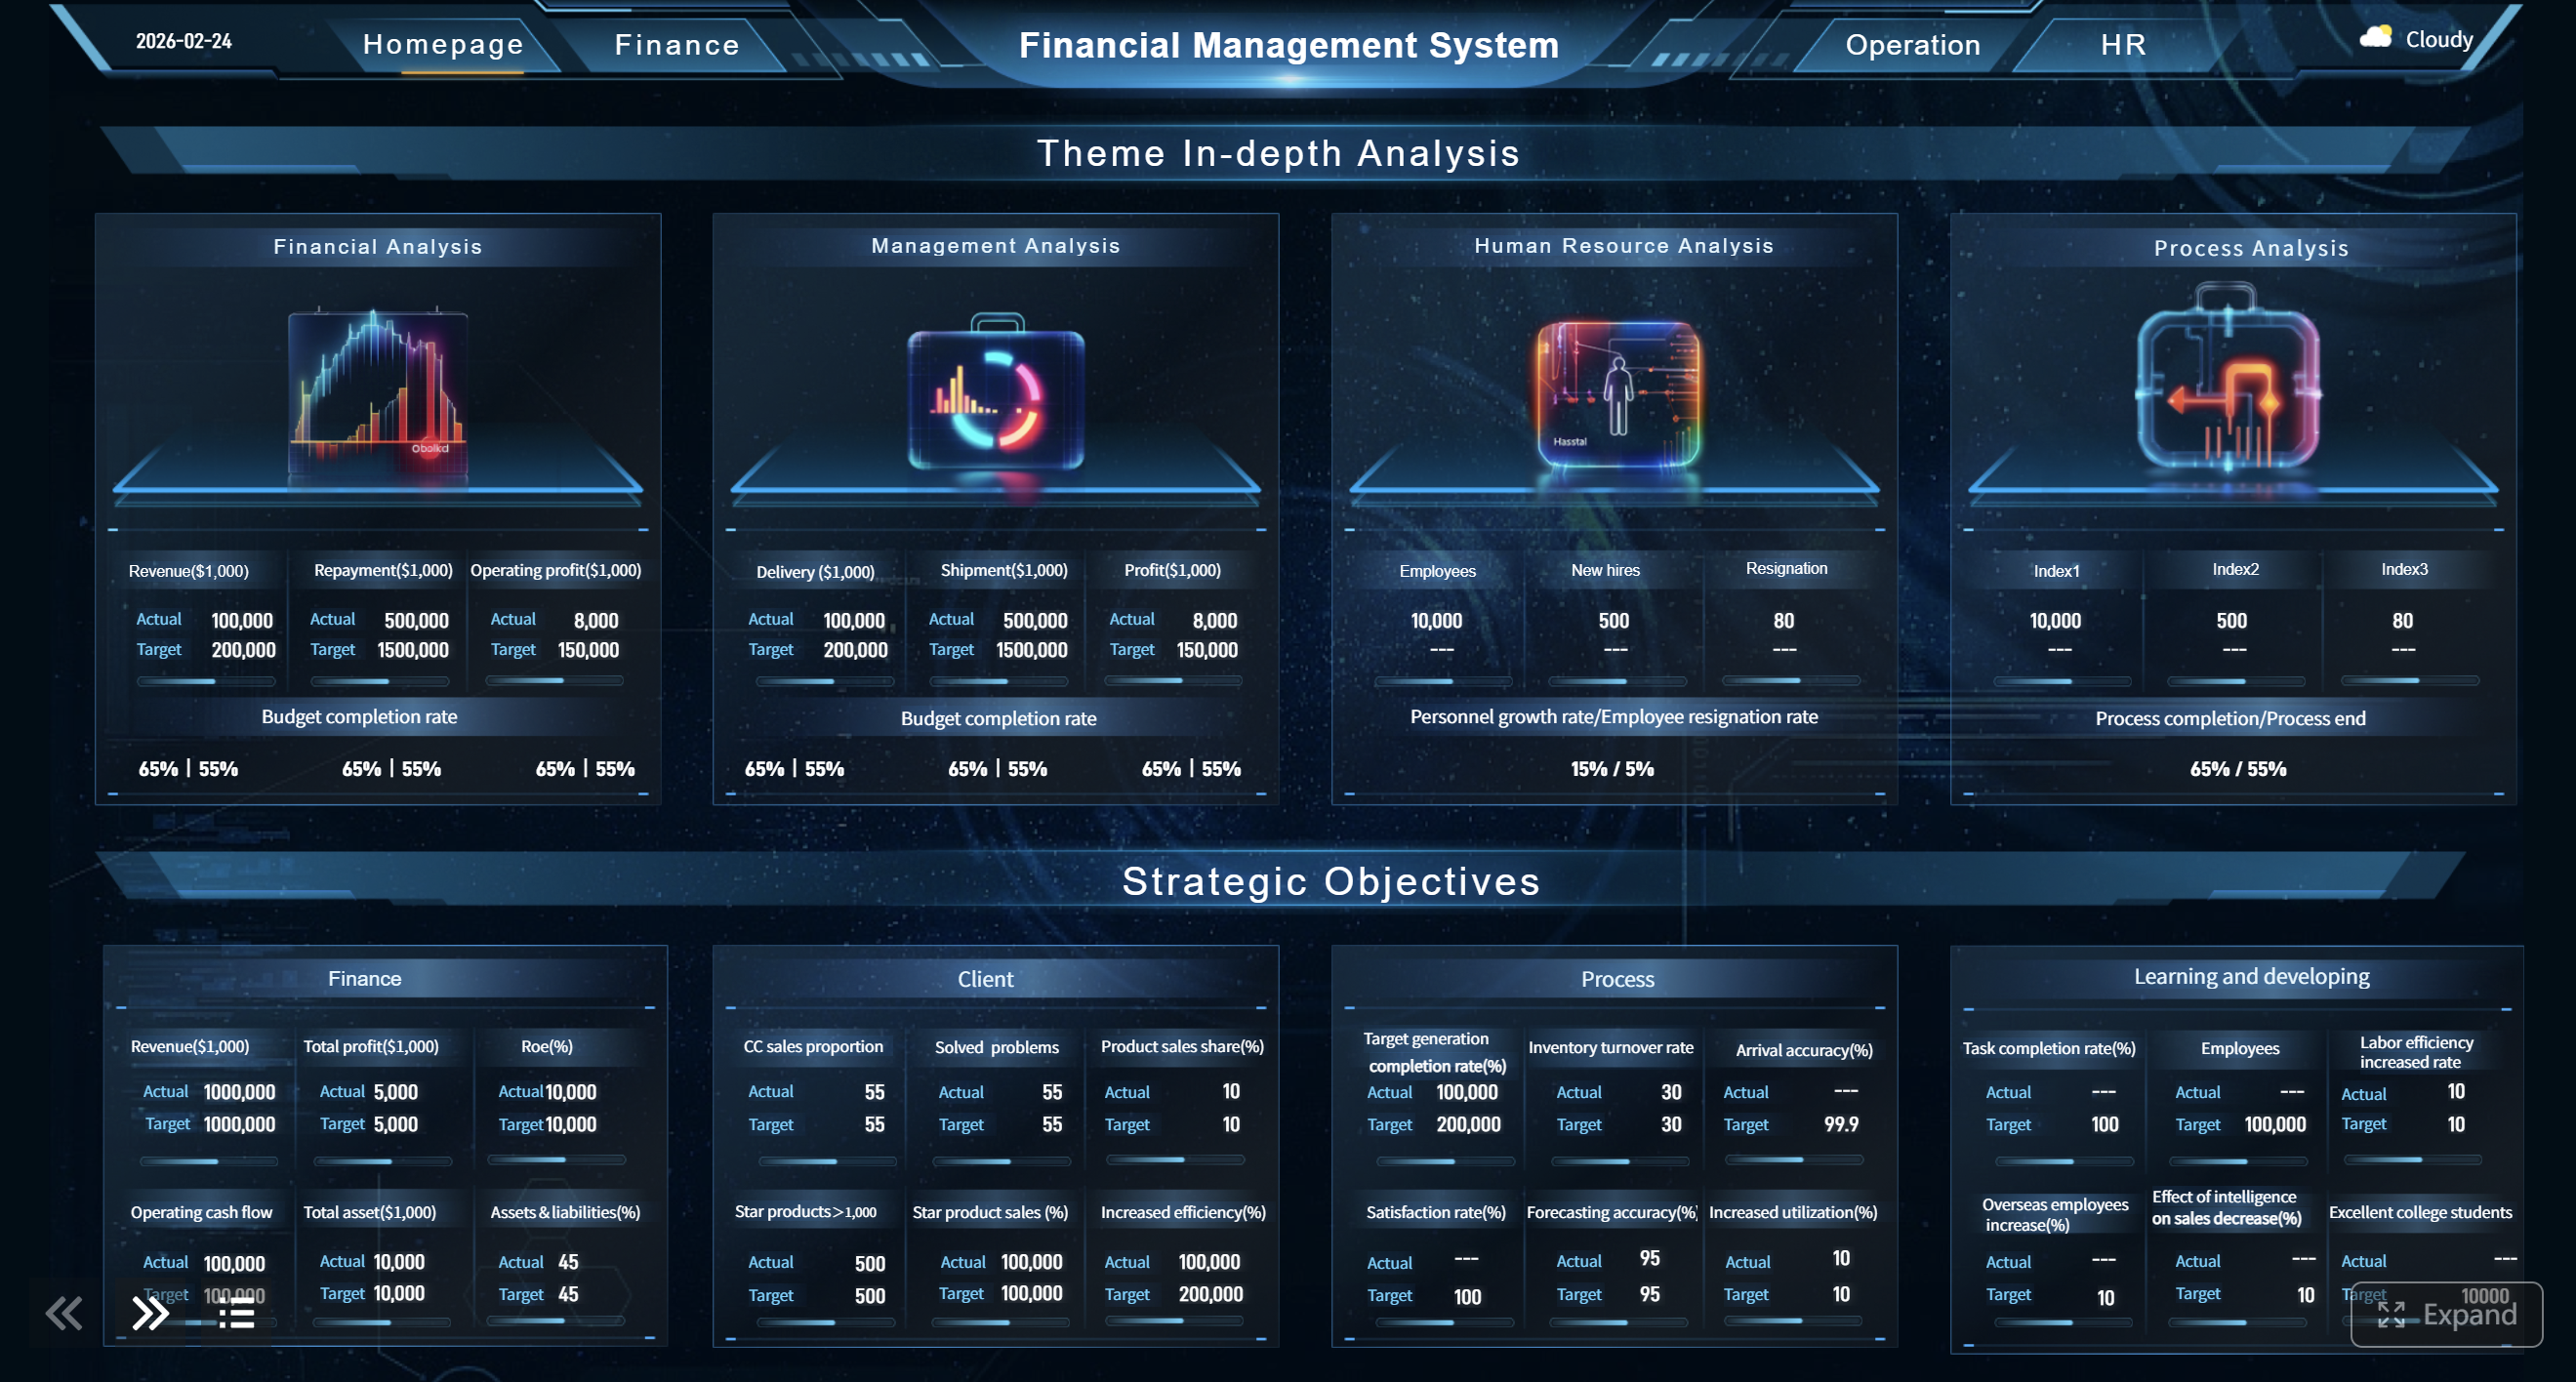
Financial Dashboard Template
Money is important. The financial dashboard template shows you how your company is doing with money. You can see revenue, costs, profits, and more in one place. FineReport lets you build this dashboard fast. You use real-time data from your systems or power bi dashboards.
Here is how this template helps you:
- You see all your main money numbers in one spot.
- You can watch your cash flow and find problems early.
- You make better choices about spending and saving.
- You use your money wisely and everyone can see where it goes.
This dashboard template helps your main business dashboards. You always know where your money is going.
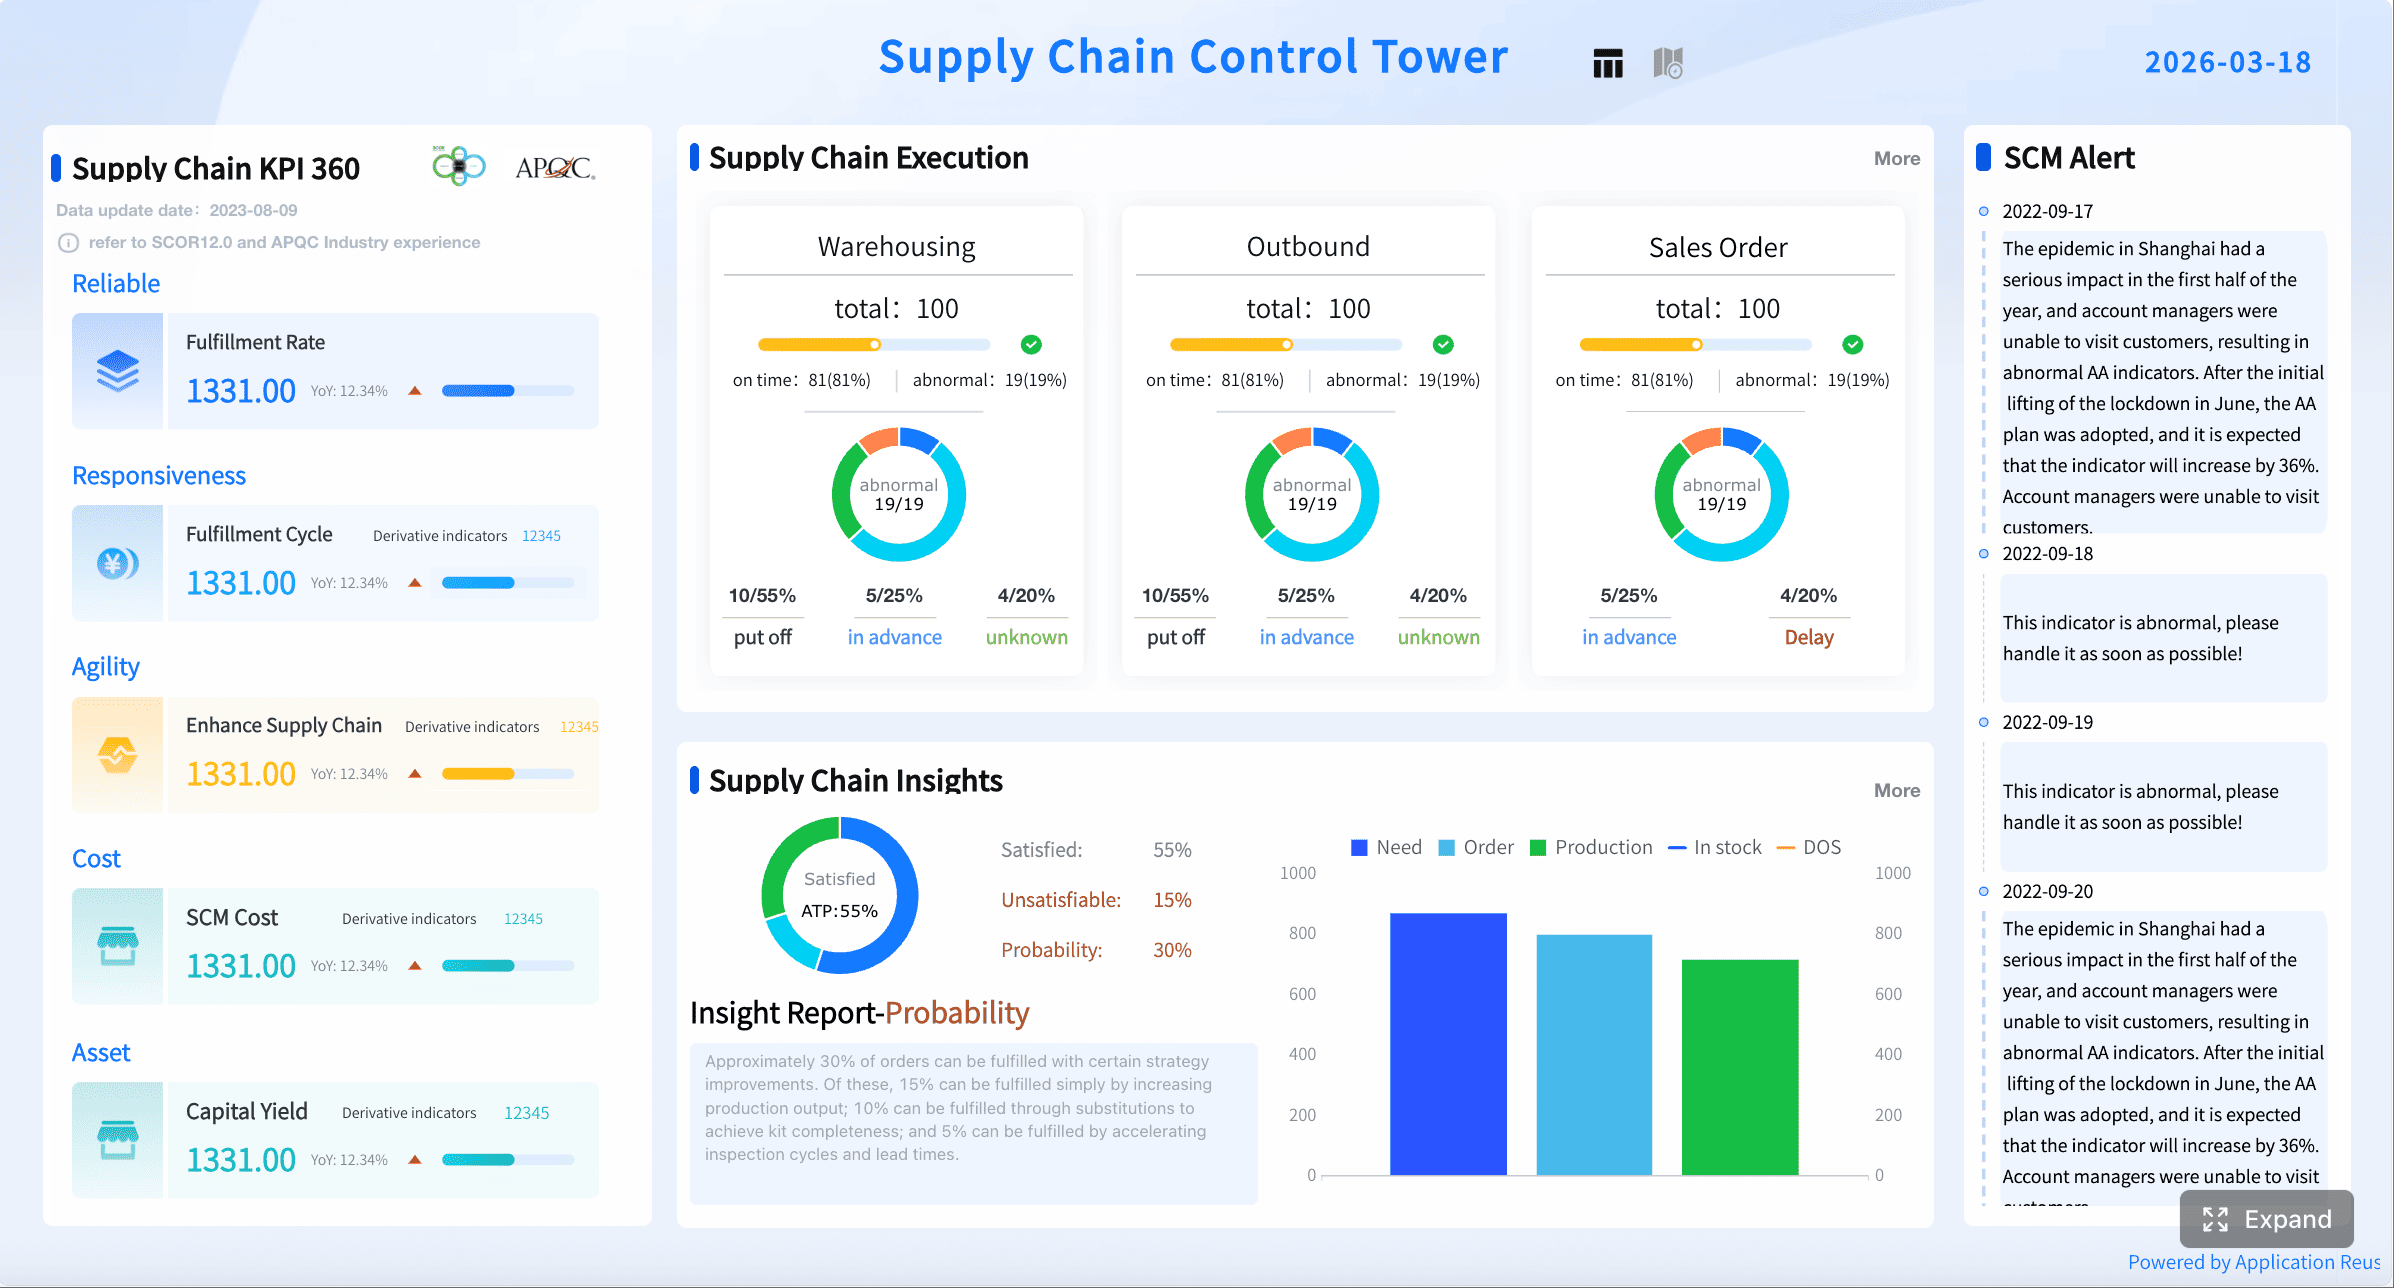
Supply Chain Dashboard Template
If you want your business to keep moving, you need to watch your supply chain. The supply chain dashboard template tracks orders and deliveries. FineReport lets you connect to power bi dashboards and other data. You always see the newest numbers.
| Dashboard Type | Key Metrics |
|---|---|
| Inventory Dashboard | Stock levels, supply chain metrics, inventory efficiency management |
| Operations Dashboard | Inventory turnover rate, perfect order rate, stockout rate, order cycle time, labor efficiency, etc. |
| Inventory Turnover Dashboard | Inventory turnover ratio, sell-through rate, holding costs, demand forecasting accuracy, etc. |
| Inventory Planning Dashboard | Safety stock levels, lead times, inventory accuracy rate, service level targets, etc. |
| Supplier Performance Dashboard | On-time delivery rate, quality rejection rate, lead time, contract compliance, etc. |
This operations dashboard template helps you find delays and manage risks. You can keep your customers happy. It is very important for any business that needs smooth operations.
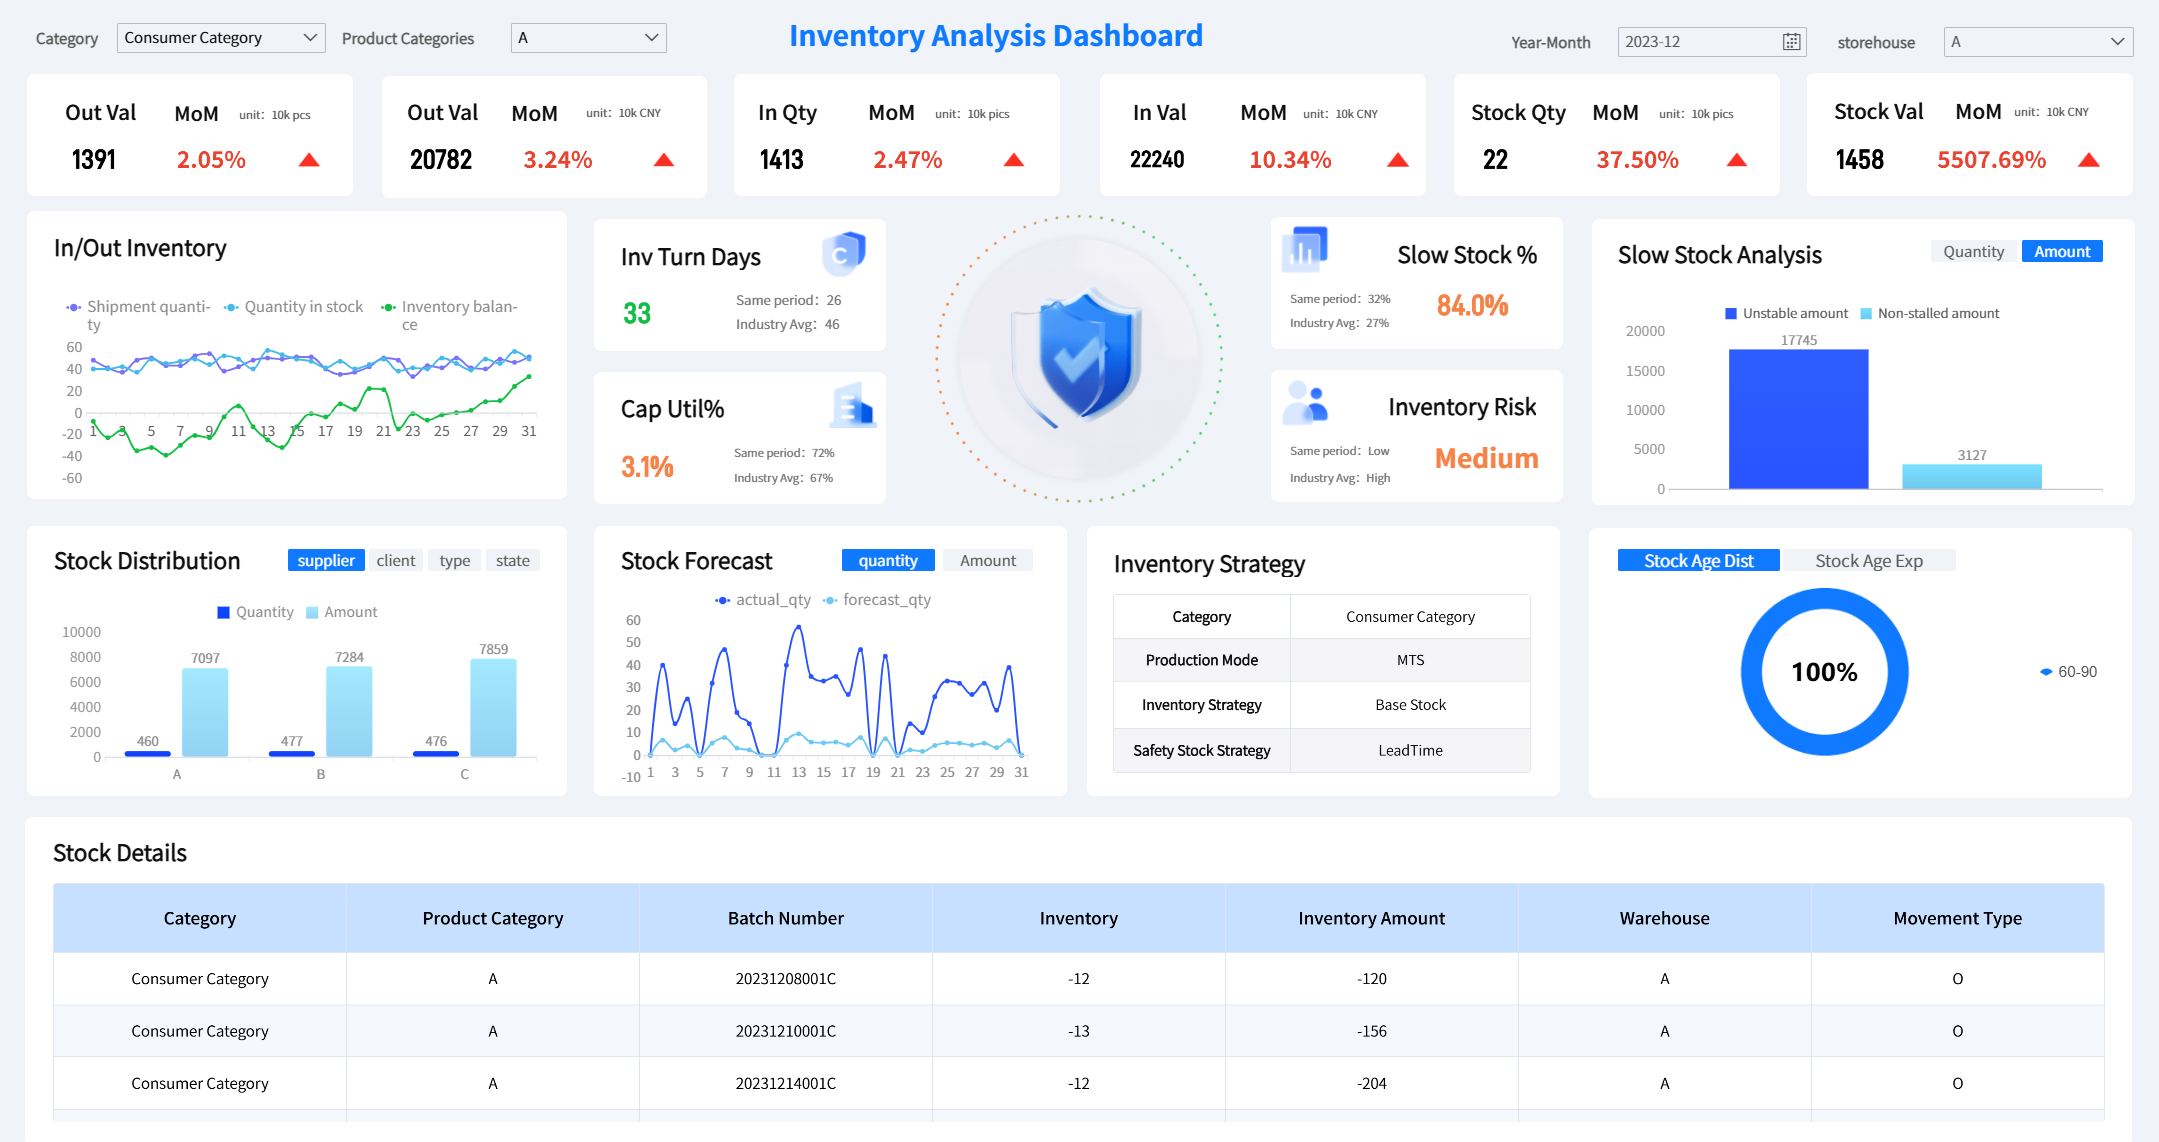
Inventory Dashboard Template
You do not want to run out of stock or have too much. The inventory dashboard template helps you with this. FineReport makes it easy to track stock, trends, and how suppliers are doing. You can connect this dashboard to power bi dashboards for more details.
| Feature | Benefit |
|---|---|
| Real-time stock levels | You always know what you have, so you do not miss sales. |
| Trend analysis | You see how inventory changes, so you can buy better. |
| Customer satisfaction | You can react fast when customers want more. |
| Strategic supplier planning | You lower risks and stay ahead of others. |
- This template helps you fix supply chain problems early.
- You save money by managing inventory well.
- You make your business run better and smoother.
This dashboard sends alerts when stock is low or too high. You can act fast and stop mistakes.
Project Tracking Dashboard Template
Projects can be hard to manage. The project tracking dashboard template keeps things on track. You see what is done, what is late, and what needs work. FineReport lets you build this dashboard with real-time data and easy layouts. You can connect to power bi dashboards for more details.
| Key Feature | Description |
|---|---|
| Real-time Data Integration | You see project updates as they happen. |
| Customizable Layouts | You set up the dashboard for your project. |
| Interactive Elements | You can click and see more details right from the dashboard. |
| Key Metrics Displayed | Track how much is done, bug fixes, and more. |
| Modular Layouts | Use charts and lists to show data in the best way. |
This operations dashboard template helps you manage tasks and find risks. Your team can work together better. It is a key part of your main business dashboards.
Operations Dashboard Examples with FineReport
Do you want to know how operations dashboard examples work? FineReport helps you build dashboards for your team. These operations dashboard examples show you how to use data to make decisions.
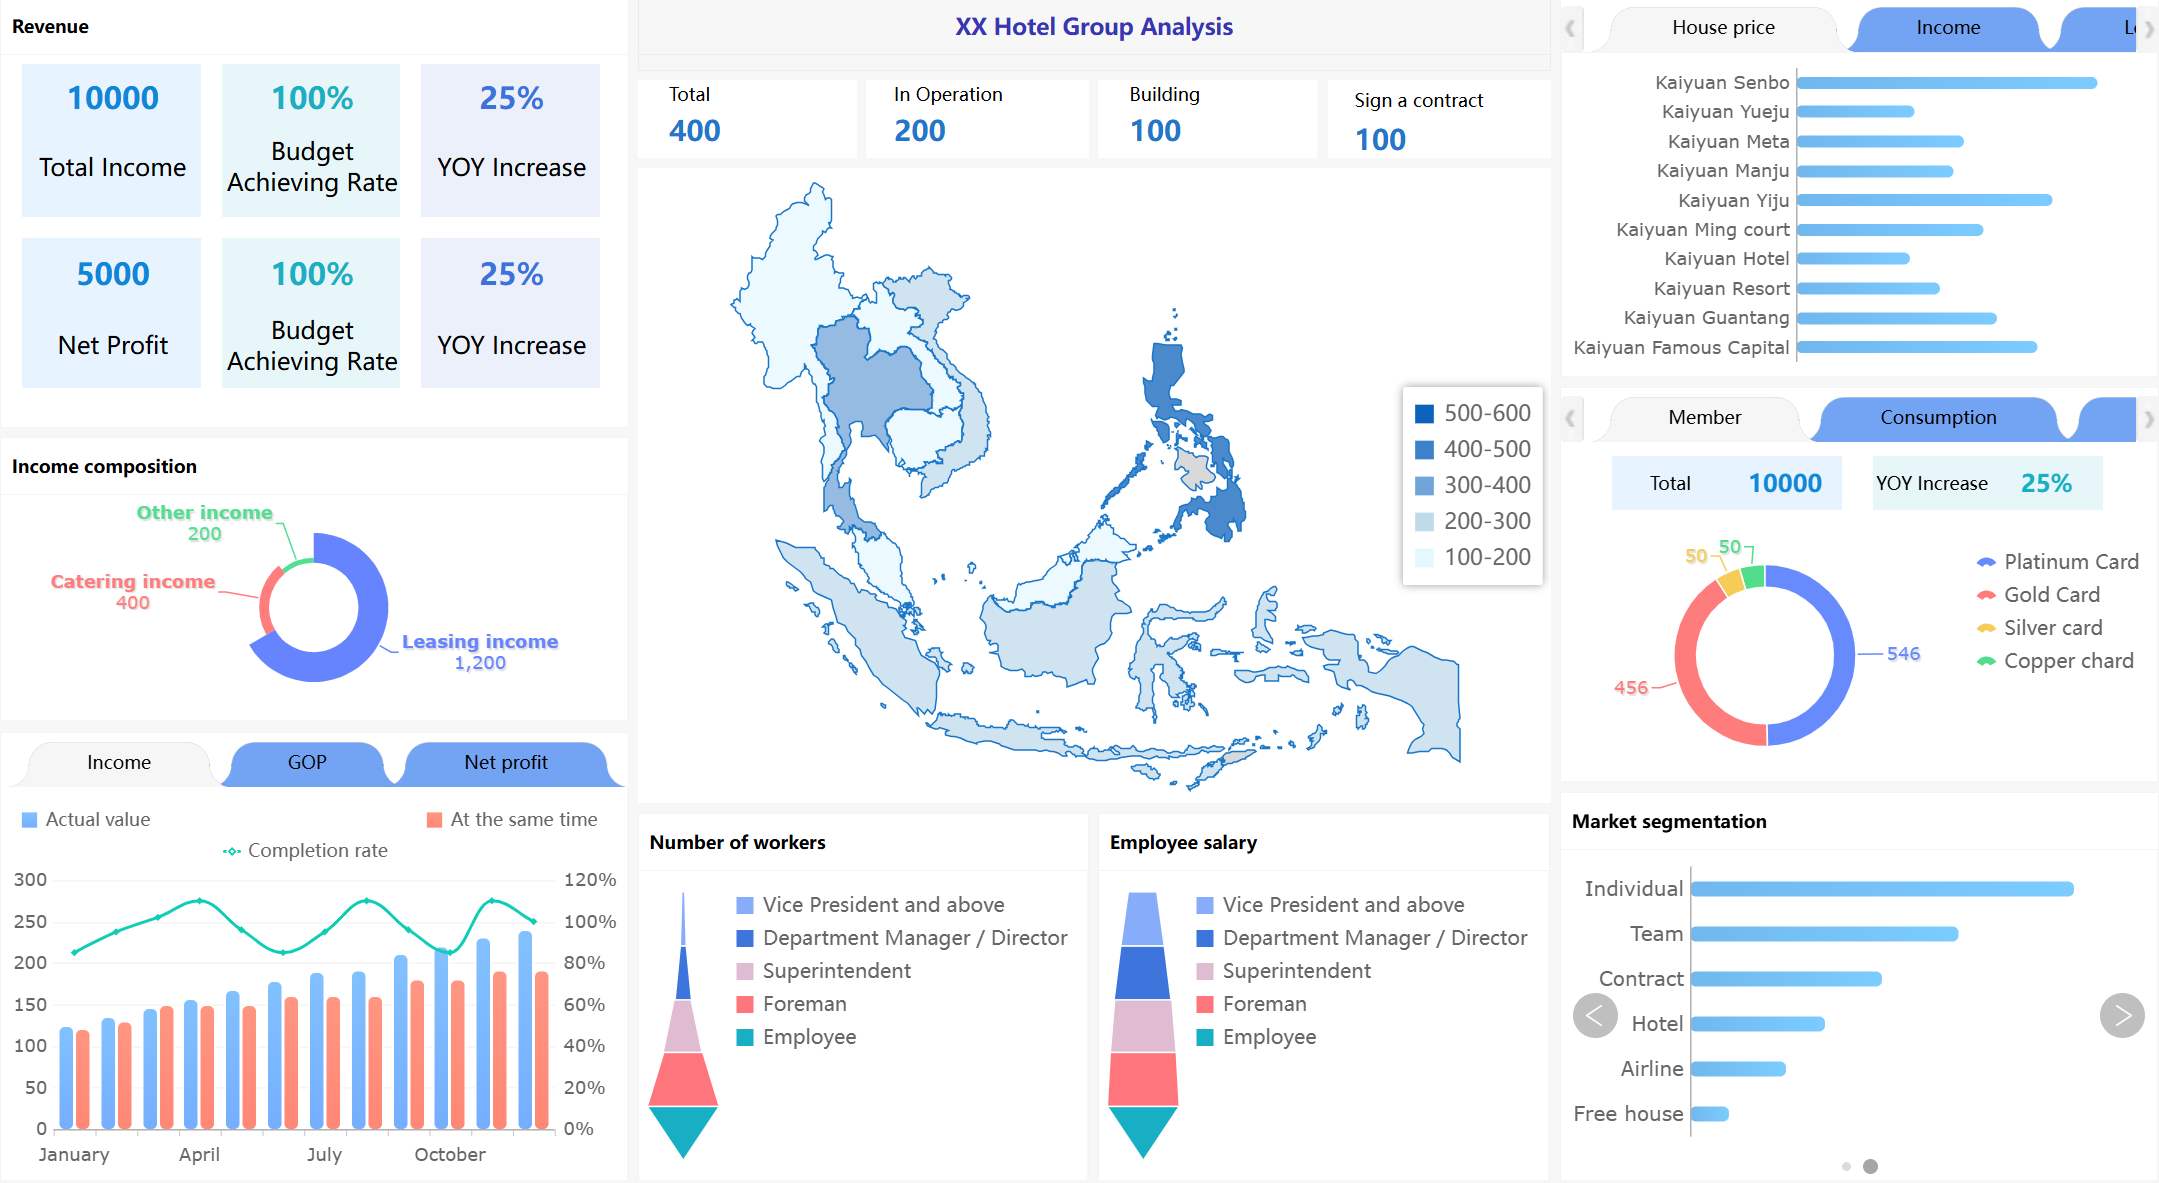
Business Dashboard for Executives
You need a dashboard that shows the big picture. FineReport gives you operations dashboard examples that show trends, profits, and risks together. Executives at BOE use a dashboard to check company health every day. They see sales, costs, and team performance without searching emails or spreadsheets. This dashboard helps you find problems early and make smart choices fast.
Here is a table with common challenges FineReport solves using these operations dashboard examples:
| Challenge | Description |
|---|---|
| Limited web accessibility | Managers and engineers needed better remote access. |
| Complex report design | Staff wanted to build dashboards without coding. |
| Data silos | Teams needed to combine data from different places. |
| Scalability issues | Dashboards had to work well as data grew bigger. |
| Integration constraints | Dashboards needed to fit into other business tools. |
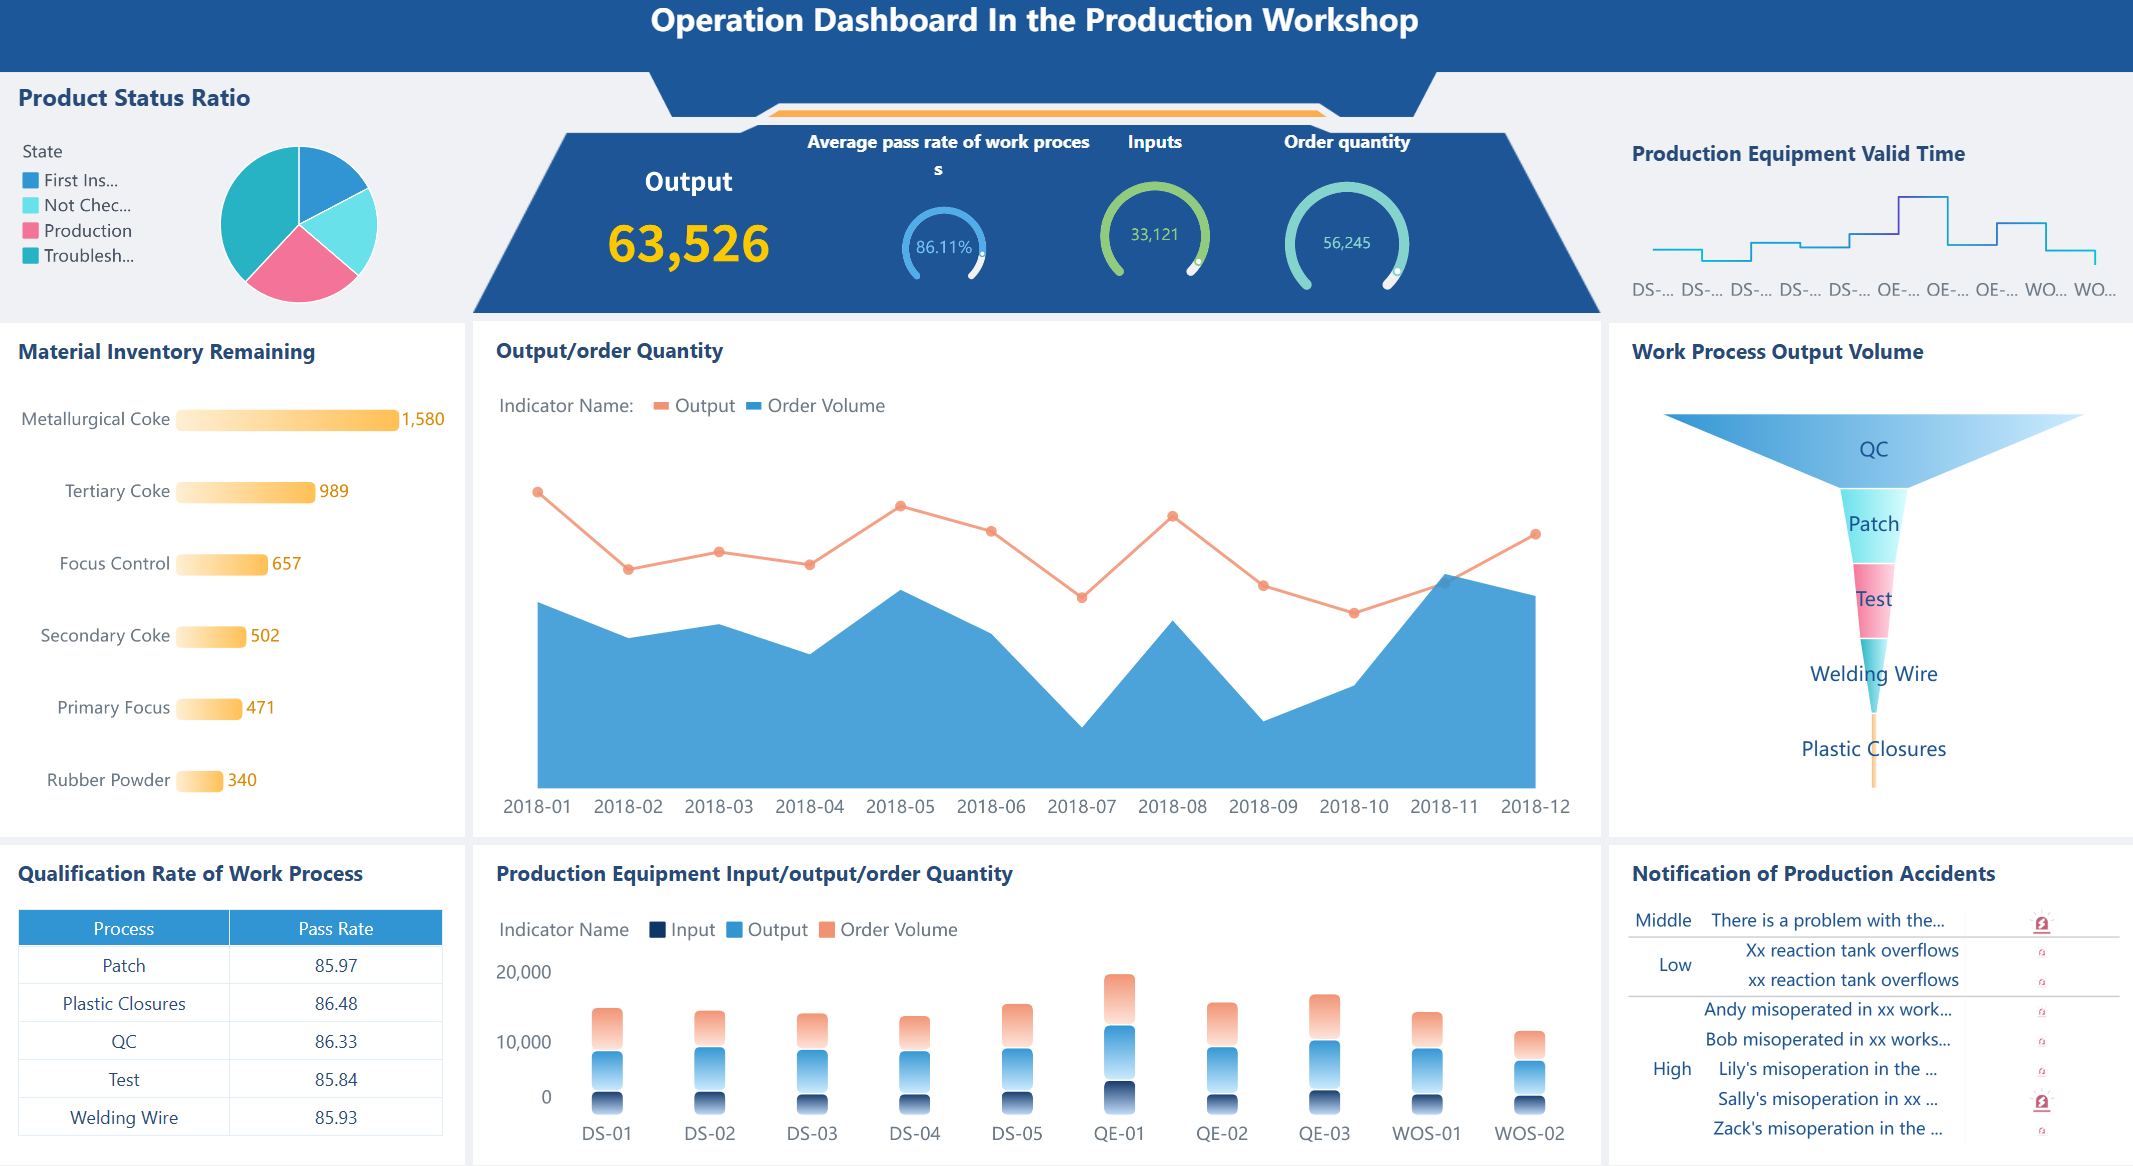
KPI Dashboard for Operations
Do you want to track your goals? Operations dashboard examples like KPI dashboards help you see if your team is doing well. BOE used FineReport to build KPI dashboards that show real-time numbers for each department. You can check production, quality, and customer service in one place. These operations dashboard examples help you find problems before they get worse.
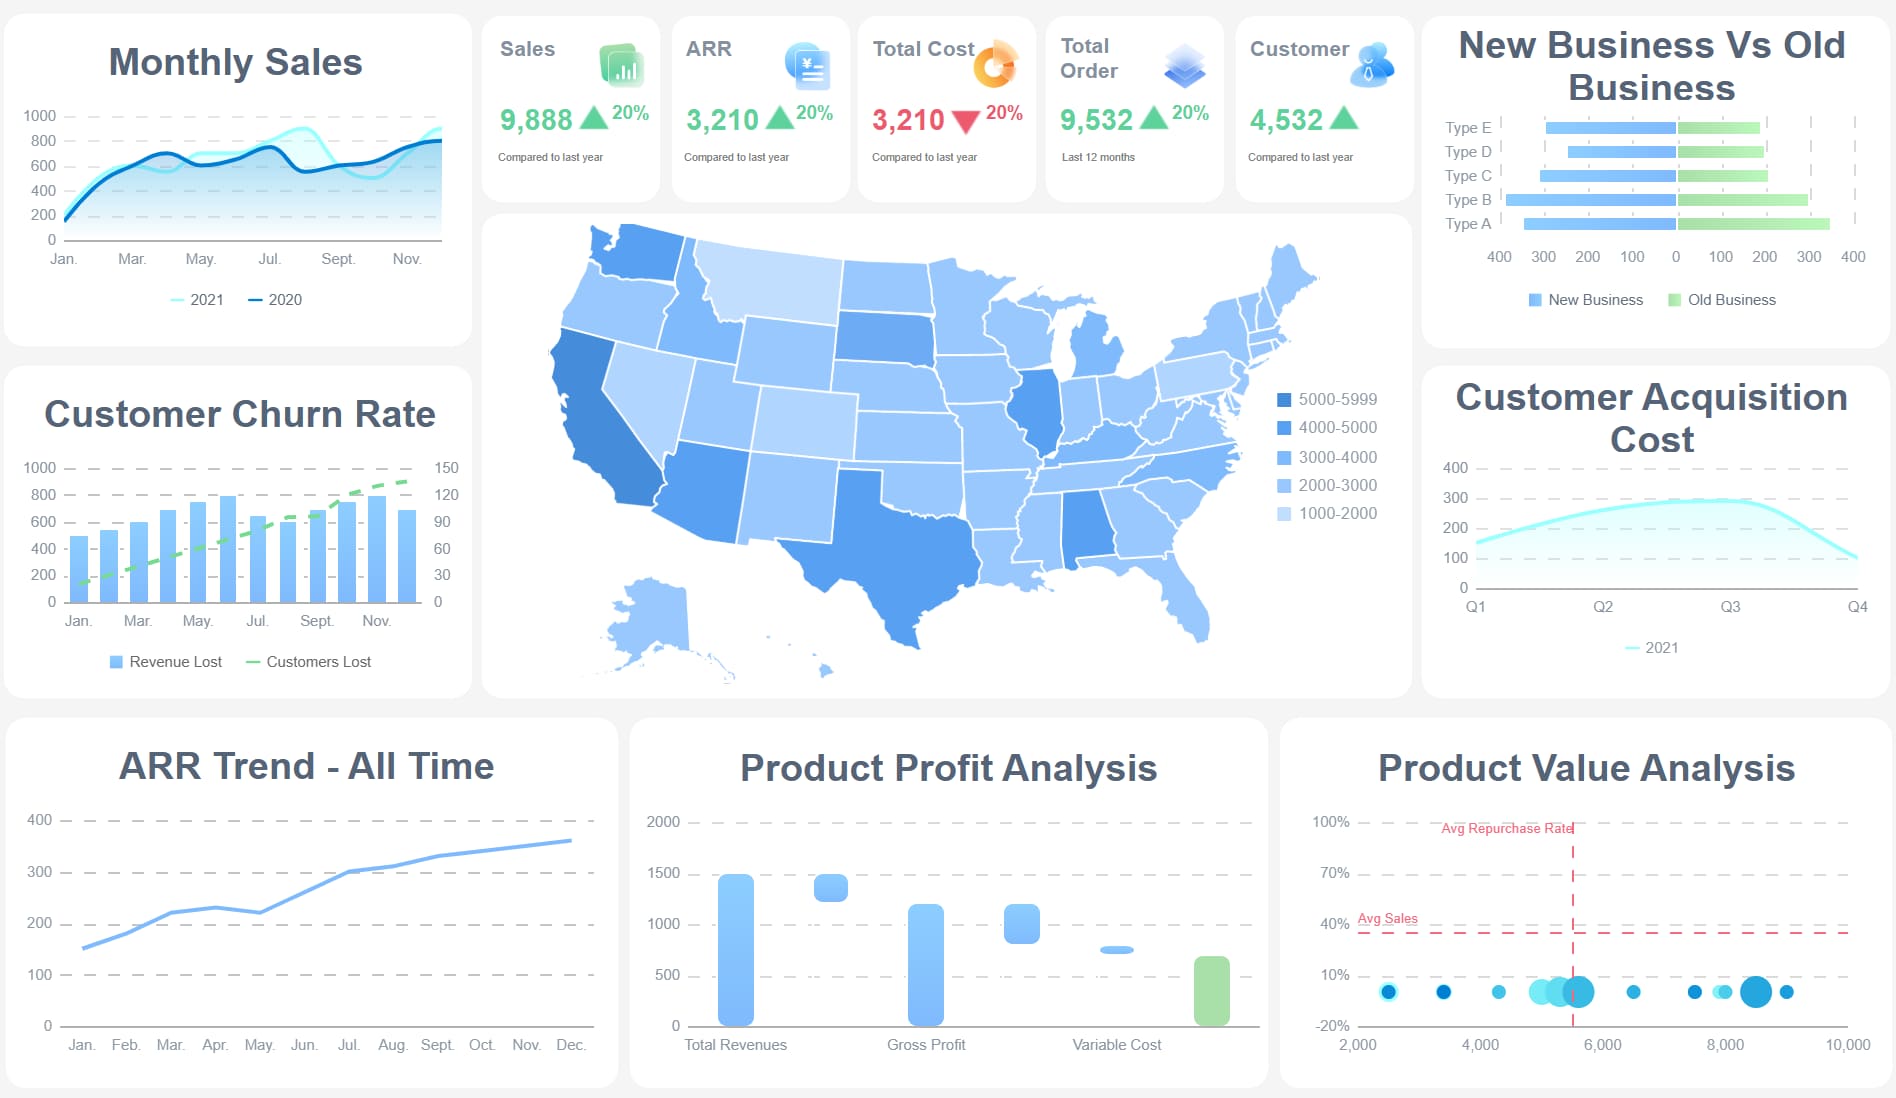
Financial Dashboard for Analysis
Money is important. Operations dashboard examples for finance help you see where your cash goes. FineReport lets you build a financial dashboard that connects to all your data. You can look into costs, profits, and trends. BOE used these dashboards to cut inventory costs and work better. Here is what you get with these operations dashboard examples:
| Feature/Capability | Description |
|---|---|
| Interactive Web Dashboards | Explore numbers and trends with a click. |
| Visual Report Creation | See your data in charts and graphs, not just tables. |
| Data Connectivity | Pull numbers from any system for a full view. |
| Parameterization and Filtering | Focus on what matters most to you. |
| Drill-Down Capabilities | Dive deep into details when you need answers. |
You can use these operations dashboard examples to make better choices and keep your business strong.
Key Features and Strategic Advantages
Customization and Integration
FineReport dashboard software lets you make dashboards that fit your business. You can change dashboards to match what your team likes. The drag-and-drop tool is simple for anyone to use. You do not need much training to start. You can set up quick links to your favorite reports. You get alerts when something important changes. This helps you keep track of your work.
Here’s how customization helps you:
| Feature | Benefit |
|---|---|
| Customizable Portals | Change content so it is easier to find |
| Quick Access | Get to important data fast |
| Dynamic Notifications | Get alerts when reports or data change |
| Drag-and-Drop Interface | Make dashboards fast and save time |
FineReport dashboard software connects to many databases. You can bring in data from different places. You see all your information in one dashboard. This makes your analytics better. It helps you make smarter choices for your business.
| Capability | Description |
|---|---|
| Database Connection | Connect to databases easily |
| Report Generation | Make reports using SQL |
| Data Source Integration | Bring data together from many places |
| Custom Development | Add analytics to your own tools |
Real-Time Data and Automation
You want to know what is happening right now. FineReport dashboard software shows you real-time performance. You can watch your business as things happen. Real-time pictures help you see problems and fix them fast. The software can make reports by itself, so you always have the newest numbers.
With real-time dashboards, you do not wait for updates. You can check KPIs, sales, and supply chain data right away. This is good for businesses that need to act fast. FineReport works with power bi, so you can add more data to your dashboards.
Mobile and 3D Dashboards
You do not have to be at your desk to see your dashboards. FineReport dashboard software lets you use your phone or tablet. You can check your business from anywhere. The mobile dashboards are easy to use and show real-time data.
FineReport also gives you 3D views. You can see your business in a new way. 3D dashboards help you spot trends and patterns. This helps you work better and make smart choices. You can connect your dashboards to power bi for even more data.
How to Choose and Implement Templates
Assessing Business Needs
Before you pick a dashboard, think about your goals. Decide what your team needs to know. Ask what questions the dashboard should answer. Look at your data and compare it to old numbers. This helps you see if things are better or worse. Keep your dashboard simple so you can check it fast. Each chart or number should help you act or learn more.
- Decide what your dashboard is for.
- Compare numbers to old results for context.
- Make it easy to understand quickly.
- Use visuals that help you take action.
Customizing with FineReport
Your dashboard should match your business needs. FineReport lets you change dashboards in many ways. You can connect to any database, even power bi. You can make templates that fit your team. The drag-and-drop tool makes building dashboards easy. Here is what you can do:
| Feature | Description |
|---|---|
| Flexible customization | Make dashboards for any operations need. |
| Database integration | Connect to power bi and other databases for live data. |
| Customized report templates | Design templates that look like your business. |
| Fixed-format analytical reports | Link charts and reports for more details. |
| Data visualization | Switch graphs to see trends from all sides. |
You can start with power bi dashboards and add your own ideas with FineReport. This way, your dashboard always shows what matters most.
Best Practices for Implementation
When you use a new dashboard, keep it simple. Use tools like power bi and FineReport to set up fast. Pick templates for areas like finance or HR. Change charts, KPIs, and layouts to fit your team. Make sure your team can use the dashboard without much training. The goal is to help everyone make smart choices fast.
- Use power bi and FineReport for quick setup.
- Pick templates that fit your business.
- Change things so it works for your team.
- Teach your team to use the dashboard every day.
With the right dashboard and power bi, your operations can run smoothly. You can make better choices every day.
Business Dashboard Comparison Table
Do you want your operations to work well in 2026? You should use the right dashboard templates. These dashboards help you match your work with business goals. They help you find problems quickly. You can also stay ahead of other companies.
| Benefit | Description |
|---|---|
| Strategic Alignment | Connects operations to business targets |
| Real-time Insights | Shows what’s happening in your operations now |
| Competitive Advantage | Lets you act faster than others |
FineReport give you smart tools. These tools help you make better choices and run things stronger. Are you ready to begin? Choose a dashboard that fits your work. Focus on what is important. You can also look at Databox or OKR templates for more ideas.


FAQ

The Author
Lewis
Senior Data Analyst at FanRuan
Related Articles

Portfolio Reporting for PMOs: 9 Executive Metrics Every Weekly Portfolio Dashboard Should Include
Weekly portfolio reporting should help executives answer three questions fast: Are we delivering the right initiatives, are we putting outcomes at risk, and what decisions need leadership this week? For PMOs, that means
Yida Yin
Jul 01, 2026

How to Build an Investment Portfolio Reporting Dashboard for Executives: KPIs, Benchmarks, and Drill-Down Views
Investment portfolio reporting for executives is not about showing every holding, transaction, and chart your investment team can produce. It is about giving CEOs, CFOs, CIOs, boards, and investment committees a fast, re
Yida YIn
Jun 25, 2026

12 KPI Reporting Examples for Executive Dashboards: What to Show in Weekly, Monthly, and Quarterly Reviews
Executive leaders do not need more data. They need decision ready $1 examples that match how often they review the business and what actions they are expected to take. A weekly $1 should surface fast moving risks and per
Yida YIn
Jun 25, 2026