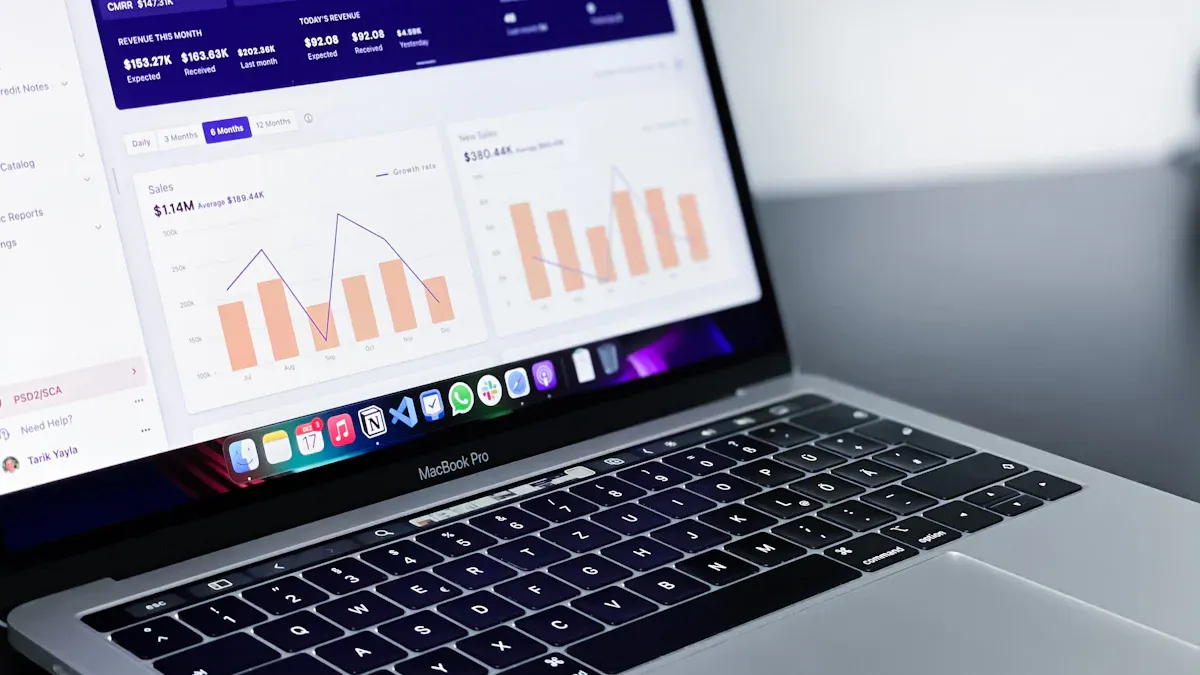
Sales dashboard software gives your business the power to turn data into actionable insights. You need real-time analytics to make fast decisions and drive performance. The shift toward self-service BI lets you access and analyze data independently, reducing your reliance on IT and speeding up reporting. FineBIstands out by enhancing data accessibility and empowering users with autonomy. As you compare top solutions, you will find that the right software helps your business respond quickly and confidently to changing market demands.
Top Sales Dashboard Software for Businesses
Sales dashboard software gives you a unified platform to visualize, track, and analyze your business’s sales performance. When you use dashboard software, you can bring together data from multiple sources, monitor key metrics, and make informed decisions faster. This type of software helps you transform raw data into actionable insights, making it essential for any business that wants to stay competitive.
Salesdashboard software refers to specialized dashboard software designed to help you manage, analyze, and present sales data in real time. With dashboard software, you can create interactive dashboards that display sales trends, pipeline health, and team performance. The right dashboard software will let you connect to various data sources, automate reporting, and support your team with up-to-date analytics.
When comparing dashboard software, you should consider several criteria:
Criteria
Description
Performance
Speed of data processing and reliability under heavy loads
Customer Support
Responsiveness and expertise of support teams
User Reviews
Real-world feedback on dashboard software usability and satisfaction
Cost
Upfront price and long-term value of dashboard software investment
FineBI stands out as a leading sales dashboard software. You can use FineBI to access real-time analytics with a no-code interface. The drag-and-drop dashboard builder makes it easy for you to create complex visualizations. FineBIintegrates ETL tools, supports mobile access, and offers elastic cloud deployment. Its in-memory computing engine processes large data sets quickly. Enterprise-grade security features, such as role-based access control, ensure your data stays protected.
Tableau is a popular dashboard software known for its advanced data visualization capabilities. You can use Tableau to create interactive dashboards with a wide range of chart types. The software handles large data volumes and offers strong customization. However, you may find the learning curve steep for advanced features, and the cost can be high for some businesses.
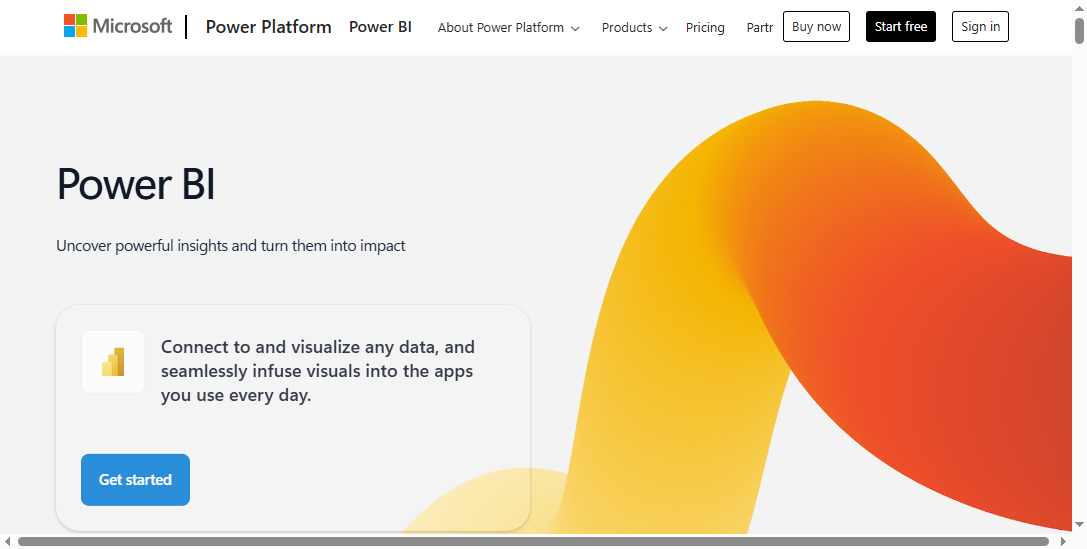
Power BI is Microsoft’s dashboard software solution. It integrates well with Microsoft products and offers strong AI features. You can use Power BI for cost-effective analytics at scale. The dashboard software is familiar to Excel users, but advanced analytics may require learning DAX formulas.
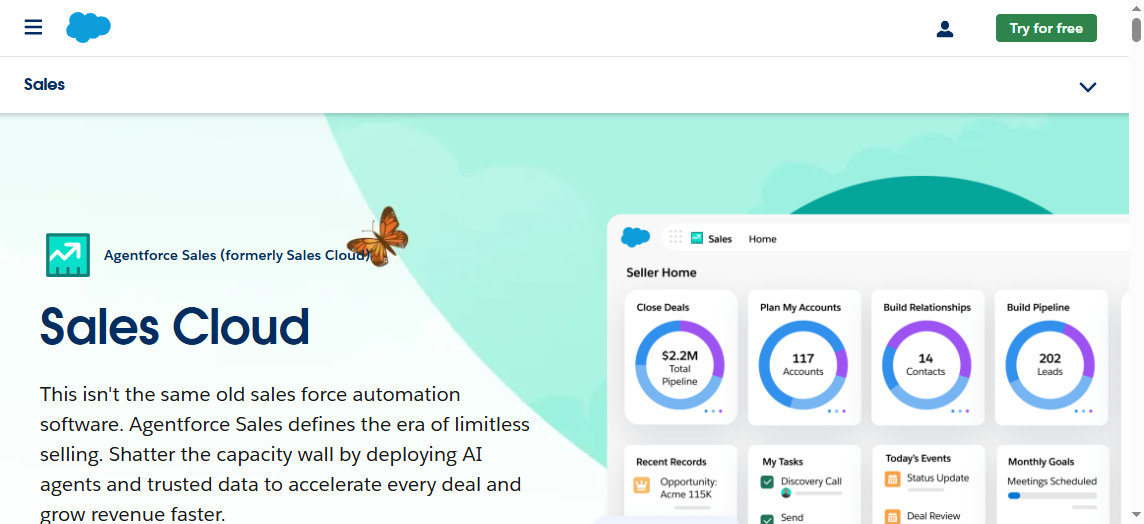
Salesforce Sales Cloud provides dashboard software tailored for sales teams. You can generate real-time reports, customize dashboards for different roles, and schedule automated reports. The software supports mobile access and collaborative analysis, helping your team stay aligned.
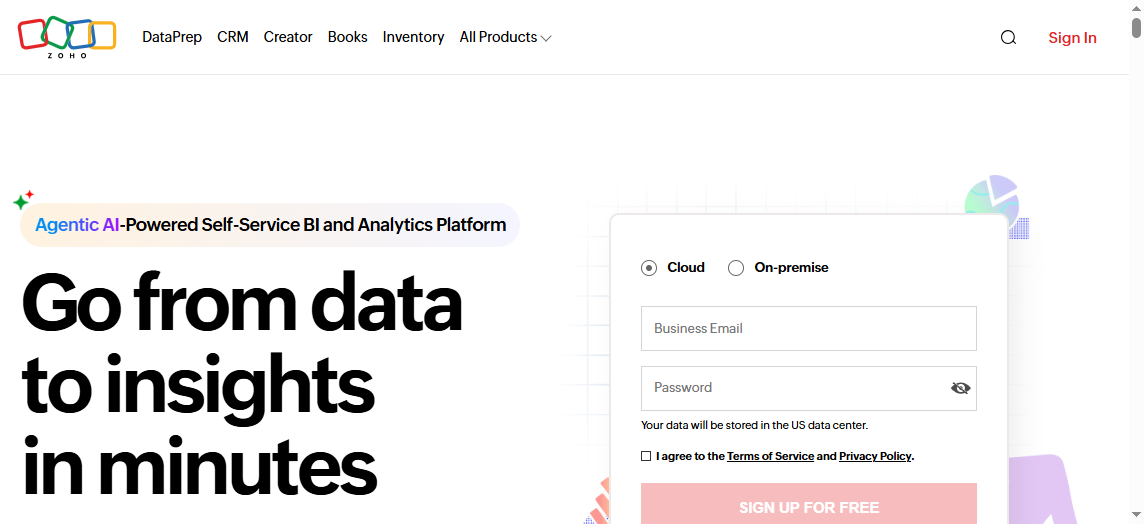
Zoho Analytics offers dashboard software with real-time data synchronization and auto-updating dashboards. You can connect to over 500 data sources and use AI-powered analytics to forecast trends. Drill-down capabilities and instant insights help you respond quickly to changes.
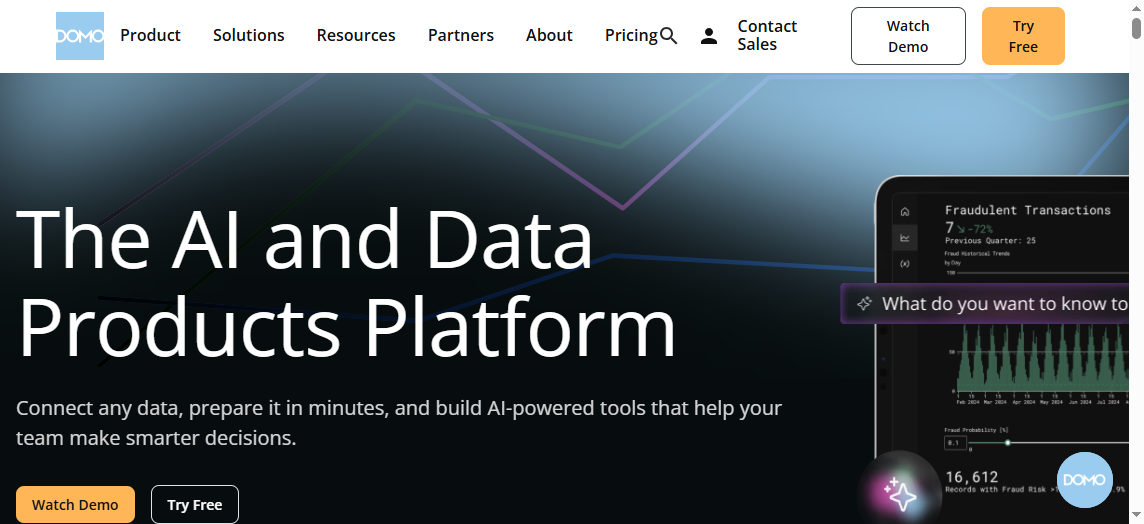
Domo is dashboard software designed for quick deployment and high adoption rates. You can connect to over 1,000 data sources without coding. The software supports collaboration, handles large data queries, and scales to manage vast amounts of data. Built-in AI tools help automate reporting and trend forecasting.
Why Sales Dashboard Software Matters
Sales dashboard software gives you the ability to manage data, track performance, and gain real-time insights. The keyword "data" refers to the information your business collects from sales activities, customer interactions, and market trends. When you use analytics, you transform raw data into actionable insights that guide your decisions. Real-time data means you see updates instantly, allowing you to respond quickly to changes in performance.
Real-time analytics in sales dashboard software lets you monitor performance as it happens. You do not need to wait for manual reports or outdated spreadsheets. Instead, you see live data that reflects your team’s current activities. This approach helps you identify trends, spot problems, and adjust your strategy before issues grow. Real-time insights keep your business agile and competitive.
Real-Time Data and Analytics
Real-time data and analytics are essential for modern sales teams. You can track performance instantly and make decisions based on the latest information. The table below shows how real-time data impacts your business:
Benefit
Description
Real-Time Insights
Immediate data tracking allows for quick shifts in response to buyers’ needs and data-driven decisions.
Increased Competitive Advantage
Businesses can spot market trends before competitors, leading to better engagement and revenue growth.
Improved Risk Management
More accurate forecasts and risk predictions help in making insightful financial decisions.
Streamlined Processes
Data analytics and AI contribute to cost-saving success and operational efficiency.
You can use real-time analytics to monitor KPIs, eliminate inefficiencies, and mitigate risks. This capability empowers you to react immediately to market shifts and operational changes.
Data-driven decision making means you base your choices on facts, not assumptions. Sales dashboard software provides accurate data, helping you forecast sales, prioritize leads, and improve team efficiency. The table below highlights the measurable benefits:
Benefit
Description
Enhanced Sales Forecasting
Data-driven forecasting improves accuracy by analyzing historical data patterns and trends.
Increased Team Efficiency
Teams can focus on high-impact activities, such as prioritizing morning calls with a 40% success rate.
Competitive Edge
Companies using data-driven strategies are 23% more likely to exceed revenue goals than competitors.
When you use actionable insights from your dashboard, you achieve higher sales productivity and better conversion rates. Data-driven strategies help you focus on quality leads and optimize your sales process.
Performance tracking and KPI monitoring are critical features of sales dashboard software. You can customize dashboards to display real-time data from multiple sources. Automated KPI reporting keeps your team updated on progress. The table below outlines key features:
Key Feature
Description
Customizable dashboards
Allows users to create dashboards with over 15 widgets that display real-time data from various sources.
Automated KPI reporting
Generates and distributes performance updates automatically at scheduled intervals.
Cross-departmental tracking
Connects high-level metrics to individual tasks, ensuring alignment across the organization.
Workflow integration
Links daily tasks directly to strategic KPIs, bridging the gap between execution and measurement.
AI-powered insights
Identifies performance trends and suggests optimizations based on work patterns.
No-code customization
Enables teams to build KPI tracking systems without needing technical skills, adaptable to any business model.
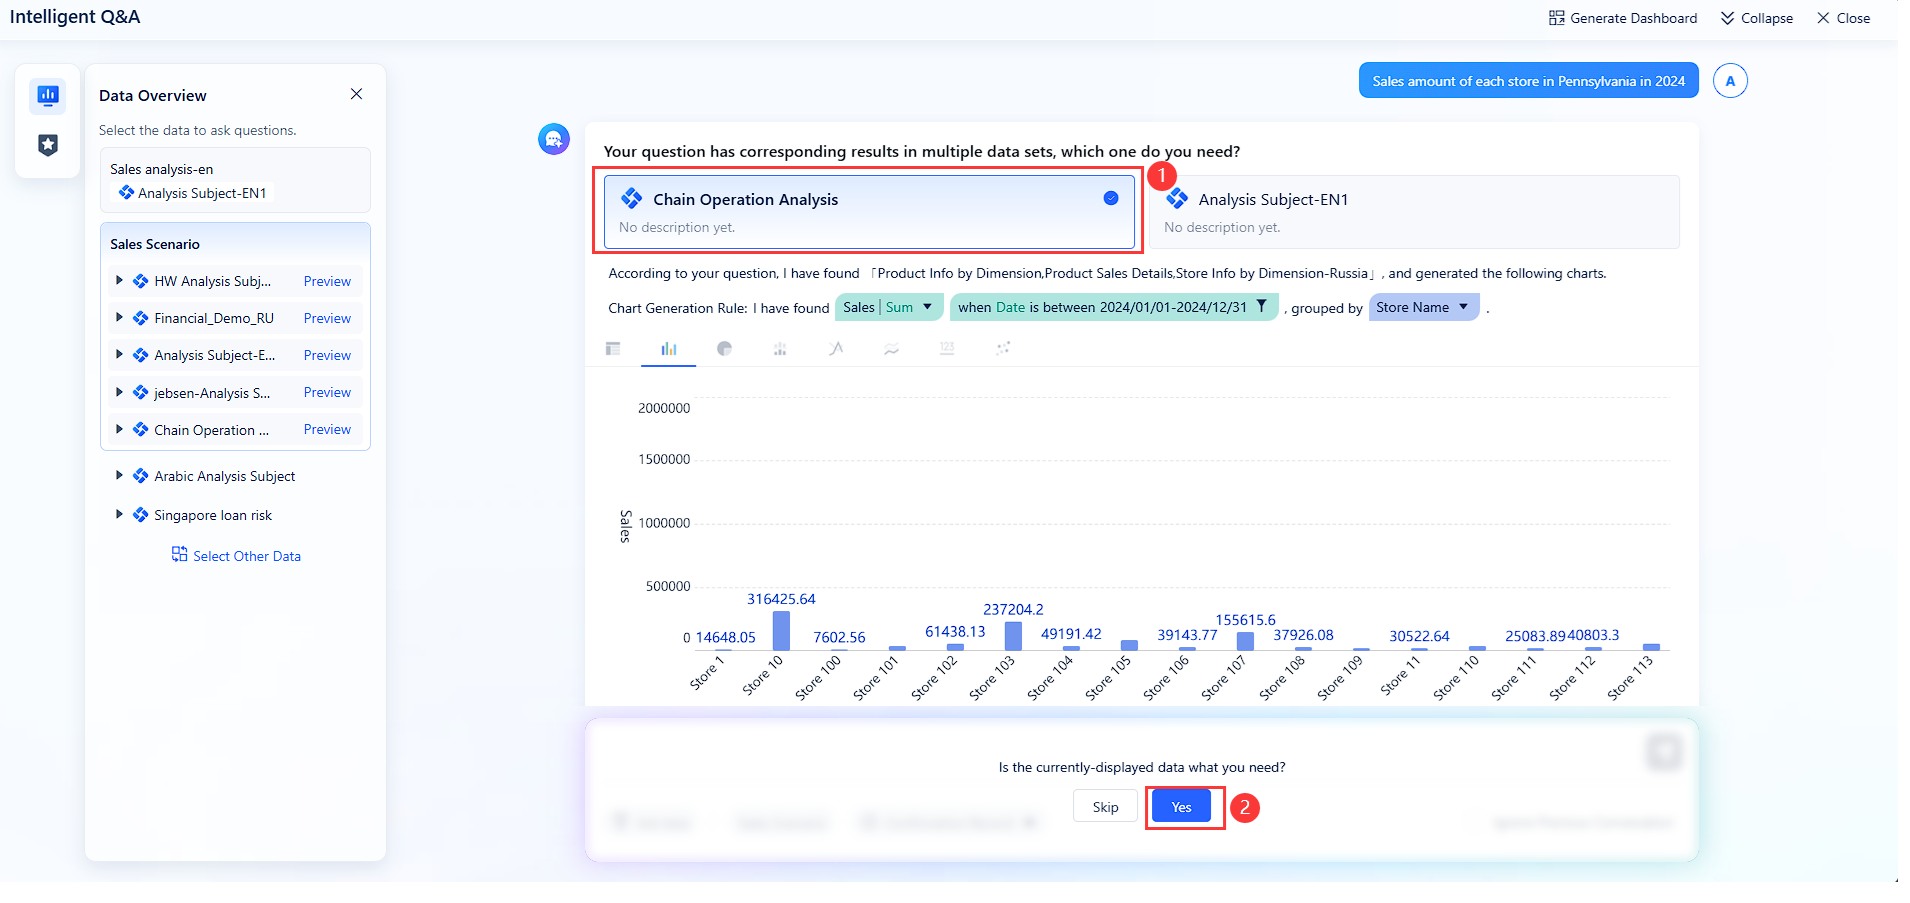
FineBI excels in these areas by offering real-time data integration, advanced analytics, and customizable dashboards. You can track performance, monitor KPIs, and share actionable insights across your organization. FineBI’s self-service features allow you to build dashboards without technical skills, making data accessible and useful for every team member.
FineBI's Real Time Multi Source Data Integration Feature
Sales dashboard software helps you transform data into actionable insights. You use dashboards to visualize metrics, track performance, and make informed decisions. The keyword "dashboard" refers to a digital interface that displays key metrics and trends in real time. You rely on dashboards to monitor sales activities, analyze customer behavior, and optimize your strategy.
Data is the foundation of every dashboard. You collect data from sales transactions, customer interactions, and market trends. The dashboard software processes this data and presents it as visualizations, such as charts and graphs. You gain insights by interpreting these visualizations and identifying patterns. Actionable insights guide your decisions and help you improve sales outcomes.
Data Integration and Connectivity
Data integration is a critical feature in dashboard software. You need to connect multiple data sources, such as CRM systems, spreadsheets, and cloud platforms. Integration ensures that your dashboard displays accurate and up-to-date metrics. You can automate data imports and synchronize reporting across departments.
FineBI excels in data integration. You connect to over 60 data sources, including relational databases, big data platforms, and APIs. FineBIsupports incremental updates, so your dashboard always reflects the latest data. You use drag-and-drop tools to build datasets, join tables, and apply formulas. This process streamlines reporting and reduces manual effort.
Other platforms offer strong integration capabilities. Tableau connects to cloud and on-premises data sources. Power BI integrates with Microsoft products and third-party services. Salesforce Sales Cloud links CRM data with external systems. Domo supports over 1,000 connectors for seamless integration. Zoho Analytics provides real-time synchronization and auto-updating dashboards.
Platform
Integration Capabilities
Data Sources Supported
Real-Time Updates
FineBI
60+ connectors, incremental updates
Databases, APIs, files
Yes
Tableau
Cloud/on-premises, live/extracts
Databases, cloud, files
Yes
Power BI
Microsoft ecosystem, third-party
Databases, Excel, cloud
Yes
Salesforce Cloud
CRM, external systems
CRM, ERP, APIs
Yes
Domo
1,000+ connectors, real-time sync
Cloud, databases, APIs
Yes
Zoho Analytics
Real-time sync, auto-update
500+ sources, files, APIs
Yes
You benefit from robust integration because you can consolidate data from different departments. This approach improves reporting accuracy and ensures that your dashboard provides a unified view of sales metrics.
Customization and Automation
Customization lets you tailor dashboards to your business needs. You choose which metrics to display, select visualization types, and arrange components for clarity. Automation streamlines reporting by scheduling updates, sending alerts, and triggering workflows based on data changes.
FineBIoffers a drag-and-drop dashboard builder. You customize layouts, add charts, and apply filters without coding. You automate reporting by setting up scheduled data refreshes and alerts for key metrics. FineBI’s workflow supports self-service customization, so you adapt dashboards as your business evolves.
Other platforms provide advanced customization and automation:
monday CRM: You design workflows and automate data entry with intuitive customization and AI features.
Salesforce Sales Cloud: You customize dashboards for complex sales processes and use predictive insights to automate reporting.
HubSpot Sales Hub: You create custom reports and use integrated coaching tools for unified customer insights.
Zoho CRM: You build customizable dashboards and leverage AI assistance for small to medium businesses.
Pipedrive: You manage visual sales pipelines with customizable tracking and AI-powered forecasting.
You gain flexibility by customizing dashboards to match your sales strategy. Automation reduces manual reporting and ensures that you receive timely updates on critical metrics.
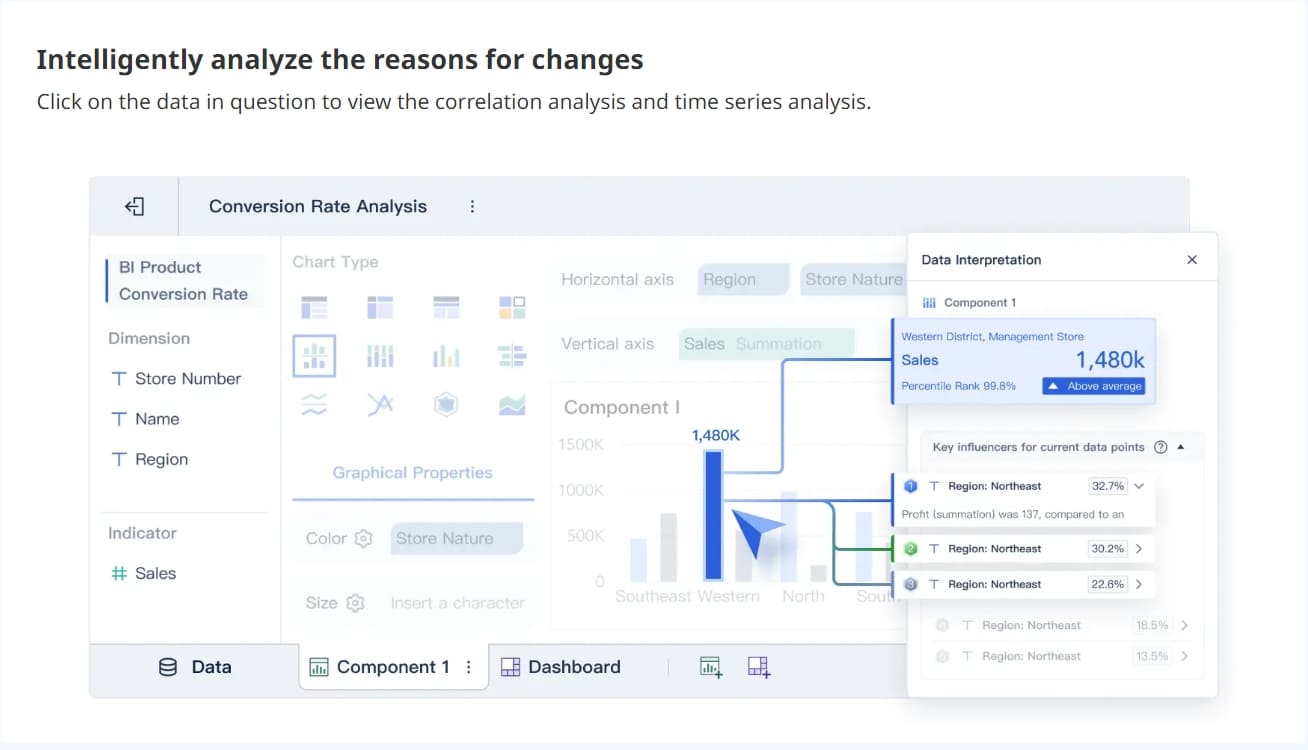
AI and predictive analytics transform how you use dashboard software. AI analyzes data patterns, forecasts sales trends, and suggests optimal actions. Predictive analytics helps you anticipate demand, identify risks, and improve decision-making.
FineBI integrates AI-driven analytics. You use interactive charts and real-time updates to explore data. FineBI’s predictive analytics forecast sales, demand, and risks. The platform also provides prescriptive analytics, recommending actions based on data insights. You receive alerts when metrics reach critical thresholds, enabling proactive management.
Competitors offer similar AI features:
Tool
Visualization Features
Dashboard Features
Predictive Analytics
Unique Feature
FineBI
Interactive charts, real-time
Custom dashboards, mobile
Yes
Alerts
Power BI
Collaboration workspaces
Scheduled reports
Yes
Copilot for AI
Tableau
Natural language queries
Drag-and-drop customization
Yes
Advanced visuals
DataRobot
No
Yes
Yes
AutoML for models
Domo
Social features
Buzz chat
No
Real-time collaboration
FineBIstands out with its conversational analytics module, FineChatBI. You ask questions in plain language and receive actionable insights instantly. This feature lowers the barrier to data access and accelerates reporting. DataRobot and H2O.ai also enhance decision-making with predictive and prescriptive analytics.
You use AI to uncover hidden trends, forecast future sales, and optimize your strategy. Predictive analytics empowers you to make data-driven decisions and achieve better sales outcomes.
Pricing is a key factor when choosing dashboard software. You evaluate the cost against the value provided by features, integration, and reporting capabilities. Most platforms offer tiered or custom pricing models based on user count and business needs.
Software
Pricing Model
Starting Price (per user/month)
Key Features
DealHub
Tiered
$50
CPQ integration, contract management
Pitcher
Tiered
$25
Mobile-first approach, analytics
Mediafly
Tiered
$500
Interactive content, ROI calculation tools
Highspot
Custom
N/A
Custom pricing based on team size
Showpad
Custom
N/A
Custom pricing based on team complexity
Bigtincan
Custom
N/A
Custom pricing based on team needs
80% of businesses consider pricing a key factor when selecting digital sales room software.
Each dashboard platform offers unique features that impact sales performance. Mediafly can increase sales revenue by up to 20%. DealHub can reduce the sales cycle by up to 30%. You should assess the value of integration, reporting, and actionable insights when comparing pricing options.
FineBI provides enterprise-grade features at a competitive total cost of ownership. You benefit from scalable integration, advanced reporting, and AI-powered analytics without hidden fees. FineBI supports thousands of users and processes massive data volumes efficiently. You maximize value by choosing a dashboard solution that aligns with your business goals and budget.
Pros, Cons, and Best Use Cases of Sales Dashboard Software
When you usedashboard software, you rely on data to measure sales performance and guide your decisions. Data refers to the information your business collects from sales activities, customer interactions, and market trends. A dashboard is a digital tool that displays this data in visual formats, helping you track performance and identify opportunities for improvement.
Performance is the outcome you achieve by analyzing data through your dashboard. You monitor sales results, team productivity, and business growth. The dashboard lets you see performance metrics in real time, so you can respond quickly to changes and optimize your strategy.
FineBI Pros and Ideal Scenarios
FineBI gives you powerful data integration and self-service dashboard creation. You can deploy FineBIindependently or integrate it with other systems. The table below shows the main advantages and disadvantages for each deployment method:
Deployment Method
Advantages
Disadvantages
Independent Deployment
Excellent performance; Stable environment
High server investment; Separate data processing and presentation
Integrated Deployment
Cost-effectiveness; All-in-one data workflow
Limited performance; Limited stability
You benefit most from FineBI when you need to manage large volumes of data, create dashboards without coding, and ensure high performance for enterprise-level reporting.
Tableau excels atdata visualization and interactive dashboard design. You use Tableau to analyze complex data sets and present performance trends with advanced charts. Tableau works best for businesses that prioritize visual analytics and need to share performance insights across teams.
Power BI Pros and Ideal Scenarios
Power BI integrates seamlessly with Microsoft products and automates dashboard reporting. You can analyze sales pipelines, compare actual performance against targets, and identify growth areas. Many sales departments use Power BI to reduce manual data refresh times and improve performance tracking.
Teleperformance created a B2B sales dashboard from Salesforce CRM using Power BI, focusing on leads and opportunities.
Automated reporting in Power BI saved 30 working hours per week by updating data daily.
Sales teams leverage Power BI to analyze pipelines and monitor performance against goals.
Salesforce Sales Cloud Pros and Ideal Scenarios
Salesforce Sales Cloud provides dashboards tailored for sales teams. You enhance sales processes, improve team productivity, and gain deeper insights into sales performance. Businesses seeking to optimize their sales workflow and monitor performance in real time find Salesforce Sales Cloud especially valuable.
Zoho Analytics Pros and Ideal Scenarios
Zoho Analytics offers user-friendly dashboards and strong data visualization. You collaborate with your team and integrate data from multiple sources. The table below highlights the main advantages and limitations for sales teams:
Advantages of Zoho Analytics
Limitations of Zoho Analytics
Excellent data visualization
Inadequate customer support
User-friendly features
Unclear documentation
Collaboration tools
Challenges with specific integrations
Extensive integration capabilities
Costly subscription model for larger teams
Zoho Analytics works well for small to medium businesses that need easy-to-use dashboards and collaborative performance tracking.
Domo Pros and Ideal Scenarios
Domo addresses advanced sales analytics needs with predictive models and real-time data access. You forecast outcomes, identify customer segments, and receive automated alerts for performance risks. Domo helps you analyze trends, make faster decisions, and improve operational efficiency.
AI and machine learning identify patterns in data and send automated alerts.
Real-time dashboard access lets you adjust operations and boost sales performance.
How to Choose KPI Dashboard Software
Kpi dashboard software helps you track, analyze, and visualize your key performance indicators in one place. When you use kpi dashboard software, you bring together data from different sources to monitor your business’s progress in real time. This software gives you a clear view of your sales, marketing, and operational performance, making it easier to make informed decisions.
You need to understandwhat kpi dashboard software means for your business. It is a tool that lets you set up dashboards to display your most important metrics. You can use it to measure key performance indicators, compare results over time, and share insights with your team. Kpi dashboard software simplifies complex data and turns it into actionable information.
Assessing Business Needs and Size
Choosing the right kpi dashboard software starts with understanding your business size and needs. Small businesses may need simple dashboards, while larger organizations require advanced features. The table below shows how business size affects your choice:
Aspect
Explanation
Scalability
As your business grows, your kpi dashboard software must handle more data.
Performance
Fast processing ensures your team gets timely insights.
Adaptability
The dashboard should fit your business’s changing needs.
Industry-Specific Requirements
Every industry has unique needs for kpi dashboard software. You should check if the software integrates with your existing systems and supports your industry’s key performance indicators. The table below highlights what to look for:
Requirement
Description
Compatibility
The software must work with your current tools and data sources.
Functionality
Look for features that match your industry’s reporting needs.
Scalability
Make sure the dashboard can grow with your business.
Tip: Ask if the vendor has experience with businesses like yours and if the platform meets compliance standards.
Budget and ROI
Budget plays a big role inselecting kpi dashboard software. You want a solution that fits your budget but also delivers strong return on investment. Look for cost efficiency, easy customization, and features that help you get the most value from your data.
Scalability and Future-Proofing
Your kpi dashboard software should support your business as it grows. Look for features like modular architecture, real-time data synchronization, and performance consistency. The table below lists important scalability features:
Feature
Description
Cost Efficiency
Saves time and money as your needs expand.
Performance Consistency
Keeps dashboards running smoothly as data grows.
Growth Enablement
Supports more users and larger data sets.
Competitive Advantage
Helps your business stay ahead as you scale.
FineBI stands out as a kpi dashboard software solution for business-led teams. You get scalable governance, hybrid data environment support, and robust integration. FineBIadapts to your needs, making it a strong choice for organizations focused on growth and data-driven decision-making.
Implementation and Data Challenges in Sales Dashboard Software
Implementation and Data Challenges refer to the obstacles you face when deploying sales dashboard software in your business. These challenges can affect how you migrate data, train users, and customize the platform to fit your needs. Understanding Implementation and Data Challenges helps you prepare for a smooth transition and maximize the value of your dashboard software.
When you start using sales dashboard software, you encounter Implementation and Data Challenges at every stage. You must move data from old systems, teach your team how to use new tools, and adjust dashboards to match your business goals. Addressing these challenges ensures your dashboard software delivers accurate insights and supports your decision-making.
Data Migration and Integration
Data Migrationand Integration are critical parts of Implementation and Data Challenges. You need to transfer data from legacy systems and connect new sources to your dashboard software. Common challenges include error management, scalability, and tool sprawl. Missing data can cause business risks and delay financial reporting. Solutions that cannot handle high data volumes may disrupt operations during busy periods. Using too many integration tools increases management overhead and costs.
Challenge
Business Impact
Solution
Inadequate error management
Missing data leads to business risks and delays in financial reporting.
Use dedicated data integration platforms with built-in error management and proactive monitoring.
Scalability issues
Solutions that fail under high data volumes can disrupt operations during peak times.
Conduct load testing with production-scale data and implement platforms with elastic scaling.
Tool sprawl
Fragmented integration landscape increases management overhead and costs.
Standardize tools across departments to reduce complexity and improve governance.
FineBIsimplifies Data Migration and Integration by offering over 60 connectors and supporting incremental updates. You can unify data from multiple sources and automate error management, which reduces risks and improves reporting accuracy.
User Training and Adoption form another part of Implementation and Data Challenges. You must help your team learn how to use dashboard software effectively. Training programs should focus on practical tasks, such as building dashboards and interpreting data. Adoption increases when users see immediate benefits, like faster reporting and easier access to insights. FineBI’s intuitive drag-and-drop interface makes training simple and encourages user engagement.
Tip: Start with short tutorials and hands-on workshops to boost confidence and speed up adoption.
Customization and Support
Customization and Support address the final aspect of Implementation and Data Challenges. You need to tailor dashboards to your business requirements and ensure ongoing support. Customization lets you choose metrics, adjust layouts, and automate alerts. Reliable support helps you solve technical issues quickly. FineBIprovides flexible customization options and responsive support, so you can adapt dashboards as your business evolves and maintain high performance.
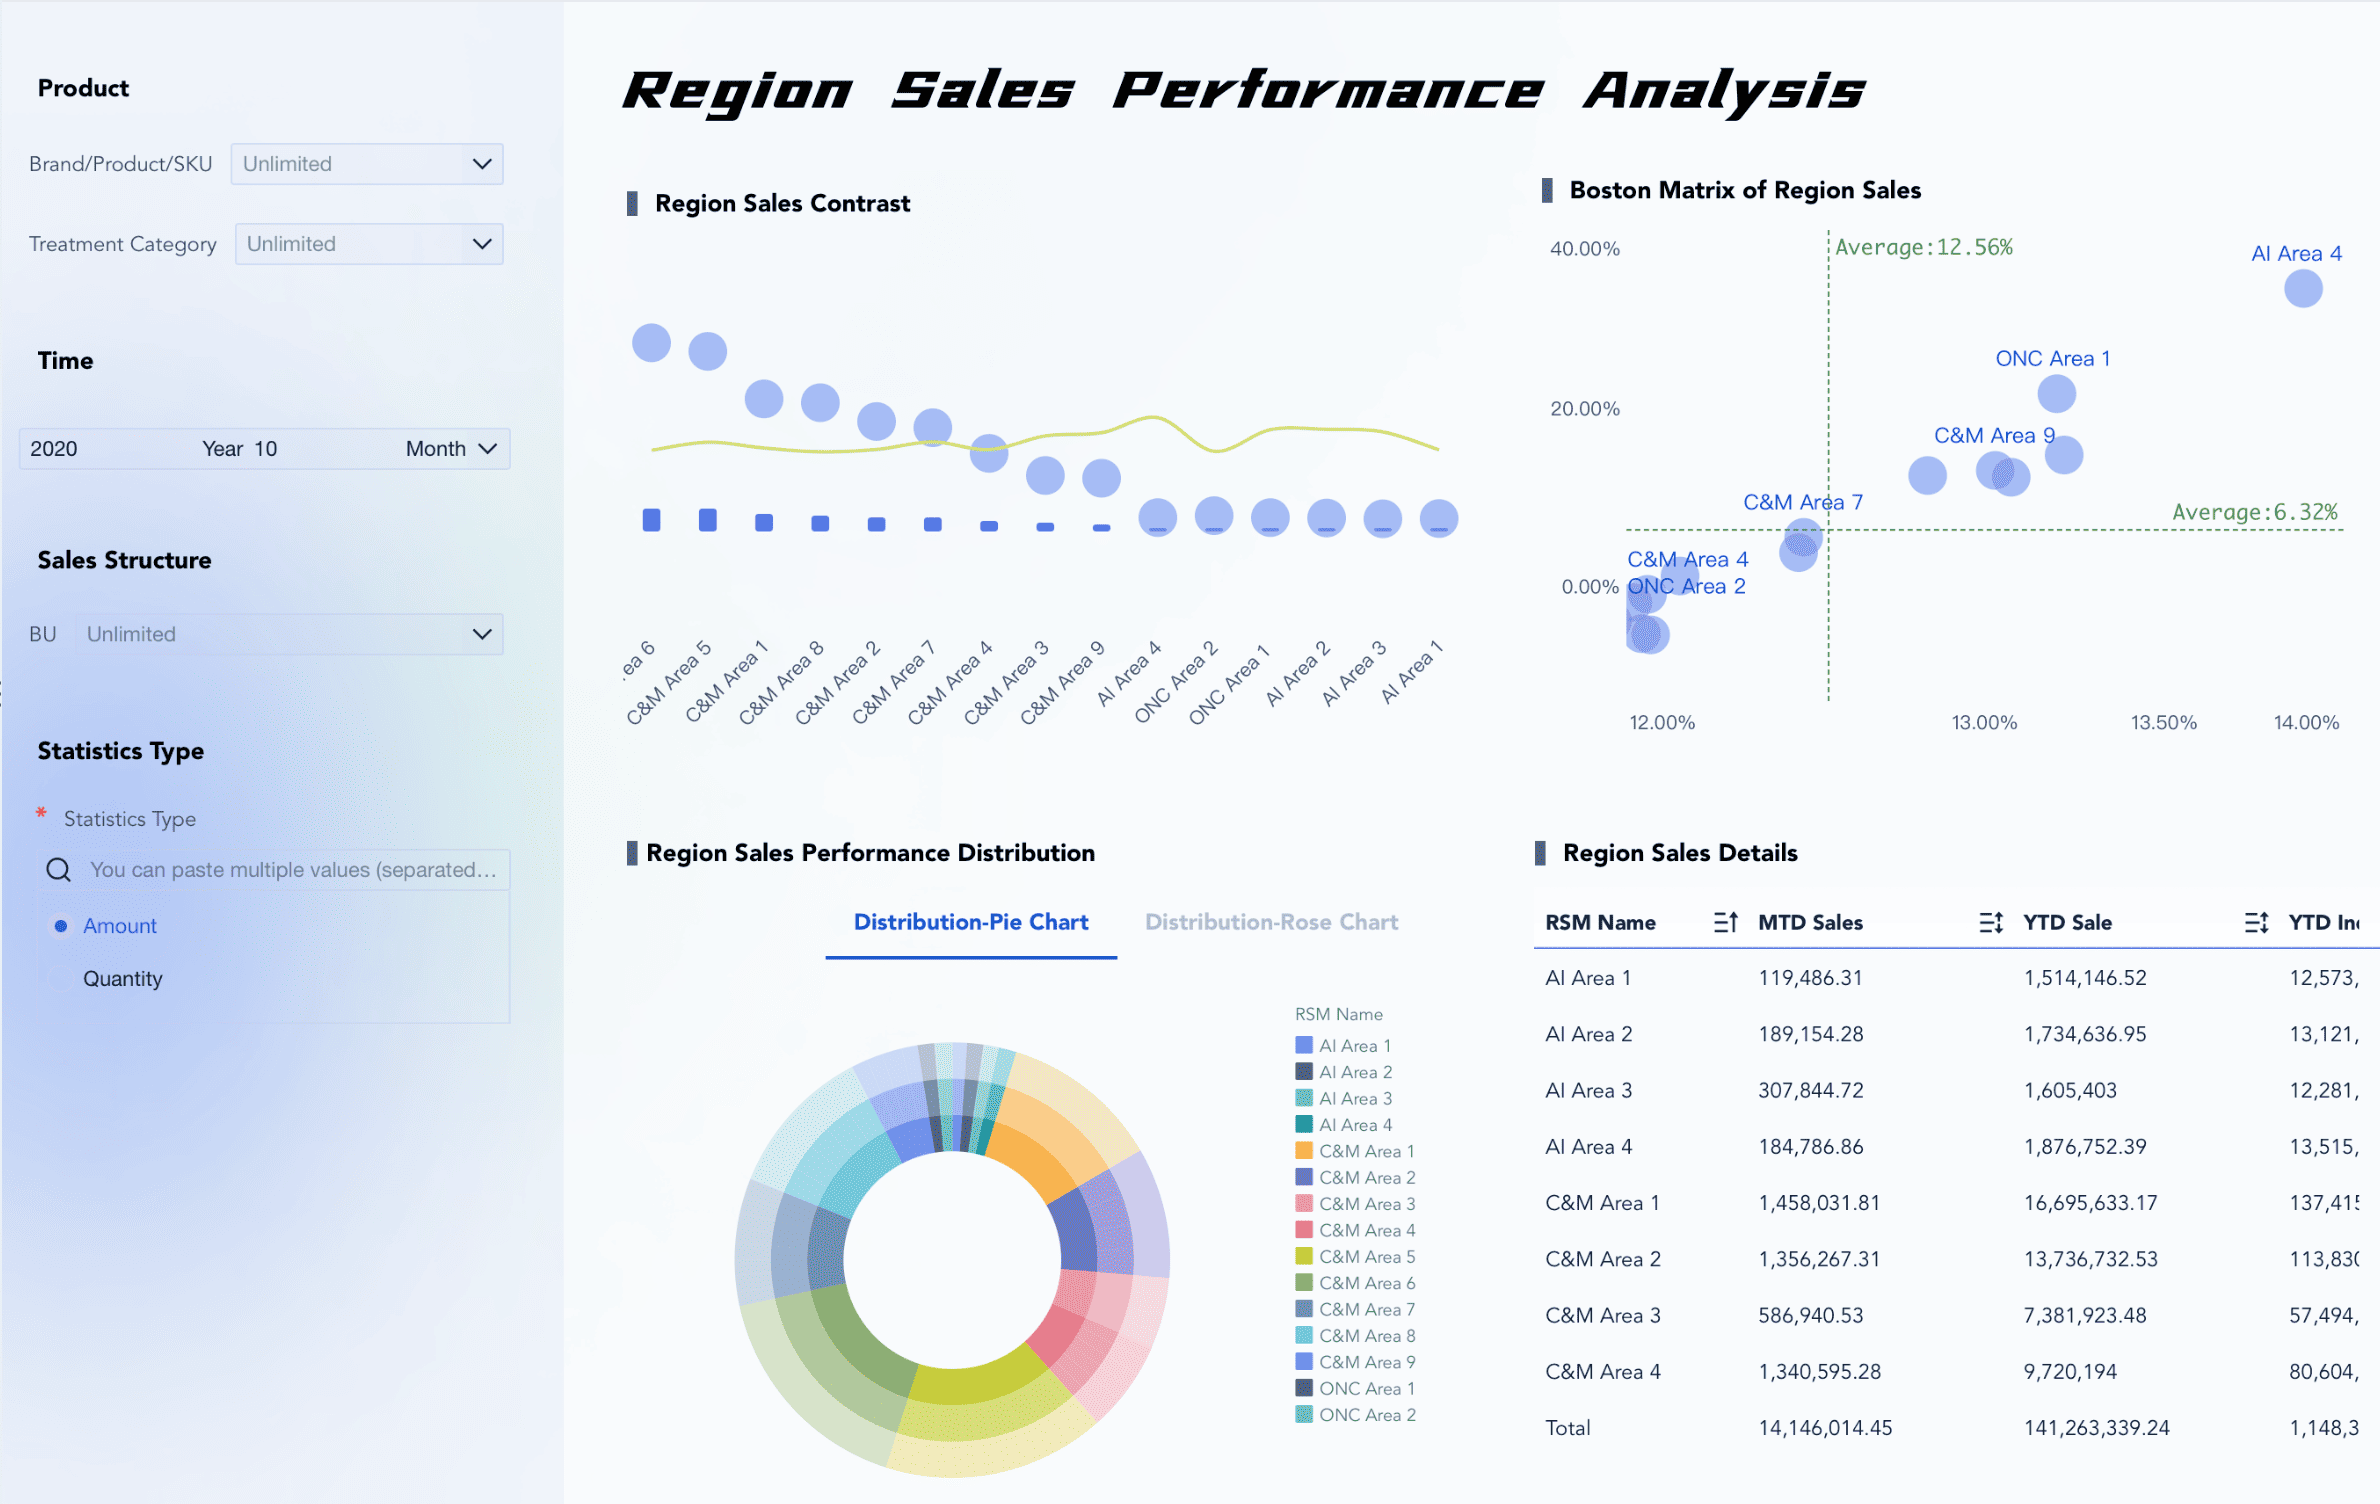
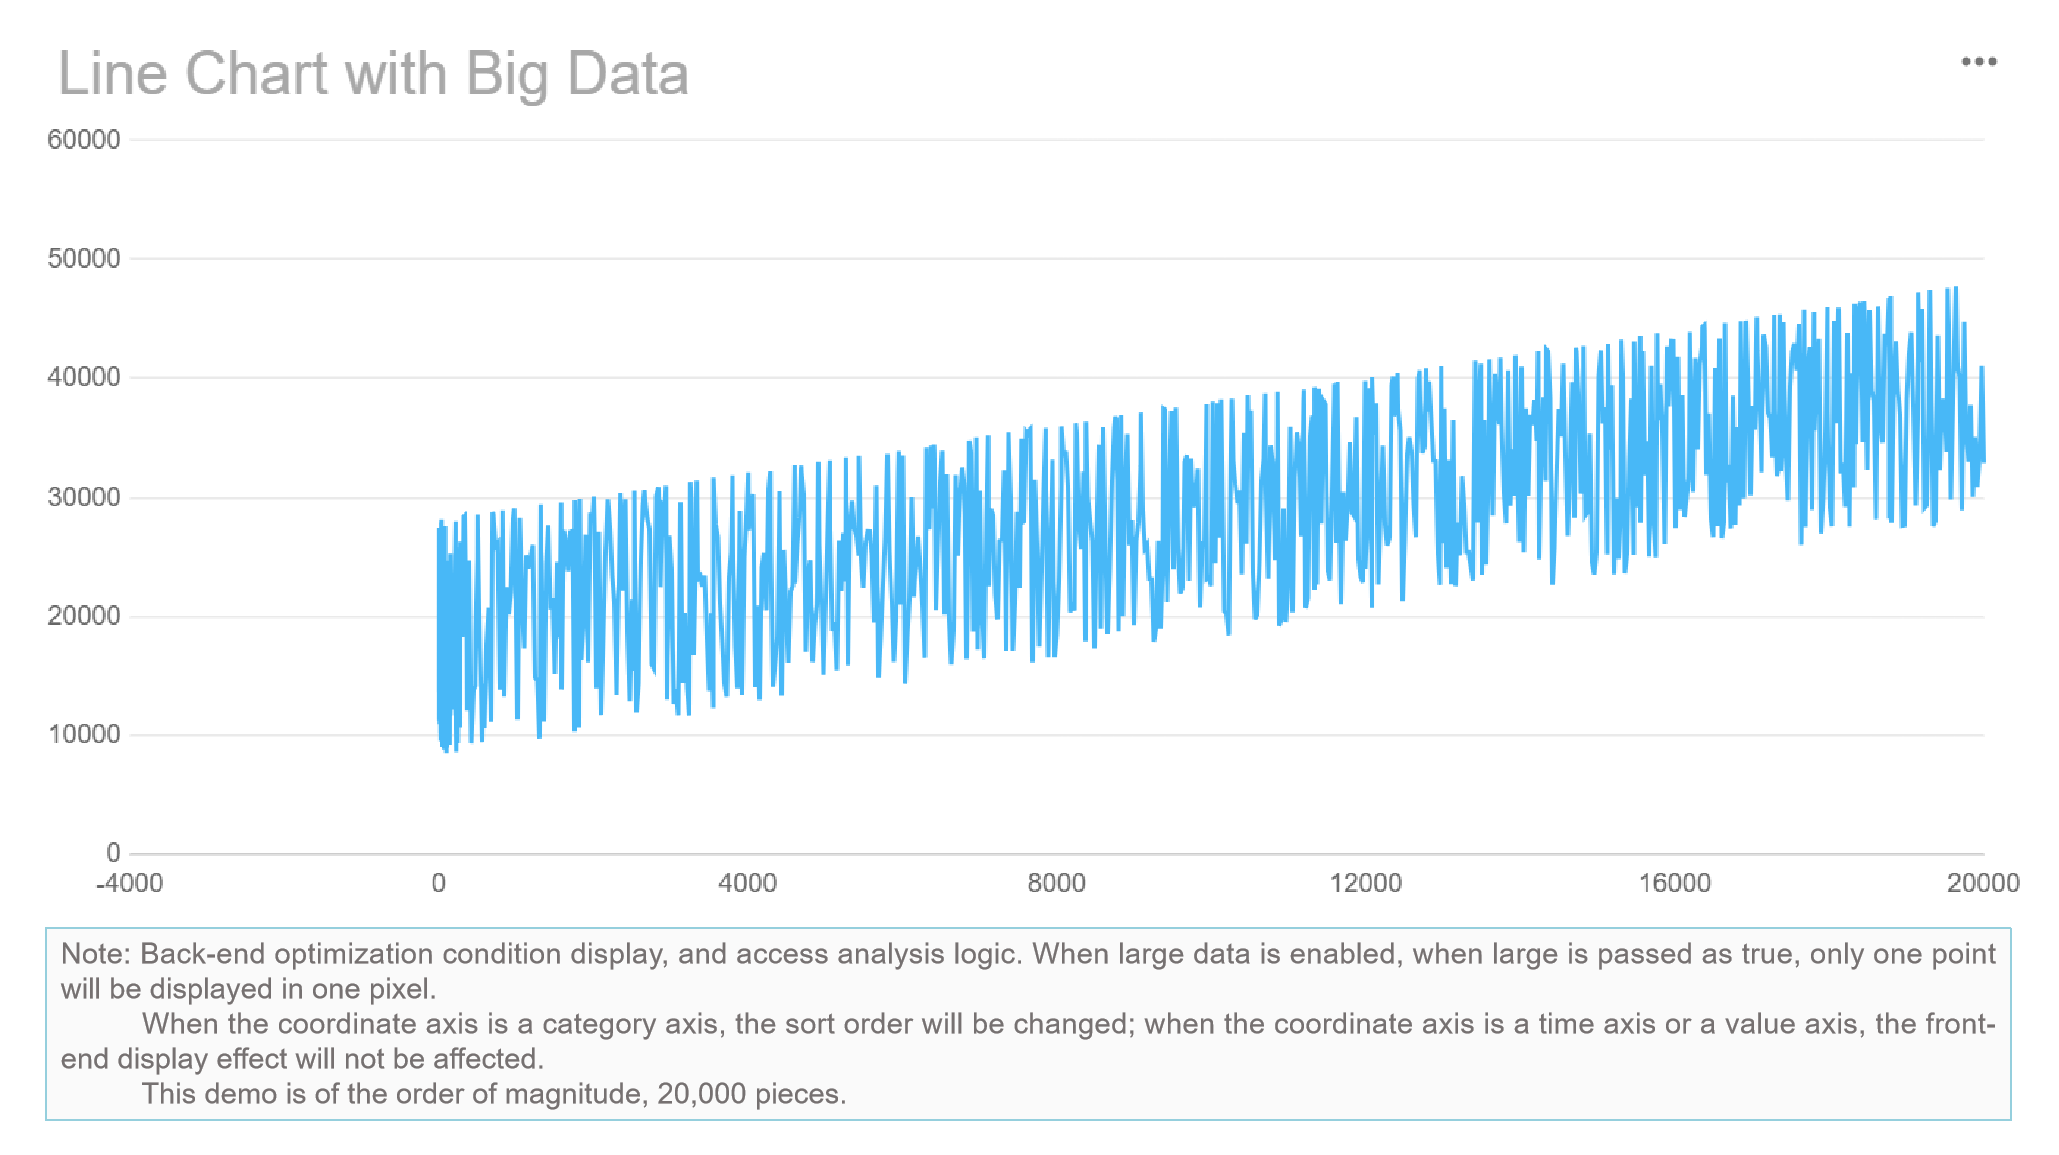
FineBI'sMultiple Built-in Charts For Visualization
FineBI Customer Success Story as a Sales Dashboard Software
FineBI Customer Success Storyshows you how businesses use FineBI to solve real problems and improve performance. This keyword refers to examples where companies achieve better results by using FineBI for sales dashboard software and data governance. When you read a FineBI Customer Success Story, you learn how organizations overcome challenges and reach their goals with data-driven solutions.
You see the value of FineBI Customer Success Story when you look at real-world cases. These stories help you understand how FineBI works in practice. You discover how FineBI helps companies manage data, automate reporting, and make faster decisions. You also learn how FineBI supports growth and scalability.
SAMOA Case Study Overview
SAMOA is a leading distributor in the retail and consumer goods industry. The company faced challenges with data silos, manual reporting, and inconsistent sales performance tracking. SAMOA needed a unified system to manage sales data, automate calculations, and improve decision-making. The company chose FineBI to build a transparent and scalable data governance framework.
You see how SAMOA used FineBI to integrate data from multiple sources, including ERP, CRM, and custom apps. FineBI helped SAMOA standardize sales recognition, unify report formats, and automate performance calculations. The company created visual dashboards to track key metrics in real time. SAMOA’s team gained access to accurate data and consistent logic for bonus evaluations and performance reviews.
FineBICustomer Success Story shows you howSAMOA transformed its operationswith a six-phase initiative. The company eliminated manual processes and improved data integrity across departments.
Results and Benefits
FineBI Customer Success Story highlights the results SAMOA achieved. The company now has a unified data governance system. Sales recognition and bonus calculations are automated, saving time and reducing errors. Visual dashboards provide real-time insights into sales performance, staff efficiency, and bonus coefficients.
You benefit from FineBI by gaining faster access to reliable data. SAMOA’s executives make informed decisions with up-to-date information. The company improved transparency, consistency, and auditability. FineBIsupports SAMOA’s global expansion by enabling scalable data management and reporting.
Benefit
Description
Unified Data Governance
Consistent logic and transparent reporting
Automated Calculations
Faster bonus and performance evaluations
Real-Time Dashboards
Immediate insights for decision-makers
Scalable Framework
Supports growth and international deployment
FineBI Customer Success Story demonstrates how you can use FineBI to solve complex data challenges and drive business success.
The word business refers to your organization’s activities, goals, and growth strategies. In this comparison, you saw how dashboard software helps your business track sales, analyze data, and improve decision-making. FineBI stands out for self-service analytics, strong integration, and governance features. You should assess your business needs and choose software that matches your goals. Try FineBIor consult with vendors for tailored solutions. Stay informed about dashboard software trends to keep your business competitive.
Access a wealth of case studies, industry insights, and solution guides to accelerate digital transformation.
FAQ
What is marketing dashboard software and how does it help with reporting needs?
Marketing dashboard software gives you a central place to track campaigns, measure results, and meet your reporting needs. You use it to combine data from different sources and create visual summaries that help you understand performance.
How do automated dashboards improve real-time monitoring?
Automated dashboards update your data instantly. You see changes as they happen, which supports real-time monitoring. This feature helps you react quickly to new trends and make decisions based on the latest information.
Why is data visualization important for reporting needs?
Data visualization helps you turn complex numbers into clear charts and graphs. You understand your reporting needs better when you see patterns and trends. This makes it easier to share insights with your team.
What are the benefits of customizable dashboards?
Customizable dashboards let you choose which metrics to display. You adjust layouts and filters to match your reporting needs. This flexibility helps you focus on the most important information for your business.
How does FineBI support marketing dashboard software and reporting needs?
FineBI gives you tools for marketing dashboard software. You create automated dashboards, customize layouts, and use data visualization for real-time monitoring. FineBI helps you meet your reporting needs by integrating data from many sources and providing instant insights.