If you need a report that prints cleanly, exports reliably to PDF or Excel, and gives operations teams the exact same layout every time, ssrs report builder is still one of the most practical tools available. For IT managers, BI developers, and operations leads, the pain point is familiar: dashboards are great for exploration, but they often fail when the business needs invoice-style layouts, audit-ready pagination, repeatable exports, and controlled server-side distribution. This tutorial walks through the first-report scenario end to end so you can build, validate, and deploy a working paginated report without getting lost in the SSRS ecosystem.
What Is SSRS Report Builder and When to Use It
SSRS Report Builder is Microsoft’s desktop authoring tool for creating paginated reports. A paginated report is a report designed around fixed page structure. It is optimized for printing, PDF generation, Excel export, and standardized presentation. Instead of adapting fluidly like a dashboard, it follows strict layout rules such as page width, margins, headers, footers, and page breaks.
That distinction matters in real operations. If your users need a report that looks the same in a browser, in a board packet, and in an emailed PDF, paginated reporting is usually the better fit than an interactive dashboard.
How paginated reports differ from dashboards and ad hoc visuals
Dashboards are built for monitoring and exploration. They usually emphasize interaction, filtering, and screen-based consumption. Paginated reports are built for structure and repeatability.
Here is the practical difference:
| Reporting Style | Best Use Case | Strength | Limitation |
|---|---|---|---|
| Paginated report | Printable operational reports, statements, detailed listings | Consistent layout and exports | Less interactive |
| Dashboard | Executive monitoring, KPI tracking, trend analysis | Fast visual scanning | Harder to standardize for print |
| Ad hoc visual | Self-service exploration | Flexible analysis | Inconsistent output format |
If you are creating order reports, finance summaries, production logs, inventory listings, compliance packs, or scheduled distribution reports, SSRS Report Builder is often the right starting point.
The relationship between SSRS Report Builder, SSRS, and SQL Server
New users often confuse the tool with the platform. Here is the simple model:
- SSRS Report Builder is the report design tool.
- SQL Server Reporting Services (SSRS) is the server platform that stores, runs, secures, and delivers reports.
- SQL Server often provides the source data, though SSRS can also connect to other supported data sources.
In other words, Report Builder creates the .rdl report definition, and the SSRS server renders it for users.
Common beginner use cases
Most first-time users start with one of these scenarios:
- Operational tabular reports for orders, customers, incidents, or tickets
- Printable department reports for daily or weekly review meetings
- Export-friendly reports that must open cleanly in Excel
- Scheduled reports sent through subscriptions or accessed from the report server
- Parameterized reports where users choose date range, status, or region
Key Metrics (KPIs) for a successful first SSRS report
Before you build, define the operational metrics the report must support:
- Row count: Number of records returned. Helps validate whether filters are working.
- Execution time: How long the report takes to run. Critical for user adoption and server load.
- Page count: Number of rendered pages. Important for printability and distribution cost.
- Export fidelity: Whether PDF and Excel outputs preserve layout and formatting.
- Data freshness: How current the underlying dataset is.
- Filter accuracy: Whether parameters return the intended subset of records.
- Total accuracy: Whether sums, counts, and subtotals match source-system expectations.
- Security scope: Whether only authorized users can run and view the report.
For enterprise teams, these KPIs are not cosmetic. They determine whether the report is truly production-ready.
Set Up SSRS Report Builder Before You Start
The fastest way to fail with a first report is to skip setup validation. Before you open the blank canvas, make sure the environment is aligned.
What you need to install and access
To begin, you need:
- SSRS Report Builder installed on a Windows machine
- Access to an SSRS report server or a deployment target
- A sample data source, typically SQL Server for beginners
- Permissions to read the data and publish to a folder on the report server
- A test dataset or query with known fields and expected results

Confirm compatibility before building
A common beginner mistake is designing first and checking compatibility later. Instead, validate these items early:
- Confirm your Report Builder version works with your SSRS server version
- Verify whether your report will be deployed to:
- SSRS native mode
- A report server portal
- A controlled non-production environment first
- Make sure the target environment supports your authentication method and shared data source strategy
If your organization has separate development, test, and production servers, ask where first drafts should be published. This avoids rework and permission issues later.
Basic prerequisites checklist
Use this minimum setup list before you start report design:
- Data source: SQL Server, Oracle, ODBC, or another supported source
- Dataset fields: Clear column names, correct data types, and only necessary fields
- Target folder: A report server location where you can publish
- Credentials: SQL login, Windows auth, or stored credentials depending on policy
- Business purpose: A defined audience and output format
- Expected filters: Date range, status, category, team, or region
Consultant tip: simplify the first report scenario
For your first build, do not start with a matrix, nested groups, and six parameters. Start with a basic table report from a single dataset. It is easier to debug, easier to deploy, and much better for learning pagination behavior.
At this stage, many teams also evaluate whether a more modern reporting platform could reduce manual setup overhead. If your reporting roadmap includes highly formatted reports plus dashboarding and self-service distribution, it can be worth comparing SSRS with tools like FineReport early in the selection process.
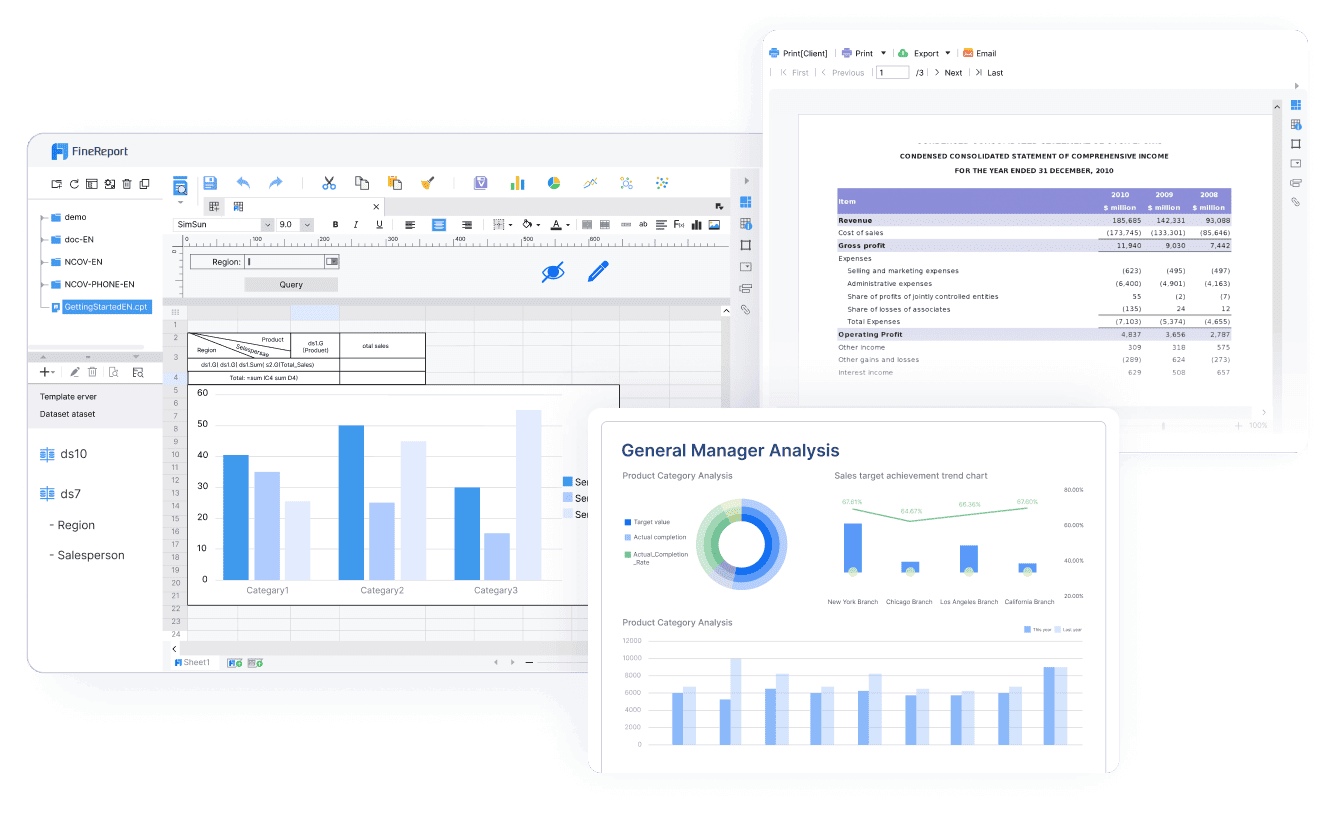 Flexible Report Designer
Create Your First Paginated Report with SSRS Report Builder Step by Step
This is the core workflow most beginners follow: connect, query, design, preview, and save.
Connect to a data source
In Report Builder, create either a shared data source or an embedded data source.
- A shared data source is managed centrally on the report server and reused across reports.
- An embedded data source lives inside the report definition and is easier for simple prototypes.
For a first report, embedded is often simpler unless your admin has already standardized shared connections.
Step-by-step
- Open Report Builder and create a Blank Report.
- In the Report Data pane, right-click Data Sources.
- Choose Add Data Source.
- Select either:
- Use a shared connection
- Use a connection embedded in my report
- Enter the server name, database, and provider details.
- Click Test Connection.
Choose the right authentication method
The correct authentication method depends on your environment:
- Windows Authentication: Best for domain-managed enterprise environments
- SQL Server Authentication: Common in controlled database access scenarios
- Stored credentials on server: Useful for scheduled execution and subscriptions
- Prompted credentials: Less ideal for scheduled workflows
If the connection fails:
- Confirm server name and database name
- Check firewall or VPN access
- Verify your account has database permissions
- Confirm the provider is supported
- Ask whether the report server requires shared data sources only
Build a dataset
Once the data source works, create the dataset that will power the report.
Step-by-step
- In Report Data, right-click Datasets
- Select Add Dataset
- Choose the correct data source
- Paste or write a SQL query
- Preview the returned fields
- Confirm data types make sense for dates, decimals, and text
A simple starter query might return order date, order number, customer, status, quantity, and total amount.
Best practice: filter early
Do not pull every column from a wide source table if the report only needs six fields. Keeping the dataset lean improves performance and reduces formatting complexity.
Focus on:
- Only required columns
- Clear aliases for business-friendly field names
- Avoiding duplicate or ambiguous field labels
- Removing test columns before layout design begins
Design the report layout
Now turn the dataset into a paginated report.
Step-by-step
- Insert a Table or Matrix
- Bind dataset fields to detail cells
- Add meaningful column headers
- Create totals where needed
- Adjust widths so the report fits page size
- Set page margins and report width carefully
For a first report, use a Table unless you specifically need grouped cross-tab behavior.
Layout elements to get right early
- Page size: Match A4 or Letter based on business standards
- Margins: Keep enough printable space without wasting room
- Headers: Use business-friendly labels, not raw database names
- Detail row alignment: Make numbers right-aligned and text left-aligned
- Totals: Add sums or counts only where they help decision-making
- Grouping: Keep initial grouping simple and intentional
A beginner rule worth remembering: report body width + left margin + right margin must not exceed page width. If it does, you often get blank extra pages in PDF or print output.
Preview, validate, and save
The preview step is where most layout issues become obvious.
Step-by-step
- Click Run or Preview
- Check whether page breaks look correct
- Validate sorting logic
- Confirm totals match expected values
- Review header repetition across pages
- Save the report draft locally or to the server
Do not wait until deployment to validate report behavior. A report that looks correct in design mode can still break in PDF or Excel output if widths, grouping, or text boxes are misaligned.
Improve Readability and Add Essential Report Features with SSRS Report Builder
A report can be technically correct and still be frustrating to use. Readability is what turns a test artifact into a business-ready document.
Add grouping, sorting, and totals
Grouping helps users make sense of repeated detail rows. In operational reports, common row groups include:
- Region
- Department
- Customer
- Status
- Month
Practical approach
- Create a row group when users care about category-level review
- Add a subtotal below each group if the grouped value matters
- Sort in a sequence users expect, not just alphabetically
For example:
- Finance may want date ascending within month
- Operations may want highest-priority status first
- Sales may want top customers by revenue descending
Format for print and export
Formatting is not decoration in SSRS. It directly affects usability across PDF, Excel, and print workflows.
Apply consistent formatting to:
- Numbers: Currency, decimals, thousand separators
- Dates: Standardized formats like
yyyy-MM-ddor business-preferred local format - Text: Consistent font size, wrapping rules, and label casing
- Headers and footers: Page numbers, report title, generation timestamp
Prevent common layout issues
To avoid frustrating export problems:
- Keep controls aligned to the grid
- Avoid overlapping text boxes
- Minimize unnecessary white space
- Watch total report width carefully
- Use explicit page breaks only where meaningful
- Test both PDF and Excel before publishing broadly
A report that exports badly will generate support tickets even if the data is right.
Add basic parameters and filters
Parameters make reports reusable without constant query editing. For a first report, start with simple filters such as:
- Date range
- Status
- Category
- Department
- Region
Beginner-friendly parameter strategy
- Add a parameter for a high-value filter, such as date range
- Bind the parameter to the dataset query or dataset filter
- Give the prompt a business-friendly label
- Test default values carefully
- Confirm null or blank handling behaves as expected
If the report will be run by non-technical users, parameter design matters as much as visual layout. Labels should be obvious, defaults should be sensible, and required inputs should be minimal.
Deploy, Test, and Share Your Report
A report is not finished when it previews correctly on your desktop. It is finished when target users can run it reliably in the right folder, with the right permissions, using the right data source.
Publish to the report server
Publishing usually happens through Save As or direct save to the report server.
What to confirm before publishing
- You are saving to the correct server folder
- Shared data source references resolve correctly
- The report name follows naming conventions
- The report does not overwrite a production item unintentionally
Test execution and permissions
After deployment, run the report as an intended user whenever possible.
Validate these checks:
- Does the report open from the server without errors?
- Do parameters prompt correctly?
- Are default values sensible?
- Do totals match the approved source?
- Can the intended audience access it?
- Are unauthorized users blocked?
This is also where role-based security matters. The report can be perfectly designed and still fail operationally if data source credentials or folder permissions are misconfigured.
Troubleshoot common first-report issues
Most first-report problems fall into a few predictable categories.
Credential errors
Symptoms:
- Login failures
- Prompt loops
- Report runs in desktop preview but not on server
What to check:
- Stored credentials
- Shared data source settings
- Database user permissions
- Server execution account policies
Missing fields
Symptoms:
- Expressions fail
- Text boxes show errors
- Dataset field names do not match layout bindings
What to check:
- Query changes after layout design
- Renamed columns
- Refreshed dataset fields
Rendering differences
Symptoms:
- Excel export shifts columns
- PDF creates blank pages
- Text gets clipped
What to check:
- Report width and margins
- Overlapping controls
- Hidden objects still affecting layout
- Inconsistent row heights and text wrapping
Deployment failures
Symptoms:
- Cannot save to server
- Invalid item path
- Shared data source not found
What to check:
- Folder permissions
- Correct server URL
- Existing dependencies
- Environment naming and version compatibility
Actionable Best Practices for a Strong First Implementation
If I were advising an operations or BI team rolling out SSRS for the first time, I would recommend these five practices without hesitation.
1. Start with a narrow business use case
Pick one report with clear demand and simple logic, such as daily orders or monthly customer activity. Avoid highly customized executive packs for your first build.
2. Standardize shared components early
Even if your first report uses an embedded data source, define a future standard for:
- Shared data sources
- Folder naming
- Parameter naming
- Date formatting
- Report titles and footers
This prevents report sprawl later.
3. Validate with source-system owners before formatting polish
First, confirm row counts, totals, and filter behavior. Only then spend time on layout refinement. Accurate ugly reports are easier to improve than beautiful inaccurate ones.
4. Test in the final output formats users actually need
If users consume PDF, test PDF first. If they export to Excel every day, test Excel repeatedly. Do not assume browser preview equals production quality.
5. Build with maintainability in mind
Use readable queries, clear field aliases, and simple grouping. The person maintaining the report six months from now may not be the original author.
A modern reporting strategy may also require more than SSRS alone. If your organization needs pixel-perfect reports plus interactive dashboards, mobile access, and broader self-service reporting, a platform such as FineReport can reduce the number of disconnected tools business teams must manage.
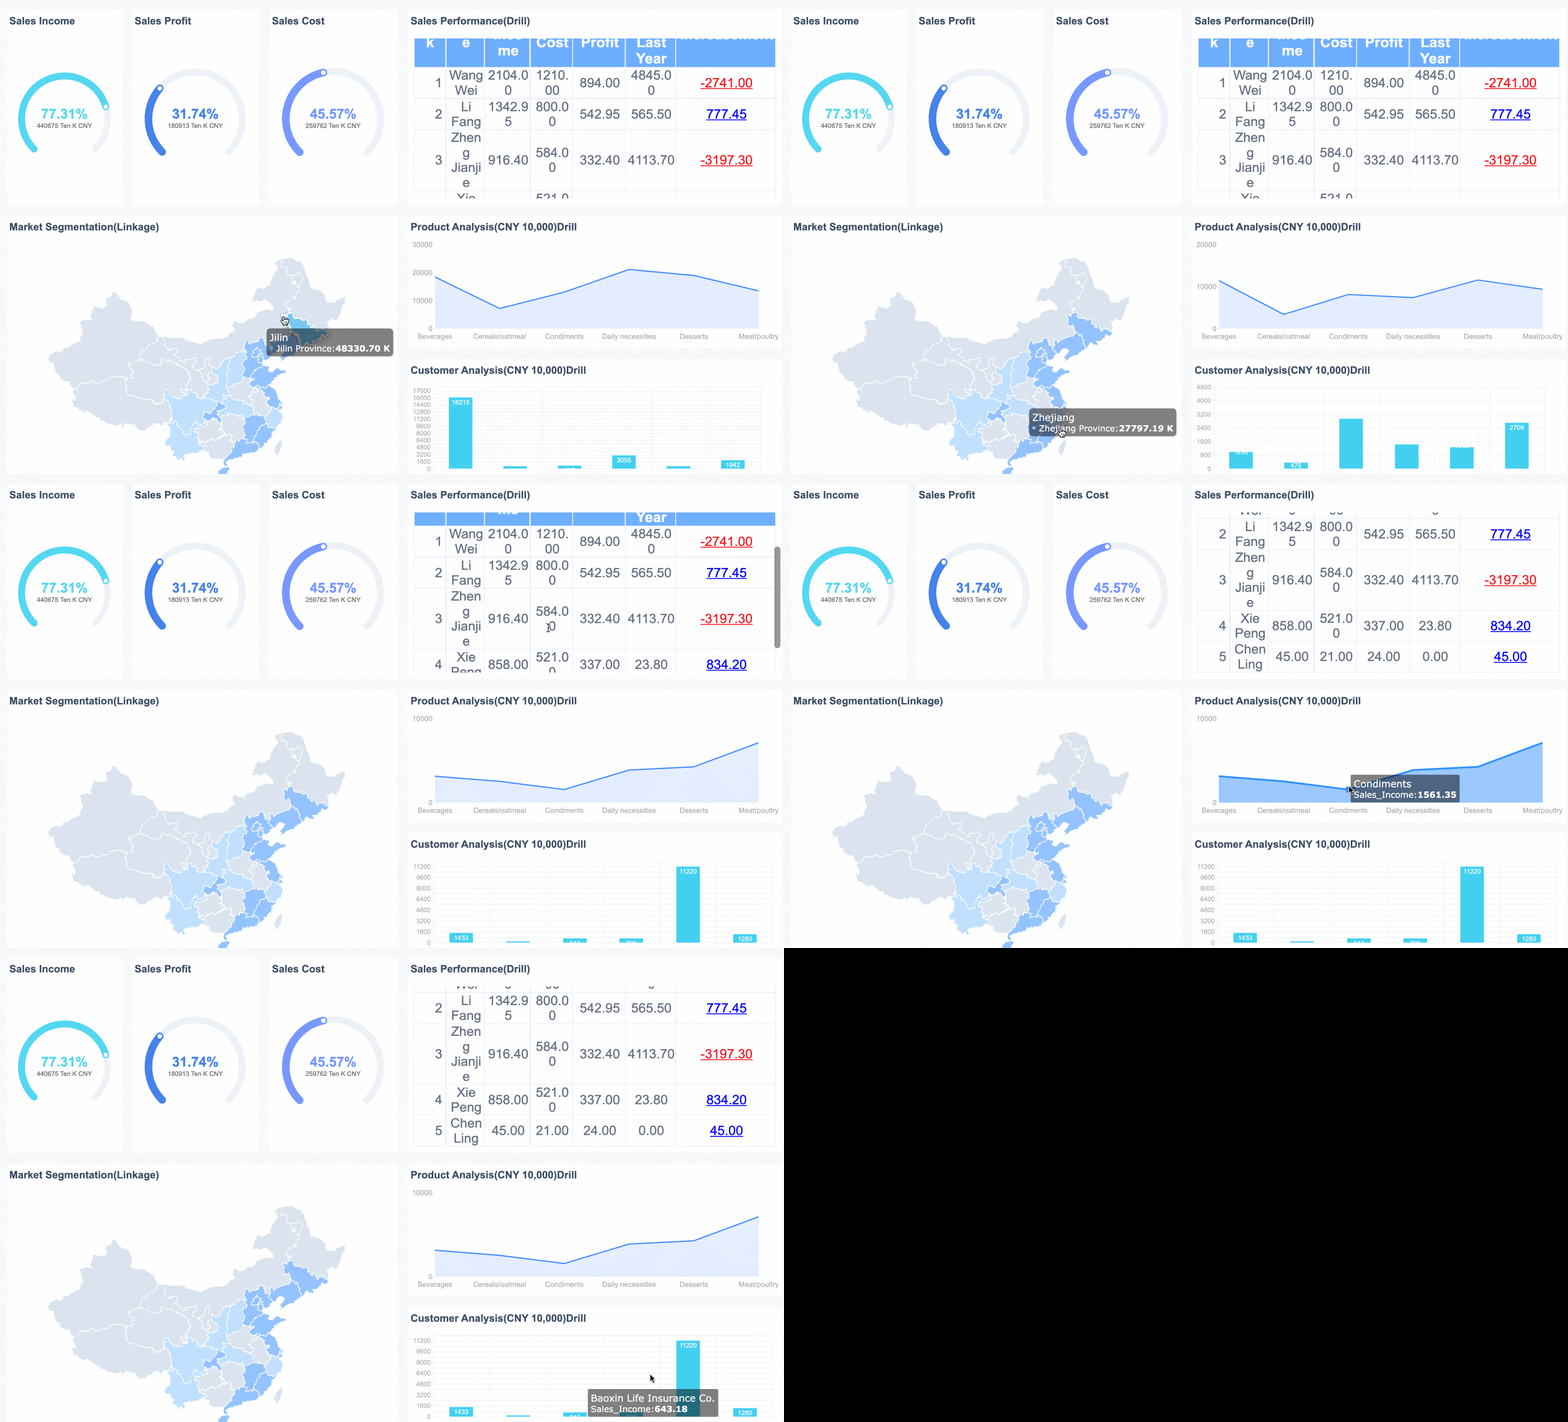 FineReport's Interactive Dashboard
 FineReport Mobile Access
Next Steps After Your First Report
Once your first report is stable, you can extend it in practical ways without overcomplicating the design.
Useful enhancements to add next
- Expressions for calculated fields and conditional text
- Conditional formatting to highlight exceptions or overdue items
- Charts for summary context above detail tables
- Reusable templates for branding and layout consistency
- Subreports or drillthrough links for related detail views
How beginners should decide whether SSRS Report Builder is the right fit
SSRS Report Builder is a strong fit when you need:
- Structured, printable, paginated output
- Controlled server deployment
- Reliable PDF and Excel export
- Parameterized operational reporting
- Tight alignment with SQL Server environments
It may be less ideal if your priority is:
- Highly interactive dashboard exploration
- Broad self-service analytics for non-technical users
- Rapid visual design across web and mobile
- Unified dashboard and reporting experiences in one tool
In many enterprises, the answer is not either-or. SSRS can remain the tool for fixed-format operational output, while a broader BI platform handles dashboards and self-service analytics.
Final Takeaway
Learning ssrs report builder is less about memorizing every menu and more about mastering the reporting workflow: connect cleanly, keep the dataset lean, design for the page, validate rigorously, and deploy with permissions in mind. If you can do those five things, you can create a reliable first paginated report that users will actually trust.
For teams that want to accelerate beyond basic paginated reporting into enterprise dashboards, reusable templates, and broader reporting standardization, it is worth evaluating a platform built for both operational reporting and modern analytics.
FAQs
SSRS Report Builder is the desktop tool used to design paginated reports, while SSRS is the server platform that stores, renders, secures, and distributes those reports. Report Builder creates the RDL file, and SSRS delivers it to users.