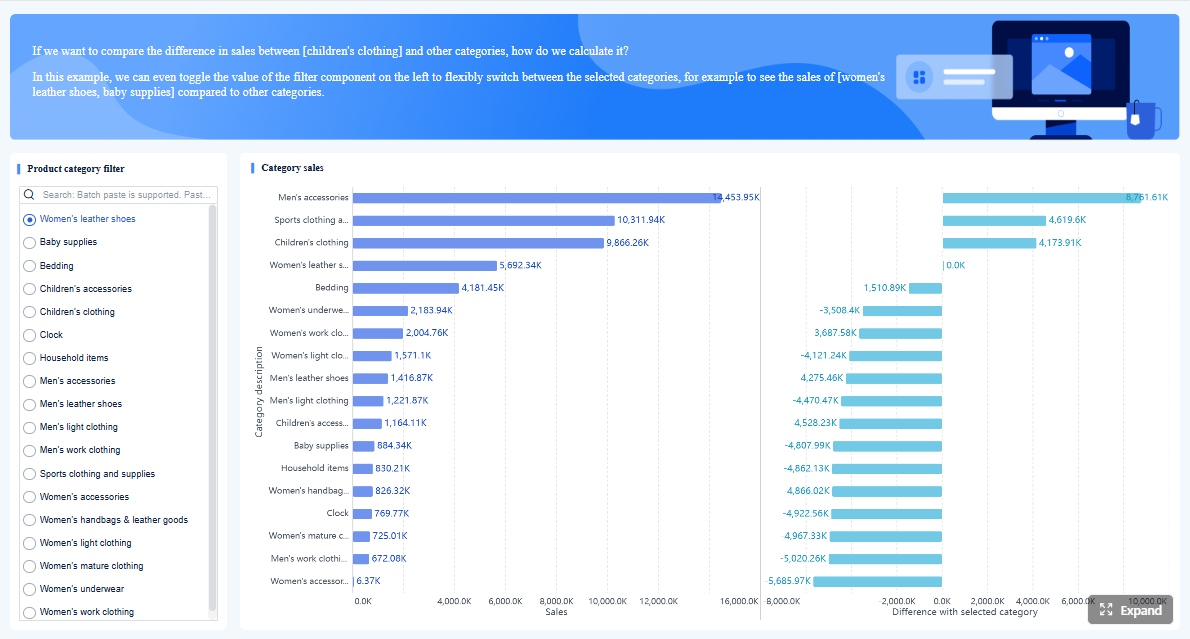
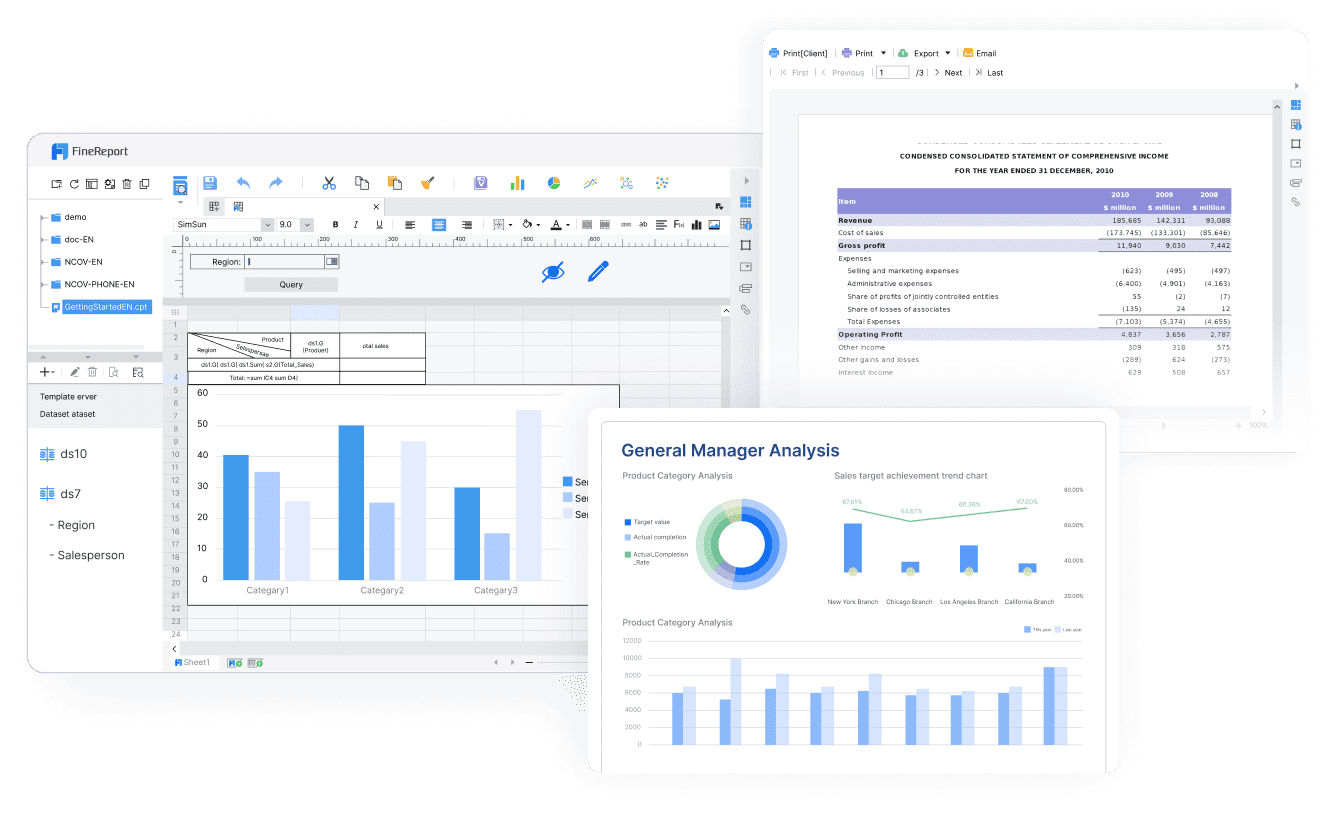
FineReport is an enterprise reporting platform built for highly customized, pixel-perfect reports, forms, dashboards, and scheduled distribution at scale.
Click To Try The Dashboard
Reporting software tools at a glance for custom enterprise reporting
When enterprises compare reporting software tools, they are usually not just looking for attractive dashboards. They need a platform that can support fixed-format reporting, secure access control, large data volumes, multi-department distribution, and long-term maintainability without turning every report change into a development project.
For most enterprise teams, the key requirements are consistent:
Flexibility for custom report design, document-style layouts, and business-specific workflows
Governance through role-based permissions, auditability, and standardized logic
Scalability across teams, departments, and growing data volumes
Ease of maintenance so reporting does not become overly dependent on a few specialists
Below is the quick positioning of the four platforms in this comparison.
One-sentence overview:FineReport is best known for custom enterprise reporting where fixed layouts, detailed operational data, and print-ready outputs matter.
Pros: Low barrier to entry, easy for simple dashboarding, useful for rapid rollout
Cons: Limited for complex enterprise reporting, governance depth, and advanced document requirements
Best For: Smaller teams, marketing reporting, and budget-sensitive departments needing fast setup
This comparison is especially relevant for:
IT-led reporting teams managing enterprise standards and deployment
Business analysts who need both depth and usability
Finance teams producing controlled, repeatable reports
Operations stakeholders who need line-level detail and drill-through visibility
How to evaluate enterprise reporting platforms
Choosing among enterprise reporting software tools becomes easier when evaluation criteria are tied to actual reporting workloads rather than product popularity alone.
Custom report design and layout control
For many enterprises, the most important question is simple: can the platform produce the exact report format the business requires?
If your team mainly needs KPI dashboards, almost any modern BI platform can help. But if you need invoices, production reports, financial packages, regulatory documents, or operational forms with exact formatting, the evaluation standard changes.
FineReport stands out strongly here because it is designed for highly customized enterprise report creation. It is especially suitable when report output needs to look and behave like a formal business document rather than a flexible dashboard.
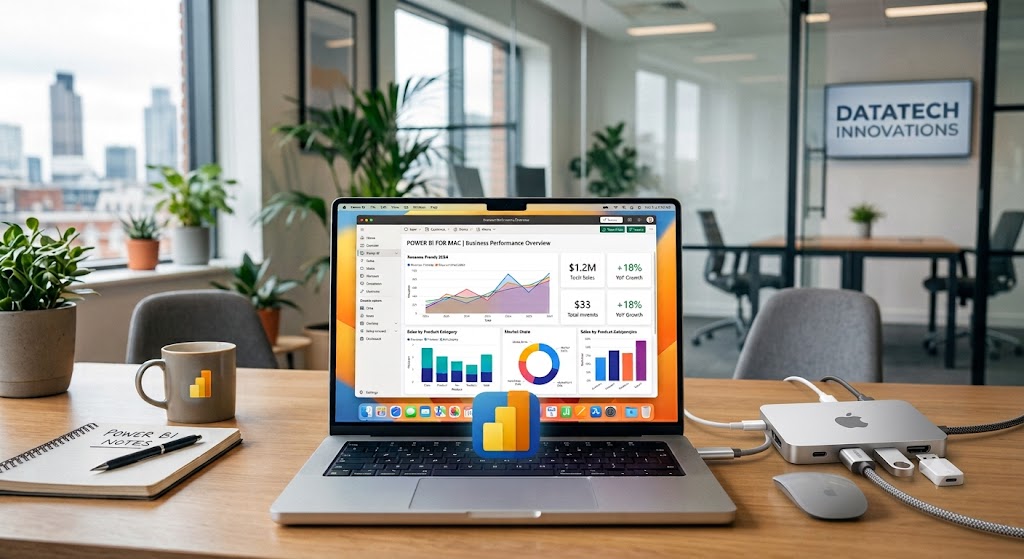
Power BI can support paginated-style reporting in certain setups, but it is generally stronger as a dashboard and BI platform than as a primary fixed-layout reporting engine.
Tableau is excellent for interaction and visualization, but less naturally aligned with highly structured, print-oriented report templates.
Looker Studio is usually the least suitable of the four for advanced multi-page document reporting.
Data connectivity, modeling, and detail depth
A reporting platform is only as useful as the depth and reliability of the data it can work with.
Teams should assess:
Which databases, files, APIs, and enterprise systems are supported
Whether semantic modeling is needed
How well the tool handles line-item or transactional detail
Whether drill-down and drill-through are practical for business users
How effectively large operational datasets can be queried and presented
This is where the difference between dashboard BI and operational reporting becomes more obvious.
FineReport is often preferred when detailed operational data needs to be surfaced in report form, especially when users need parameterized access to transaction-level information.
Power BI is strong in data modeling and enterprise semantic-layer scenarios, especially when organizations want reusable metrics and governed datasets.
Tableau supports broad data connectivity and interactive analysis well, though some enterprises may still rely on external modeling or warehouse layers for consistency.
Enterprise reporting cannot be judged by visuals alone. Governance determines whether the platform can scale safely across departments.
Important criteria include:
Role-based permissions
Row-level or object-level security
Version control
Audit logs
Approval and publishing controls
On-premises, hybrid, or cloud deployment options
Compliance readiness
FineReport is a strong candidate for organizations that want deployment flexibility and controlled internal reporting environments, particularly where on-premises or private deployment matters.
Power BI offers mature governance capabilities and integrates well with Microsoft security and identity frameworks, making it attractive for enterprises with existing Microsoft standards.
Tableau also supports enterprise governance, though its strength is often most visible in analytics distribution rather than formal document-centric reporting governance.
Looker Studio is usually adequate for simpler team-level use cases, but it is not typically the first choice for strict enterprise control requirements.
Cost, skills, and time to value
The right reporting platform is not always the one with the longest feature list. It is the one your organization can adopt, govern, and maintain effectively.
Consider:
Upfront licensing
Implementation effort
Skills required for authors and administrators
End-user learning curve
Long-term administration overhead
Cost of supporting report changes over time
Power BI is often attractive on perceived value, especially in Microsoft environments already paying for adjacent services.
Looker Studio has appeal for teams that need fast deployment with minimal budget commitment.
Tableau may justify its cost for organizations where advanced visual analysis drives significant decision-making value.
FineReport can deliver strong long-term value when reporting complexity is high and custom layout requirements would otherwise force teams into manual workarounds, spreadsheet dependence, or fragmented tools. For enterprises focused on formal reporting output, that can make FineReport the more practical strategic choice.
Effective for combining detail-level data with formal report output
Good fit for organizations that need both dashboards and document-style reporting
Cons:
May be more than some small teams need if requirements are limited to simple dashboards
Requires structured planning to fully benefit from enterprise deployment capabilities
Best For: Enterprises that need highly customized, fixed-format reporting, detailed transactional visibility, and controlled report distribution
FineReport is the best fit when reporting is not just about visual exploration, but about producing exact business outputs. That includes statements, operational forms, production summaries, compliance reports, and scheduled internal documents that need to look consistent every time. This is where FineReport clearly separates itself from many BI-first platforms.
For organizations comparing reporting software tools specifically for custom enterprise reporting, FineReport deserves serious attention because it addresses a gap that dashboard-led tools often only partially solve.
Strong modeling capabilities for standardized KPIs
Broad adoption and talent availability
Cons:
Less naturally suited to highly customized print-style reports
Can become complex when many report variants and semantic layers must be managed
Best For: Organizations that want governed BI, standardized metrics, and strong alignment with Microsoft infrastructure
Power BI is often the practical choice when the reporting initiative is tightly connected to Microsoft 365, Azure, Teams, Excel, and enterprise identity controls. It is particularly effective for KPI reporting, cross-functional dashboards, and centralized metric governance. However, when reporting must be document-like and highly formatted, it may not be as direct a fit as FineReport.
Can be less ideal for highly structured operational or document-style outputs
Best For: Data teams, analysts, and leaders who prioritize visual insight discovery over rigid report formatting
Tableau shines where users need to ask questions interactively and follow data visually. It remains a strong choice for executive and analyst-facing analytics. But if the core requirement is standardized enterprise reporting with exact layouts and formal distribution, Tableau is usually less specialized than FineReport.
Click To Try The Dashboard
Looker Studio
One-sentence overview: Looker Studio is a lightweight reporting and dashboard tool optimized for quick, accessible reporting in the Google ecosystem.
Weaker fit for strict governance and operational detail workflows
Not designed for complex fixed-layout reporting
Best For: Smaller teams, marketing departments, and organizations needing fast, low-complexity dashboard deployment
Looker Studio is useful when speed and simplicity matter more than enterprise reporting depth. It can be effective for campaign reporting, basic KPI visibility, and quick data sharing. It is not usually the right long-term answer for complex enterprise reporting programs.
Which tool fits specific enterprise reporting needs
For finance and regulated reporting
Finance and compliance-driven teams often need:
Fixed layouts
Controlled approval processes
Auditability
Version consistency
Scheduled distribution
Export and print reliability
In these scenarios, FineReport is often the strongest fit because the platform is well aligned with structured, repeatable, document-style reporting. If a finance team must deliver reports that look the same every month, support approval-oriented workflows, and maintain detailed formatting, FineReport is usually more suitable than dashboard-first alternatives.
Power BI can support financial dashboards and management reporting well, especially around standardized metrics and governance. But for highly formatted financial packs and print-oriented output, it may require more accommodation.
Tableau is generally stronger for visual performance review than for formal financial document production.
Looker Studio is usually too lightweight for regulated reporting needs.
For operational teams that need more detail level
Operations, manufacturing, logistics, service, and supply chain teams often need reporting that goes beyond summaries.
Typical needs include:
Transaction-level visibility
Parameterized report queries
Drill-through into records
Multi-level detail views
Print-ready operational documents
Reports tailored by plant, team, region, or shift
This is another area where FineReport is especially compelling. It handles detailed reporting scenarios well and is suitable for organizations that need a direct bridge between operational systems and user-facing business reports.
Power BI can support drill-through and operational dashboards, but many organizations still find that highly detailed document-style operational reporting is not its core strength.
Tableau works well for analysis of operational patterns, but less so for fixed operational reporting packs.
Looker Studio is usually not the preferred option for deep operational detail reporting.
For executive dashboards and governed decisions
When leadership teams need fast, trusted visibility into business performance, priorities usually shift to:
KPI standardization
Certified metrics
Cross-functional visibility
Shared dashboards
Consistent executive definitions
Fast decision support
Here, Power BI is often the strongest competitor because of its semantic modeling, Microsoft integration, and governance strengths.
Tableau also performs very well when executive users prefer visually rich, interactive analysis and storytelling.
FineReport can still play an important role, particularly when executive reporting must combine dashboard visibility with formal report packs or structured management documents.
Looker Studio can work for lighter executive needs, especially in digital-first teams, but it is less suited to mature enterprise governance.
For budget-sensitive teams and rapid rollout
Some teams care most about:
Fast implementation
Lower upfront cost
Minimal technical complexity
Quick user adoption
In that case, Looker Studio can be attractive for simple reporting needs, especially inside Google-centered environments.
Power BI can also be cost-effective for organizations already committed to Microsoft licensing and infrastructure.
Tableau may be harder to justify if the use case is basic reporting rather than advanced analysis.
FineReport becomes the better investment when low upfront simplicity is less important than long-term reporting capability. If a team expects reporting complexity to grow, selecting a platform built for customization from the start can prevent costly rework later.
Better alignment with fixed-format business documents
Practical handling of detailed operational data
Suitability for finance, production, logistics, and regulated reporting
A balanced ability to support both dashboards and formal reports
If your organization needs reporting that looks precise, behaves consistently, and scales across operational or compliance-heavy use cases, FineReport may be the strongest option in this comparison. It is particularly valuable when a dashboard alone is not enough and formal report output is a core business requirement.
Where Power BI, Tableau, and Looker Studio stand out
Each alternative has a clear best-fit scenario.
Power BI
Best when your organization is already invested in Microsoft
How often will report layouts need to be customized by department or workflow?
What is our realistic skills capacity for modeling, administration, and maintenance?
Are we optimizing for fast rollout, or for long-term reporting depth?
If your primary goal is governed dashboards and standardized KPIs in a Microsoft environment, Power BI is often the practical choice. If your priority is advanced visual exploration, Tableau is a strong contender. If cost and simplicity lead the decision, Looker Studio can work for lightweight use cases.
But if your organization is specifically evaluating reporting software tools for custom enterprise reporting, FineReport is often the most complete fit. It is especially well suited for enterprises that need precise report design, formal document-style outputs, detailed operational visibility, and scalable reporting workflows without relying on spreadsheet-heavy workarounds.
FAQs
FineReport is usually the strongest fit when teams need fixed-format, print-ready, and highly customized reports. It is built for document-style reporting rather than mainly exploratory dashboards.
Power BI is strong for self-service analytics, dashboards, and Microsoft-based environments. FineReport is generally a better choice when operational reporting requires exact layouts, detailed tables, and scheduled report distribution.
Tableau is excellent for interactive analysis and visual exploration, but it is less naturally suited to rigid document-style reporting. If your priority is multi-page statements or print-oriented templates, other tools may fit better.
Looker Studio can work well for simple dashboards, marketing reports, and fast deployment in the Google ecosystem. It is usually less suitable for complex governance, advanced layout control, and large-scale enterprise reporting workflows.
Focus on layout flexibility, governance, scalability, data connectivity, and long-term maintenance. The right tool depends on whether your main workload is dashboard exploration or controlled, repeatable reporting at enterprise scale.
Product Trial
FineReport
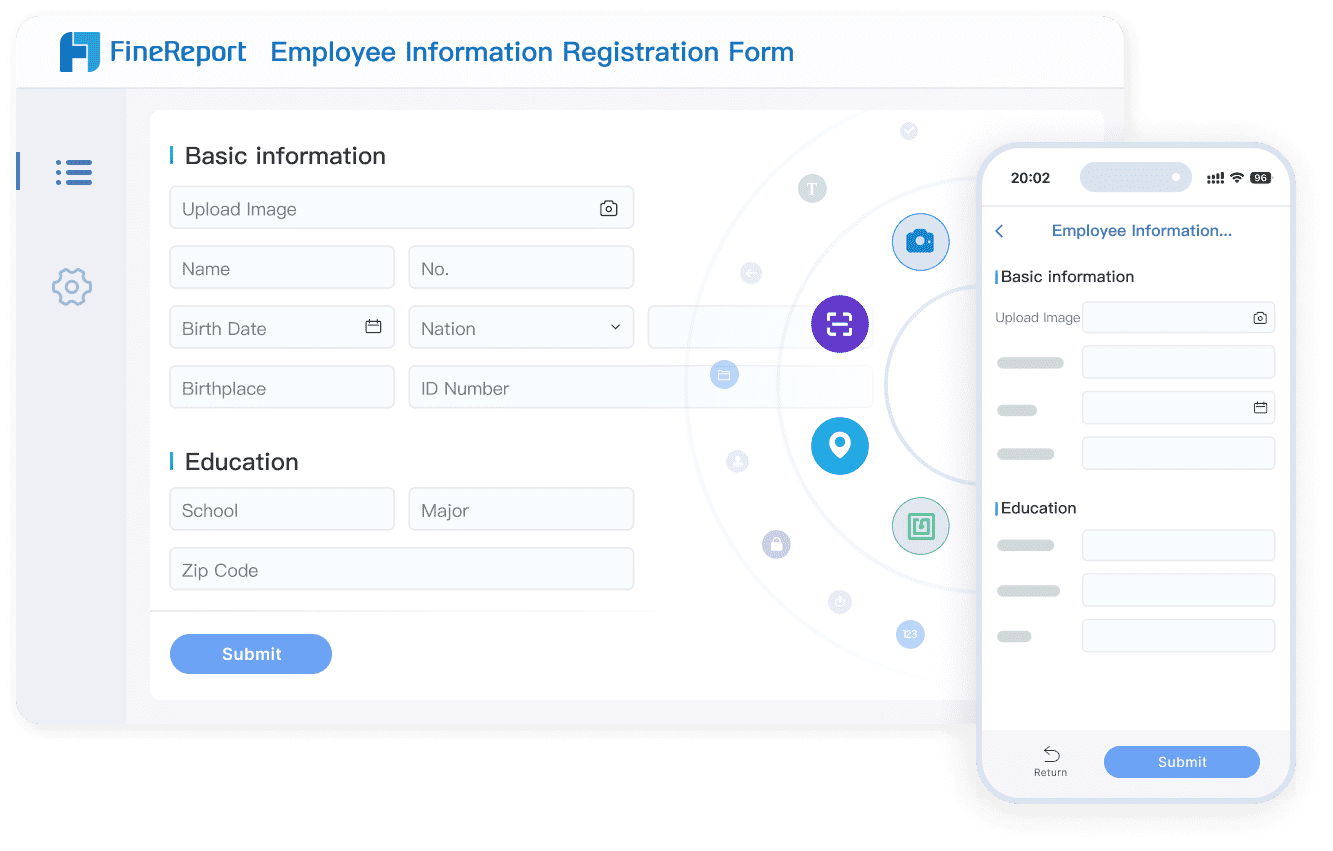
Pixel-perfect reports · Interactive dashboards · Easy data entry · Digital twins