An ESG sustainability reporting dashboard is the operating system for turning scattered sustainability data into decision-ready intelligence. For sustainability leaders, finance teams, compliance managers, and board stakeholders, the real challenge is not just collecting ESG data—it is making that data traceable, comparable, audit-ready, and useful for action. If your reporting process still depends on spreadsheets, manual reconciliations, and disconnected owners, you are carrying unnecessary compliance risk and slowing executive decisions.
Click To Try The Dashboard
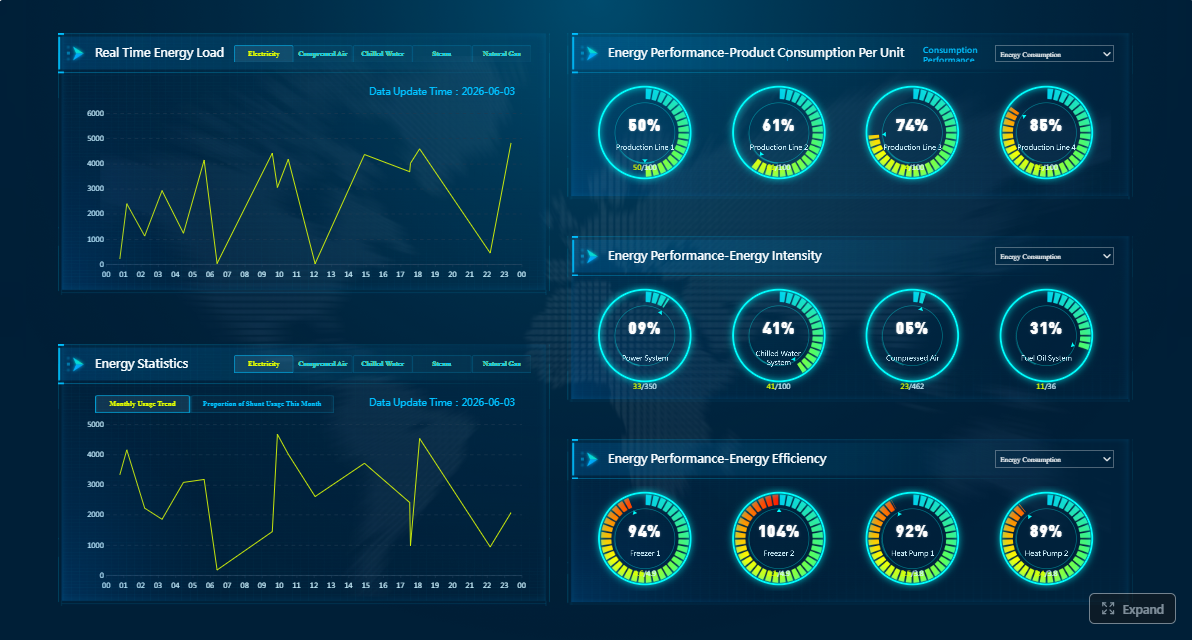
All reports in this article are built with FineReport
What an ESG sustainability reporting dashboard is and why it matters
An ESG sustainability reporting dashboard is a centralized reporting layer that brings together environmental, social, and governance metrics from multiple systems into a single visual decision environment. Its purpose is simple: transform complex sustainability data into a format leaders can trust, analyze, and disclose with confidence.
For most enterprises, ESG data lives across finance systems, HR platforms, EHS tools, procurement systems, energy records, and third-party datasets. Without a dashboard, teams struggle to answer basic questions quickly:
Are our reported emissions figures complete and approved?
Which entities are behind on data submission?
Where are our material risks worsening?
What disclosures are ready for review, and what still lacks evidence?
A well-built dashboard solves these operational problems by providing visibility into performance, controls, and reporting status at the same time.
Who uses an ESG sustainability reporting dashboard
A mature dashboard serves multiple user groups, each with different needs:
Sustainability teams use it to track material topics, progress against targets, and disclosure readiness.
Finance and controllership teams use it to validate data consistency, reporting logic, and internal controls.
Executives use it for summary views, risk indicators, and strategic performance signals.
Auditors and assurance providers use it to review traceability, approvals, and supporting evidence.
Board members use it to monitor headline KPIs, commitments, and governance oversight.
Why it matters to the business
The business value of ESG sustainability reporting goes far beyond compliance. A dashboard helps organizations:
Improve decision speed with near real-time visibility
Strengthen governance through role-based ownership and review workflows
Reduce reporting risk with better audit trails and data traceability
Increase disclosure quality by aligning metrics to reporting frameworks
Support executive accountability with clear trends and exception alerts
In practice, the dashboard becomes the bridge between sustainability ambition and enterprise-grade reporting discipline.
How CSRD, GRI, and SASB shape dashboard requirements
Not all ESG dashboards should look the same. The right design depends heavily on the reporting framework, regulatory scope, and audience expectations. CSRD, GRI, and SASB each influence what data you collect, how you structure it, and what kind of controls your dashboard must support.
CSRD essentials to reflect in your dashboard
If your company is preparing for CSRD, the dashboard must do more than display KPIs. It needs to support governance, documentation, and assurance readiness.
Core CSRD-driven requirements include:
Double materiality
Your dashboard should reflect both financial materiality and impact materiality. That means showing where sustainability issues affect enterprise value and where the company affects people or the environment.
Data traceability
Every disclosed figure should connect back to a source system, calculation method, reporting owner, and supporting evidence.
Internal controls
Dashboards should expose approval status, review checkpoints, missing submissions, and control exceptions—not just performance outcomes.
Audit readiness
CSRD reporting requires stronger evidence management. A dashboard should make it easy to verify version history, sign-offs, and data lineage.
GRI and SASB serve different reporting goals, so they also drive different dashboard logic.
GRI focus
GRI is broader and stakeholder-oriented. It emphasizes the organization’s impacts on the economy, environment, and society. A GRI-aligned dashboard typically includes:
Broad sustainability impact indicators
Stakeholder-relevant disclosures
Narrative support for management approach
Wider coverage of labor, community, and environmental topics
SASB focus
SASB is more investor-oriented and industry-specific. It emphasizes financially material sustainability topics that affect enterprise performance. A SASB-aligned dashboard often prioritizes:
Industry-specific KPIs
Risk-relevant and financially material metrics
Clear year-over-year comparability
Performance thresholds and management response
ESG vs. sustainability reporting: key differences explained
Many teams use these terms interchangeably, but the distinction matters when designing a dashboard.
ESG reporting usually focuses on decision-useful metrics for investors, management, and risk oversight. It tends to prioritize comparability, control, and financial relevance.
Sustainability reporting is often broader. It may include environmental and social impacts, stakeholder engagement, long-term commitments, and narrative context beyond investor needs.
Scope: ESG dashboards may focus on material and risk-linked metrics, while sustainability dashboards may include broader impact data.
Audience: ESG reporting often targets investors, executives, and regulators; sustainability reporting may also serve employees, communities, and NGOs.
Metric selection: ESG dashboards tend to emphasize measurable and comparable KPIs, while sustainability dashboards may combine KPIs with qualitative progress indicators.
Step-by-step framework to build your dashboard
A strong ESG sustainability reporting dashboard is not built by starting with charts. It starts with governance, decisions, and reporting architecture.
Step 1: Define reporting goals, users, and decision needs
Start with the purpose of the dashboard. Too many organizations begin by listing metrics before clarifying who needs what information and why.
Ask these questions first:
What compliance obligations must this dashboard support?
What decisions should executives make from it?
What information do sustainability owners need weekly or monthly?
What will auditors or assurance teams need to review?
From a consulting standpoint, I recommend mapping users into three layers:
Executive layer for headline KPIs, target progress, and red flags
Management layer for function and entity performance analysis
Operational layer for submissions, controls, and issue resolution
This prevents one dashboard from becoming overloaded and unusable.
Step 2: Map material topics, KPIs, and data sources
Once reporting goals are clear, map each material topic to a KPI, source system, owner, and methodology. This is where many ESG programs either become scalable or fall apart.
Step 4: Validate data quality, controls, and reporting workflows
This is where credibility is built. If your dashboard looks impressive but the underlying process is weak, it will fail under audit, assurance, or board scrutiny.
From experience, the biggest ESG reporting breakdowns happen not in calculation but in handoffs. Clarify who submits, who reviews, who approves, and what documentation is mandatory at each stage.
What to include in an effective ESG reporting dashboard
An effective ESG dashboard balances performance transparency with reporting discipline. It should not just show what happened. It should show what matters, what is missing, and what action is required.
Core sections and metrics to prioritize
Most enterprises should structure the dashboard around three content pillars.
Environmental
Include metrics tied to operational footprint and climate commitments, such as:
GHG emissions
energy use
renewable energy ratio
water use
waste and recycling
environmental incidents
Social
Include indicators that reflect workforce and stakeholder impact, such as:
health and safety performance
diversity and inclusion
turnover and retention
training and development
supply chain labor risk
community engagement indicators
Governance
Include governance indicators that support oversight and trust, such as:
Disclosure views for internal and external reporting
A dashboard should support both management use and formal disclosure production.
For internal reporting, prioritize:
operational trends
target performance
exception management
owner accountability
corrective action tracking
For external reporting, prioritize:
framework alignment
approved figures only
disclosure completeness
evidence traceability
period consistency
The best setup uses shared underlying data with different output views for different audiences. This reduces duplication and helps maintain one version of the truth.
Common data and design mistakes to avoid
The most common ESG dashboard failures are predictable and preventable.
Avoid these mistakes:
Inconsistent definitions
If one business unit calculates emissions differently from another, your dashboard will mislead users.
Missing baselines
Metrics without historical baselines cannot show progress credibly.
Weak audit trails
If users cannot trace a value back to a source and approval record, trust drops immediately.
Too many KPIs
More metrics do not equal better insight. Focus on material topics and decision-relevant indicators.
Cluttered visuals
ESG dashboards often try to tell every story at once. Keep executive views concise and use drill-downs for detail.
No workflow visibility
A beautiful KPI view is not enough if users cannot see what data is late, unreviewed, or unsupported.
Best practices to keep your dashboard useful over time
An ESG sustainability reporting dashboard should evolve with regulation, stakeholder expectations, and business strategy. The goal is not to build a static report. The goal is to build a reporting capability.
8 best practices in ESG reporting for a sustainable strategy
Here are the practices I advise enterprise teams to adopt from the start:
Keep metrics material
Only track what is genuinely linked to material issues, commitments, or disclosure requirements.
Document every methodology
Define formulas, boundaries, assumptions, and conversion factors clearly. This protects continuity and auditability.
Standardize definitions enterprise-wide
Create one controlled glossary for ESG metrics, ownership roles, and reporting logic.
Review thresholds regularly
Alert thresholds should change as targets, risks, and regulatory expectations evolve.
Automate data collection where possible
Pull from source systems directly to reduce manual effort and improve timeliness.
Retain human review
Automation improves efficiency, but expert review is still needed for anomalies, judgment, and narrative context.
Separate draft and approved views
Users should always know whether they are looking at working data or disclosure-ready data.
Update the dashboard as frameworks change
CSRD, GRI, SASB, and market expectations will continue to evolve. Your dashboard architecture should be flexible enough to adapt.
When to use ESG reporting services or outside support
External support is often valuable when:
your company is mapping multiple frameworks at once
the reporting perimeter spans many entities or regions
internal controls are still immature
assurance preparation is becoming urgent
source data is highly fragmented
leadership expects faster implementation than internal teams can deliver alone
A good outside advisor can accelerate framework mapping, dashboard design, control setup, and reporting governance. The key is to avoid outsourcing strategy entirely. Your internal owners must still own the metrics, judgments, and long-term operating model.
Build ESG sustainability reporting faster with FineReport
Building this manually is complex; use FineReport to utilize ready-made templates and automate this entire workflow.
For enterprise teams, the challenge is rarely just visualization. It is integrating multiple data sources, managing reporting workflows, supporting drill-down analysis, and producing reliable outputs for both internal reviews and external disclosure. FineReport helps solve these issues by combining dashboard development, reporting automation, data connectivity, and flexible layout design in one platform.
Build executive dashboards and disclosure views faster
Create drill-down reports by entity, region, or topic
Standardize KPI logic and reporting templates
Support approval workflows and reporting operations
Reduce spreadsheet dependence and manual consolidation
That matters because ESG sustainability reporting is becoming more regulated, more scrutinized, and more operationally demanding. The faster you move from fragmented files to a governed dashboard environment, the stronger your reporting posture becomes.
Get Ready-to-Use Dashboard Templates in Fine Gallery
If you are preparing for CSRD, aligning to GRI or SASB, or simply trying to make ESG reporting more reliable across the business, a dashboard-first approach is the smartest next step. Build the governance, metrics, and workflows correctly now, and future reporting becomes faster, cleaner, and more defensible.
An ESG sustainability reporting dashboard is a centralized view that combines environmental, social, and governance data into one place for monitoring, analysis, and disclosure. It helps teams track KPIs, reporting status, approvals, and evidence more reliably than spreadsheets.
A CSRD-ready dashboard supports double materiality, data traceability, internal controls, and audit readiness. It helps companies connect reported figures to source data, owners, approvals, and supporting documents.
GRI dashboards usually cover broader stakeholder impacts across environmental and social topics. SASB dashboards focus more on industry-specific, financially material metrics that investors use to assess risk and performance.
Most dashboards include emissions, energy use, diversity data, safety metrics, governance indicators, submission progress, and disclosure readiness. The exact metrics should match your reporting frameworks, material topics, and business goals.
A dashboard improves visibility, consistency, and speed by bringing data from multiple systems into a controlled reporting layer. It also reduces compliance risk by making reviews, version history, and audit trails easier to manage.
Product Trial
FineReport
Pixel-perfect reports · Interactive dashboards · Easy data entry · Digital twins