Choosing the best free report template starts with understanding your project’s specific needs. You want a structure that highlights your data clearly and supports your goals. FineReportfrom FanRuancan help you work faster and smarter.
Feature
Description
Drag-and-drop interface
Lets you design reports quickly without needing advanced skills.
Pre-designed templates
Gives you a consistent look and easy ways to match your brand.
Dynamic reporting capabilities
Connects to many data sources, so your reports always show the latest information.
With tools like this, you can create and customize reports easily, even if you have never built one before.
Define Project Needs of Report Template
Set Goals
Before you choose a report template, you need toset clear goals for your project. When you know what you want to achieve, you can focus your efforts and keep your team motivated. Studies show that only 26% of knowledge workers understand how their work connects to company goals. This lack of clarity can lead to confusion and disengagement. When you define your objectives, you help everyone see how their work adds value. Teams with clear goals feel twice as motivated and stay focused on what matters most.
Ask yourself these questions:
What is the main purpose of your project?
Who will read your progress report?
What decisions will your report support?
When you answer these questions, you make it easier toselect a report templatethat matches your needs. You also help your team stay aligned and productive.
List Key Elements
Every project has unique needs, but some elements are essential in any report template. If you want your progress report to cover all the important details, make sure your template includes these key parts:
Clear project objectives and scope
A comprehensive project plan
Detailed requirements specification
Risk management plan
Communication plan
Quality management plan
Change management procedures
Resource management plan
Stakeholder engagement strategy
Project closure and lessons learned
Tip: Using free report templates that include these elements can save you time and help you avoid missing critical information.
You should also think about how you organize your report. A good progress report arranges information in a logical order. Start with an executive summary, then move to detailed analysis. The table below shows common project requirements that influence your choice of report template:
Project Requirement
Description
Purpose and Audience
Tailor the report according to its purpose and audience, highlighting relevant information for stakeholders.
Type of Data Collected
Collect essential data about project progress, including tasks completed, milestones, and budget status.
Organization of Report Components
Strategically arrange the report’s components for logical flow, including an executive summary and detailed analysis.
When you understand your project’s needs and include these key elements, you set yourself up for success. The right report template helps you track progress, communicate clearly, and reach your goals.
Report Template Criteria
Choosing the rightreport template can make your project run smoothly from start to finish. Experts agree that you should look for templates that help you set clear goals, organize information, and present data in a way that everyone can understand. Let’s break down the most important criteria you should consider.
Layout & Organization
A well-structured layout helps you communicate information clearly. When you use a report template with logical sections and clear headings, you make it easier for readers to find what they need. Good organization supports better decision-making and keeps your project on track.
A clear structure improves readability.
Logical sections guide readers through your progress report.
Consistent branding and readable fonts make your reports look professional.
Visual hierarchy, such as bold headings and bullet points, highlights key points.
You should always choose a template that matches your project’s needs. For example, a status report template works well for regular updates, while a progress report template is better for tracking milestones and achievements. FineReport by FanRuan offers flexible templates that you can organize to fit any project, whether you work in manufacturing, EHS, or quality control.
Customization Options
Customization is key when you want your reports to stand out. You need to tailor your report template to match your project’s unique requirements. The best templates let you:
Personalize content to show you understand your audience’s needs.
Address specific challenges in your industry or organization.
Present data that aligns with your project’s objectives.
Add your company’s branding, such as logos and color schemes.
FineReport makes customization easy. Its drag-and-drop designer lets you adjust layouts, add charts, and change styles without any coding. You can create a report template that fits your workflow, whether you need a detailed progress report or a quick summary for stakeholders. This flexibility helps you deliver reports that are both relevant and impactful.
Your report template should work seamlessly with the tools you use every day. Compatibility ensures you can collect data from different sources and update your reports quickly. FineReport stands out because it connects to many databases, spreadsheets, and other data sources. You can pull in real-time data, automate report generation, and even view dashboards on your phone.
Feature
FineReport Advantages
Other Reporting Tools
Drag-and-Drop Designer
Intuitive interface for creating detailed reports without technical skills
Often requires coding skills
Customization Options
Abundant options to tailor reports to client needs
Limited customization
Automated Report Generation
Schedule reports for timely delivery without manual intervention
Connects with various data sources for comprehensive analysis
Limited data source support
Branding Integration
Seamless incorporation of logos and design elements for professional presentations
Branding options may be limited
This level of compatibility means you can use one report template for many types of projects. For example, you can adapt the same template for manufacturing inspections, EHS safety checks, or quality control reviews. FineReport’s flexibility saves you time and reduces errors.
Visual Appeal
Visual design plays a big role in how people understand your reports. The right visuals help you tell your project’s story and highlight important trends. When you choose a report template, look for these visual design features:
Visual Design Feature
Description
Select the right visual for the data
Use line charts for trends and Gantt charts for timelines to effectively represent data.
Prioritize clarity
Keep visuals clean and avoid overcrowding; use whitespace to enhance readability.
Create a visual reporting template
Standardize visual elements to ensure consistency across reports.
Regularly update and refine visuals
Ensure visuals reflect the latest data and are refined based on stakeholder feedback.
Use a visual style guide
Maintain clarity and accessibility with a guide for colors, fonts, and layouts.
Test for readability and impact
Conduct quick tests with a small group to ensure visuals convey information effectively.
You should avoid overloading your report with too many visuals. Instead, focus on clarity and consistency. FineReport supports over 70 chart styles and offers responsive dashboards, so your reports look great on any device. You can easily update visuals as your project progresses, making sure your progress report always reflects the latest information.
Tip: Regularly ask for feedback from your team or stakeholders. This helps you improve your report template and keep it relevant for future projects.
A strong report template combines clear layout, easy customization, tool compatibility, and visual appeal. FineReport by FanRuan brings all these features together, making it simple to create free report templates that work for any project. Whether you need a progress report template for manufacturing, EHS, or quality control, you can adapt your template to fit your needs and deliver results.
You want to start your project with a reliable report template. Trusted platforms give you access to high-quality templates that save time and reduce errors. Here are some of the most reputable sources for free report templates:
FanRuan’sFineReport template library: This platform offers a wide range of templates for different industries and project types. You can find templates for manufacturing, EHS, quality control, and more.
ProjectManager.com: This site provides customizable templates for many project needs. You can use these templates for your next progress report or status report template.
PPM Express: This platform features expert-recommended templates, especially for project managers who need to track progress and share updates.
You should always choose a source that matches your project’s requirements. Reading user reviews helps you understand how well a template works in real situations. Checking ratings and feedback can guide you toward the best options for your next progress report.
Evaluation Tips
Selecting the right report template takes more than just picking the first one you see. Experts recommend a step-by-step approach to make sure your template fits your project. Follow these tips to evaluate your options:
Define your report’s purpose and audience before you start.
Use clear language and avoid technical terms that confuse readers.
Present your findings with tables, charts, or graphs for better understanding.
Summarize your project’s goals and expected impact.
List any limitations to give a balanced view.
Organize your report with headings and subheadings for easy reading.
Keep formatting consistent throughout the document.
End with recommendations that help improve your project.
Compatibility with your reporting tool is also important. You want your free report templates to work smoothly with platforms like FineReport. The table below shows what you should check before choosing a template:
Selection Criteria
Explanation
Match company issues
Make sure the template addresses your project’s specific needs.
Minimize operational and training costs
Choose templates that are easy to use and do not require extra training.
Ease of use for employees
Pick templates that everyone on your team can understand and use.
Tip: Always test your chosen report template with your current tools. This step ensures you avoid problems later and keeps your progress report accurate and up to date.
Test Best Project Report Template
Testing thebest project report templates helps you find the right fit for your needs. You can see how each template works in real situations. Try different templates for your project to see which one supports clear communication and effective progress reports.
A retail report template gives you a structured way to track sales and inventory. You can use tables to display data, making it easy to spot trends and manage stock. Consistency in your reports helps you avoid errors and track changes over time. Time-efficient templates let you focus on analyzing data instead of formatting. Comprehensive data collection ensures you have all the information needed for smart decisions.
Feature
Contribution to Analysis
Consistency
Uniform data recording for trend tracking and error reduction
Time-Efficiency
Streamlined reporting for more analysis and better customer service
Comprehensive Data
Captures all relevant points for informed decisions and inventory optimization
You can use a retail progress report template to monitor sales, returns, and inventory levels. This approach helps you create effective progress reports that support business growth.
Manufacturing report templates help you optimize processes and maintain quality control. You can use them to document inefficiencies, analyze root causes, and propose improvements. These templates guide you through each step, from identifying issues to tracking performance metrics.
Section
Description
Identified Inefficiencies
Document current process problems
Root Cause Analysis
Analyze why problems occur
Proposed Improvements
Suggest ways to improve performance
Impact Assessment
Evaluate how changes affect quality and efficiency
Action Plan
Outline steps for improvement
Performance Metrics
Define how you will measure success
Final Comments
Summarize findings
Approval
Get necessary sign-off
You can also use these templates for quality checks at every stage, from receiving raw materials to final inspections. This method ensures your project meets industry standards and customer expectations.
A financial report template tracks your project’s financial health. You can include key metrics like income statements, balance sheets, and cash flow statements. These sections help you see where money comes from and where it goes.
Financial Metric
Description
Income Statement
Tracks revenue, cost of goods sold, and net income
Balance Sheet
Compares assets, liabilities, and equity
Cash Flow Statement
Shows cash inflows and outflows
Performance Dashboard
Visualizes revenue, expenses, and profitability
You can also monitor gross sales, net sales, and operating income. Using a status report template for finances keeps your project on track and supports better decision-making.
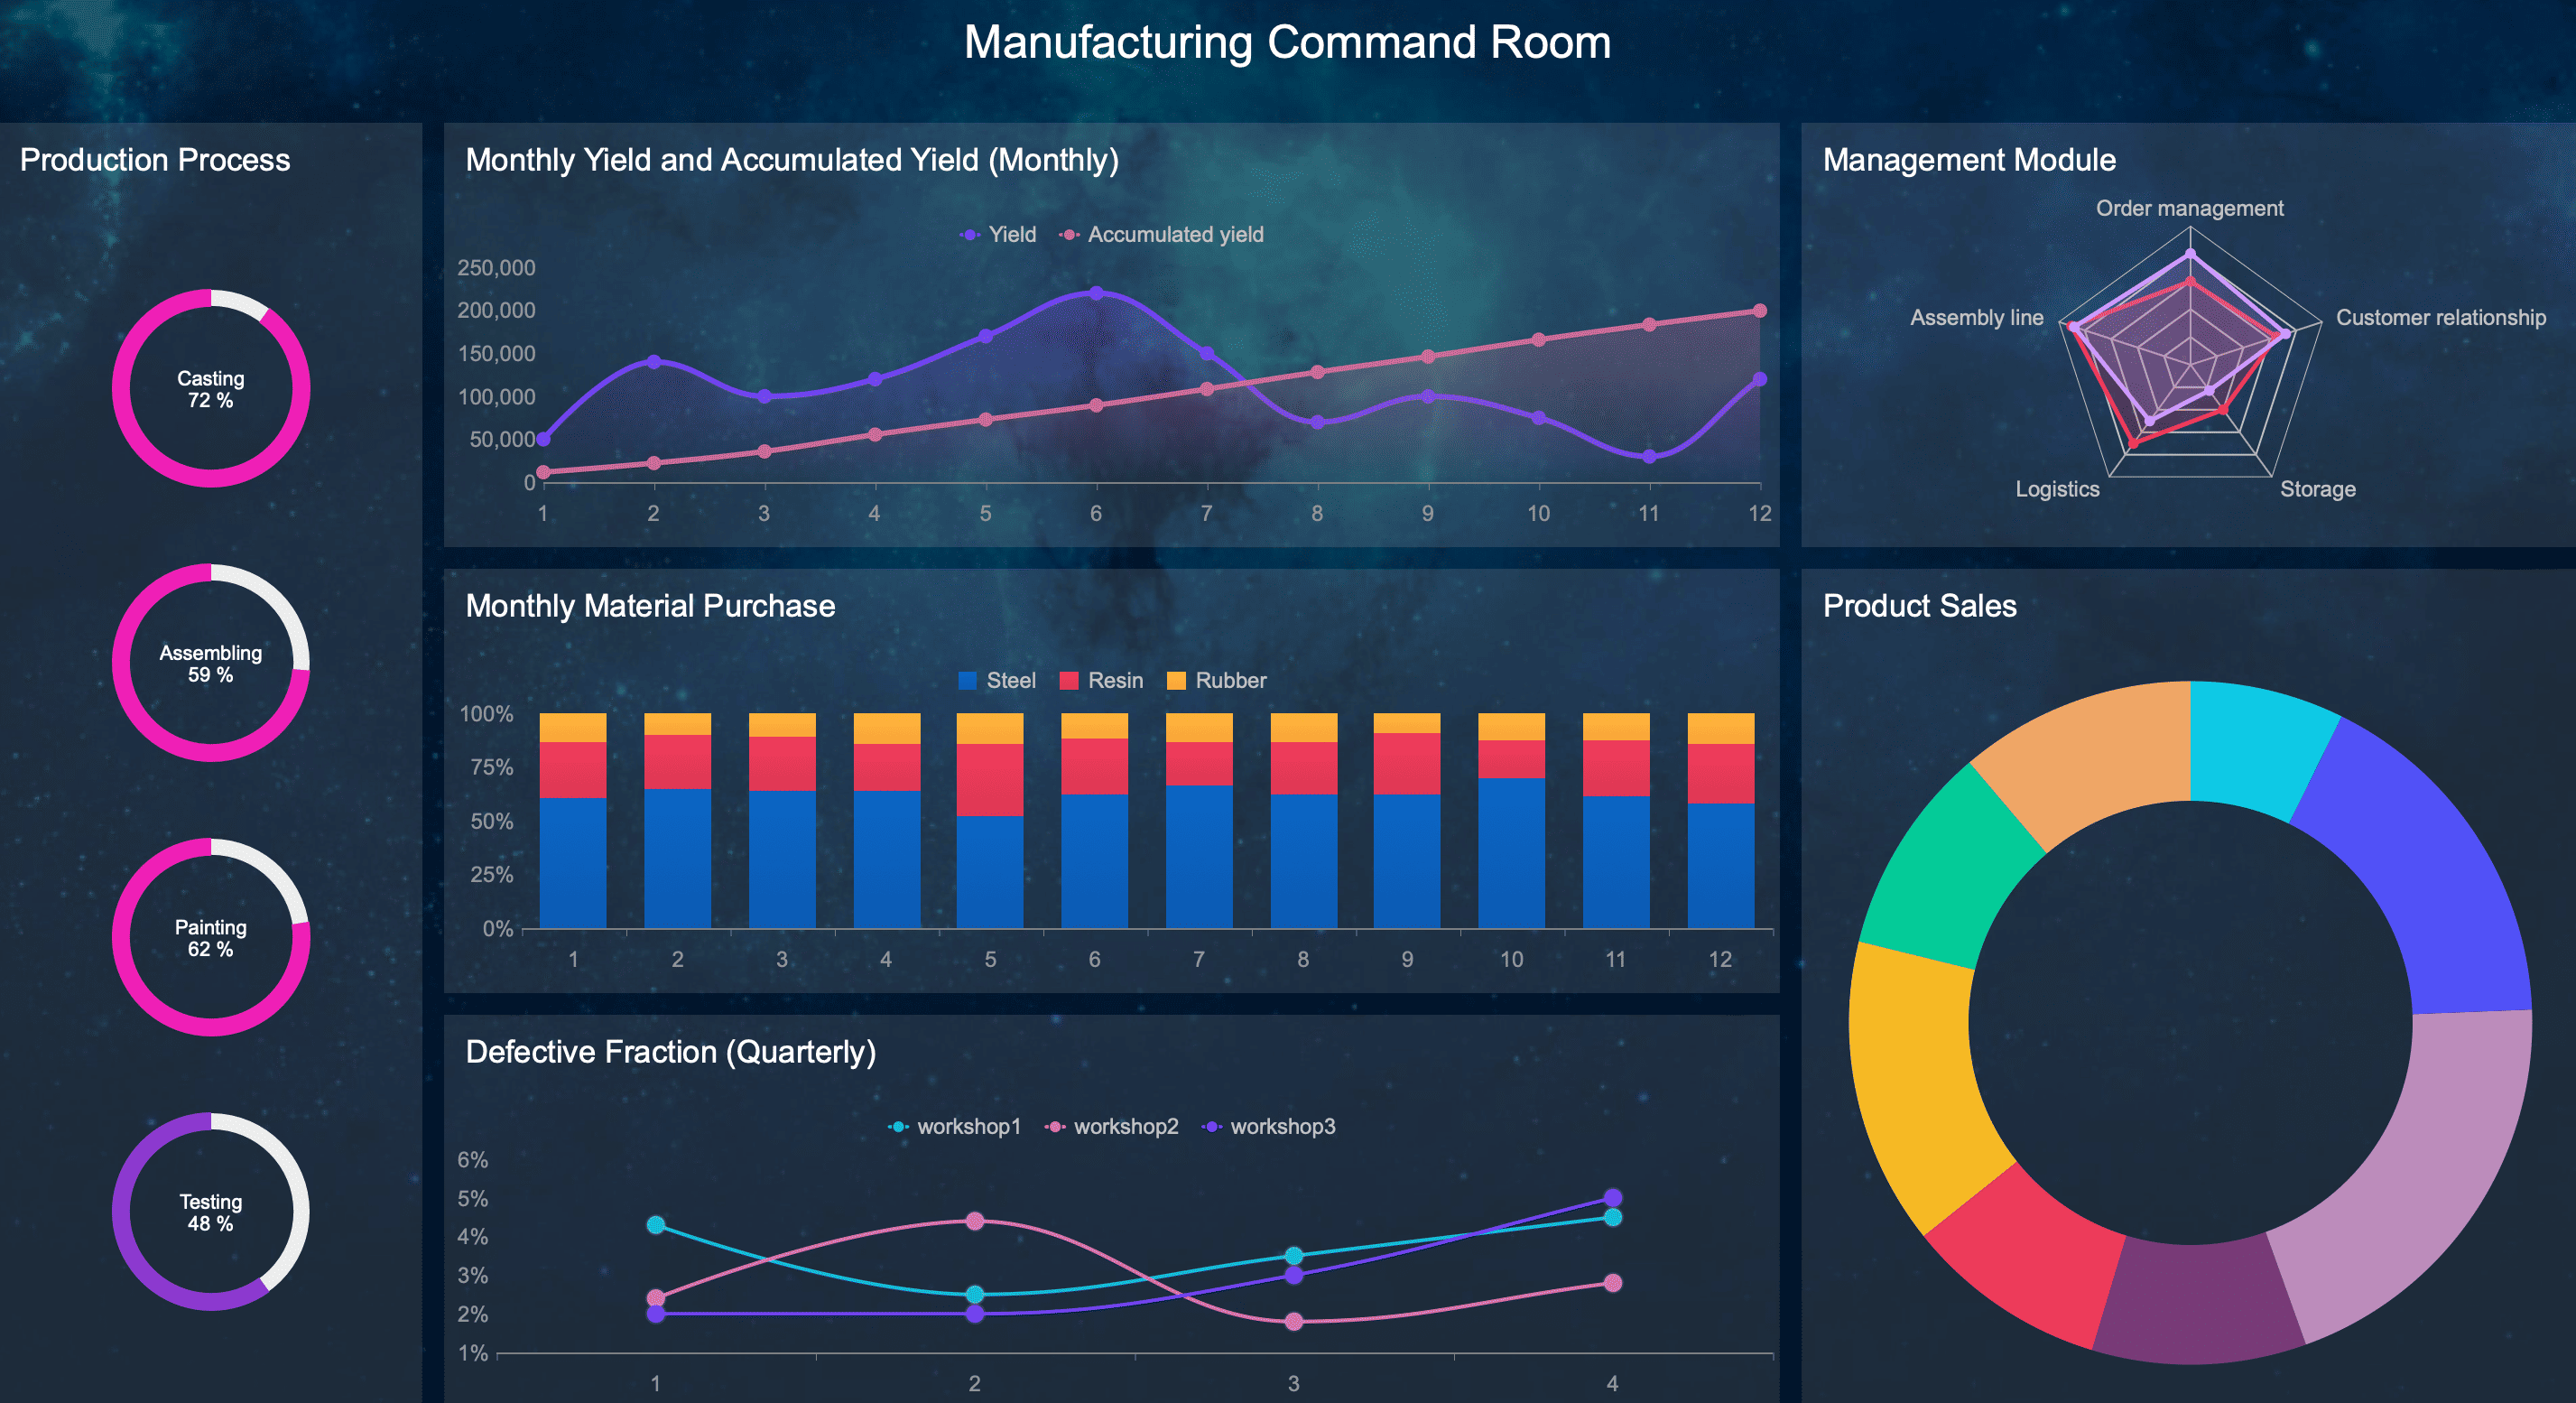
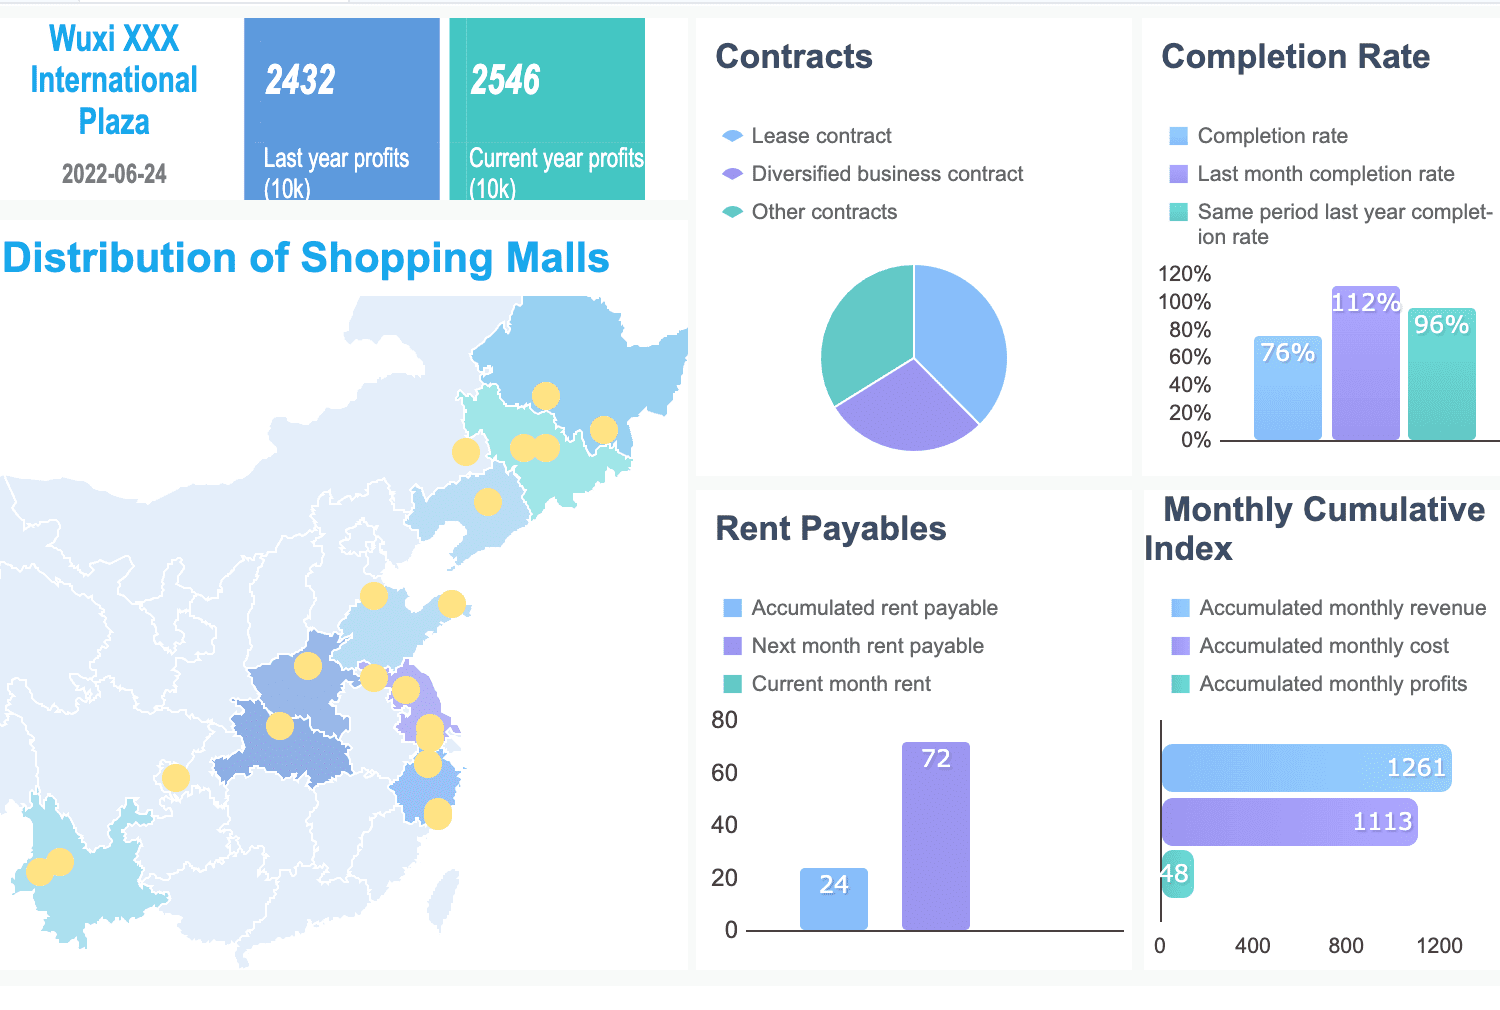
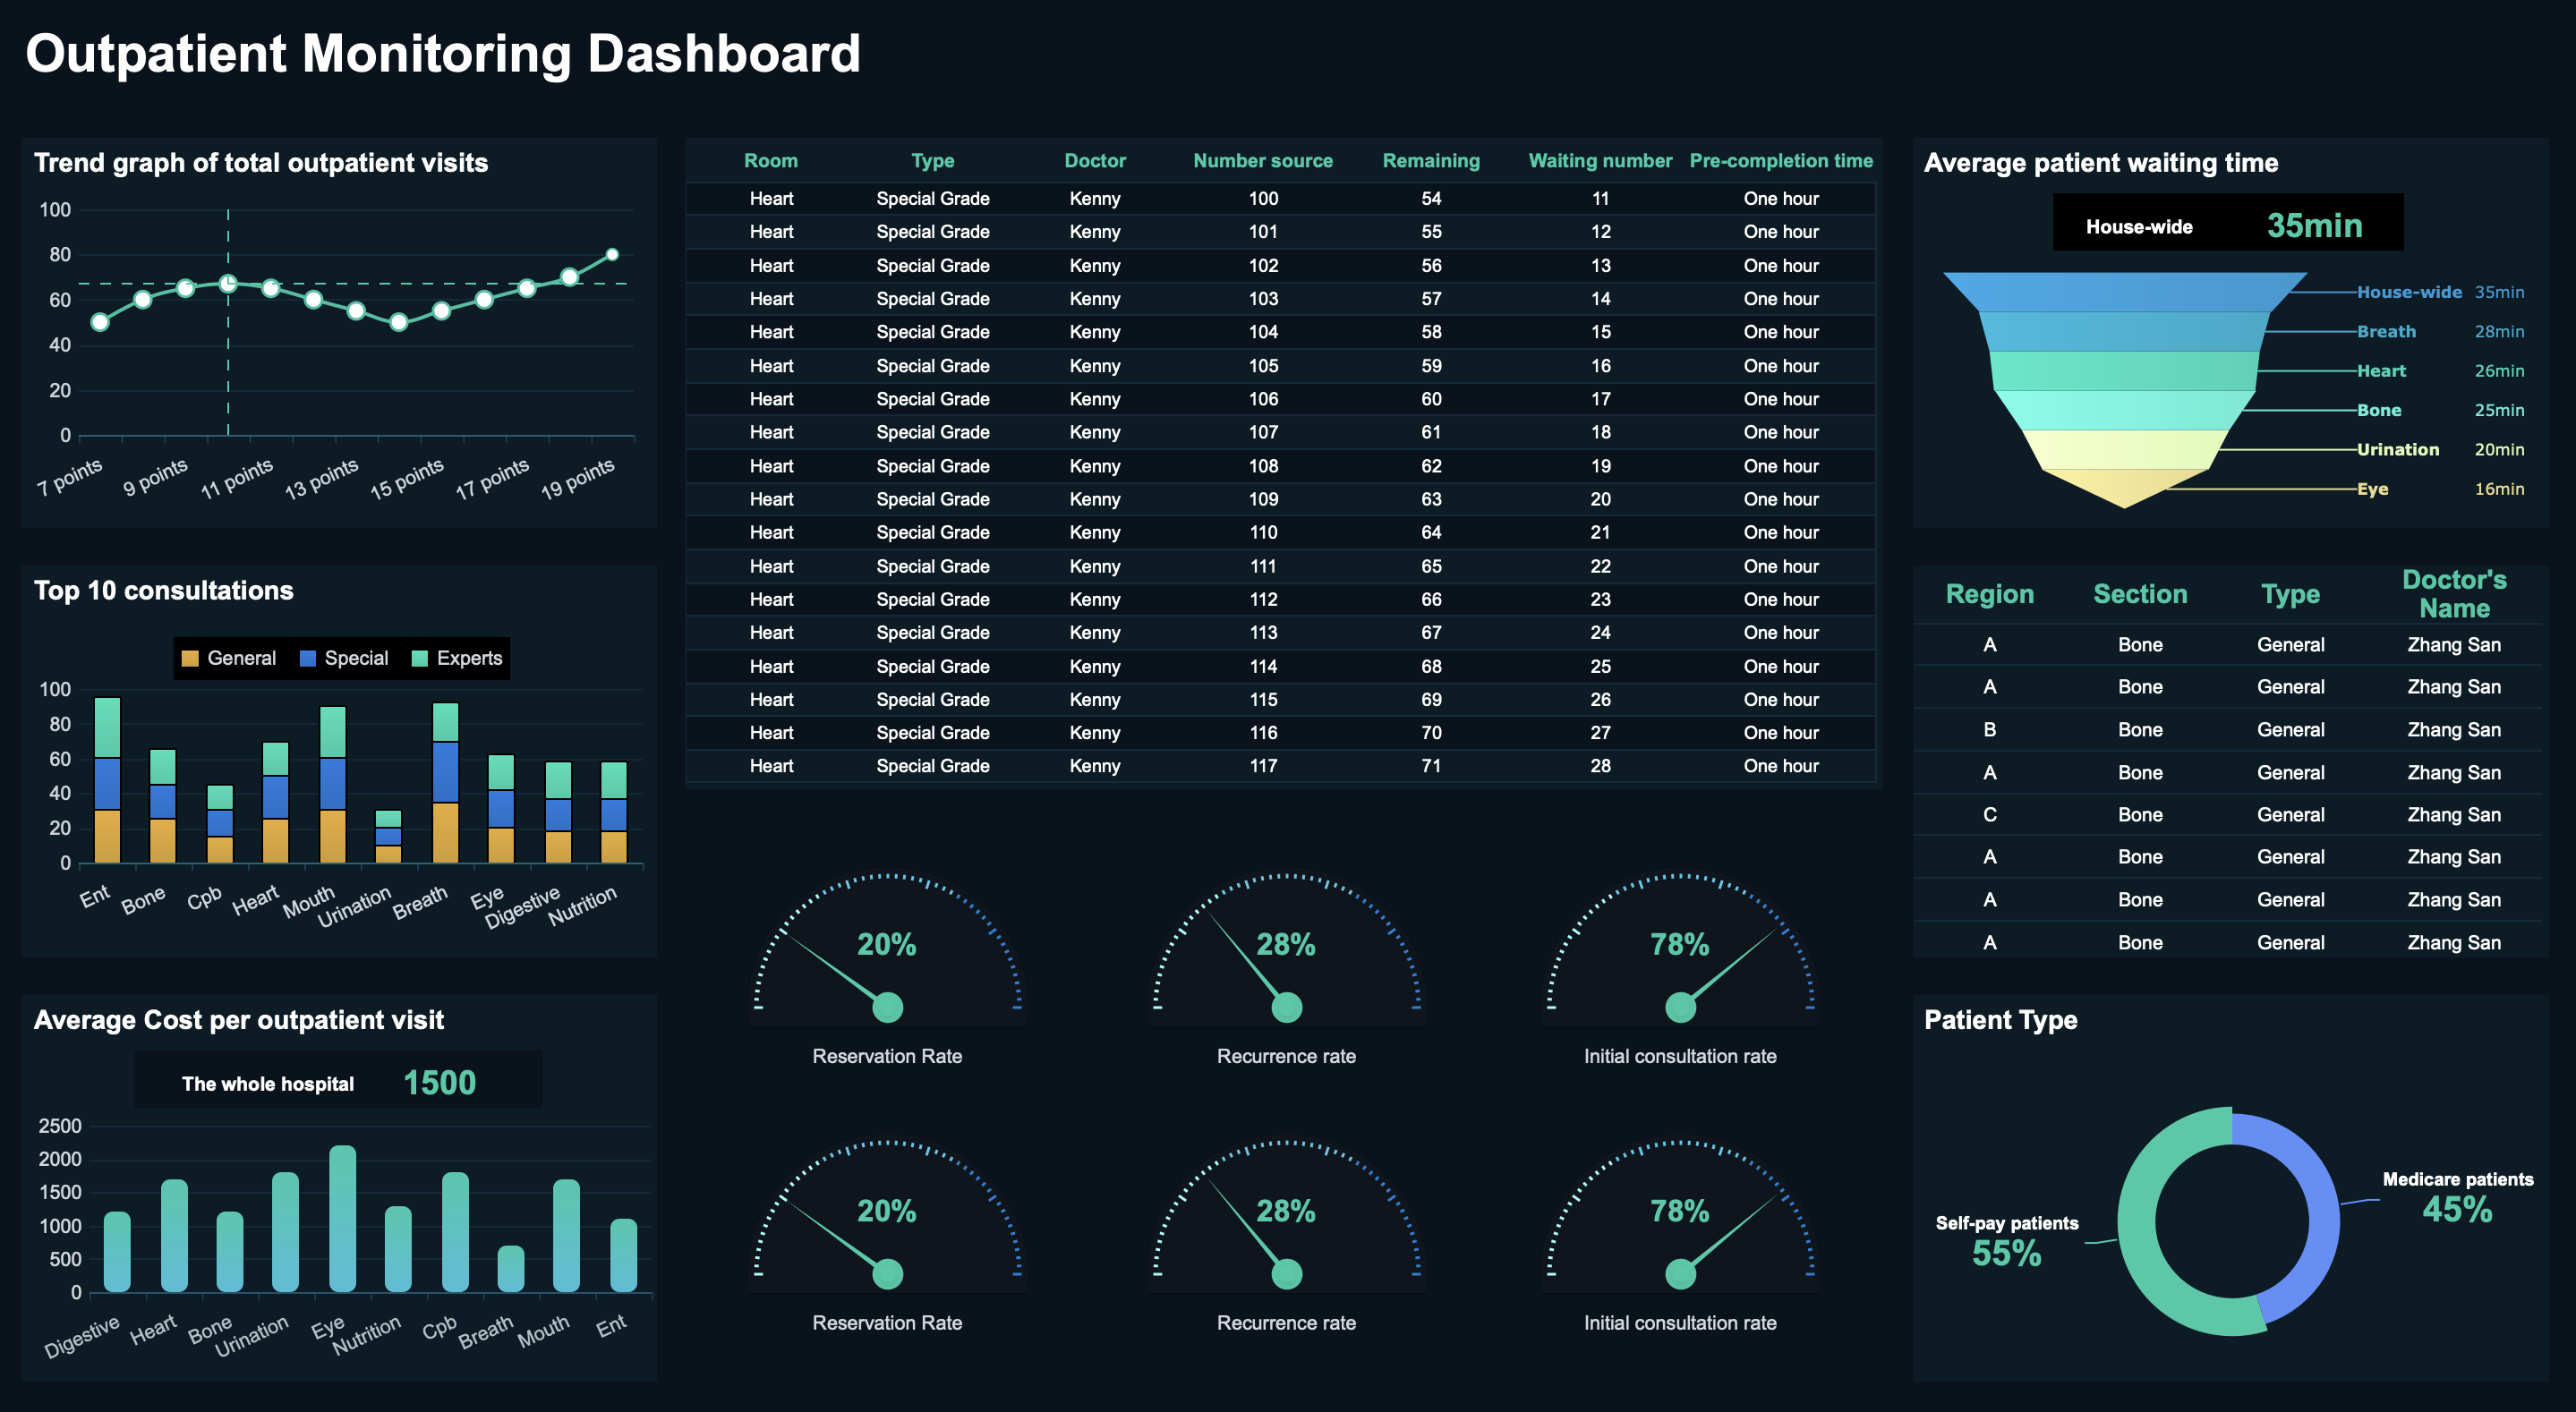
Real-time Monitoring Dashboard
Real-time Monitoring Dashboard Created by FineReport
A real-time monitoring dashboard gives you instant insights into your project. You can see data as it happens, which helps you respond quickly to changes. Dashboards improve project control and support fast decision-making. Custom views let each team member see the information they need. Automated alerts notify you about critical changes, so you can act before problems grow.
Real-time dashboards provide immediate insights for better decisions.
Proactive risk management becomes easier with quick responses to changes.
Customizable views help different stakeholders access relevant data.
Predictive analytics help you anticipate issues.
Automated alerts keep your project aligned with goals.
You can use dashboards to track progress report data, monitor KPIs, and ensure your project stays on schedule.
Many people believe that adding more details to a project report makes it better. In reality, overcomplicating your template can overwhelm your team and stakeholders. When you fill your progress report with too much information, you risk hiding the most important points. Stakeholders may feel confused and miss key messages. This confusion can slow down decision-making and hurt your project’s success.
Evidence
Explanation
Overcomplicated report templates can overwhelm stakeholders with unnecessary details.
This leads to confusion and miscommunication, which negatively impacts project outcomes by hindering decision-making.
Disorganized project reporting is a major pitfall.
It can obscure key messages, making it difficult for stakeholders to engage effectively.
Clear, concise messaging ensures alignment.
Simplicity in communication fosters better understanding and engagement among team members.
You should keep your progress report template simple and organized. Use clear sections and focus on the main goals of your project. Choose visuals that highlight trendswithout crowding the page. Automation and flexible tools, like FineReport, help you focus on analysis instead of gathering data. This approach keeps your progress report clear and useful.
Tip: Always review your report before sharing. Remove any extra details that do not support your project’s main objectives.
Ignoring Needs
Another common mistake is ignoring the needs of your audience. If you do not check in with report recipients, your project reports may become irrelevant. You should always ask for feedback and make sure your progress report answers the right questions. Using a status report template or a progress report template helps you stay consistent and meet expectations.
Here are some mistakes to watch out for:
Failing to meet audience needs
Using inconsistent formats
Overloading reports with data
Not using reports in meetings
Ignoring mistakes instead of learning from them
When you use standardized templates and focus on your audience, you make your project reports more effective. You help your team stay aligned and informed. Remember, a good progress report supports better decisions and keeps your project moving forward.
To choose the best free report template, follow these steps:
Identify your purpose and scope by talking with stakeholders.
Set a timeline for reporting.
Gather your data needs.
Create and review your template.
Update it as your project changes.
The right template makes your work easier and more efficient. For example, a Gantt chart helps you plan, while a Kanban board shows task progress. Always focus on clarity and fit. This approach helps everyone understand the project and supports better decisions.
Real-time insights to optimize production, logistics, and decisions.
FAQ
How do I know which report template fits my project?
You should match the template to your project goals and audience. Look for templates that highlight your key data and support your reporting needs. Test a few options to see which one helps you communicate best.
Can I customize free report templates in FineReport?
Yes, you can easily customize templates in FineReport. Use the drag-and-drop designer to add charts, change layouts, and apply your company’s branding. This flexibility helps you create reports that fit your exact requirements.
What types of data sources can FineReport connect to?
FineReport connects to many data sources, including databases, Excel files, and cloud platforms. You can pull real-time data from multiple places, making your reports accurate and up to date.
How do I make my reports easy to read?
Keep your layout simple. Use clear headings, bullet points, and charts to highlight important information. Avoid clutter. Ask for feedback from your team to improve readability.
Is FineReport suitable for different industries?
Yes, FineReport works well for many industries. You can use it for manufacturing, retail, finance, EHS, and more. The templates and features adapt to your specific business needs.