You need structure, clarity, and actionable insights to create a strong monthly report for your business. Effective monthly business reports help managers measure performance and support strategic decisions. FineReport from FanRuan streamlines the process and improves efficiency, as shown below:
| Feature/Benefit | Impact on Efficiency |
|---|---|
| Quick report generation | Reduces time spent on report creation |
| Seamless integration with various systems | Enhances data accessibility and reduces manual effort |
| Connection to multiple data sources | Improves data management and decision-making capabilities |
| Unified data decision and management platform | Streamlines reporting processes and enhances accuracy |
A well-designed report allows you to spot trends, validate insights, and align with your business goals.
Before you start your monthly business report, you need to set clear objectives. This step helps you focus your analysis and ensures your report meets the needs of your audience. Most businesses use monthly management reports to track performance, support decision-making, and find areas for improvement. You can use these objectives to guide your reporting process:
You should also identify your target audience. Gather information about your team or stakeholders, look for patterns in their needs, and create personas that represent different segments. Use feedback to make sure your report matches their expectations. Tailoring your monthly business report to your audience helps you communicate key accomplishments and insights more effectively.
| Step | Description |
|---|---|
| Gather data | Collect demographic information, purchasing behavior, and social media interactions of existing customers. |
| Identify patterns | Look for commonalities among customers, such as demographics, interests, and pain points. |
| Create personas | Develop detailed buyer personas representing different audience segments, including traits and goals. |
| Validate personas | Gather feedback from customers and stakeholders to ensure personas reflect actual needs and preferences. |
| Use personas | Tailor marketing messages and strategies based on insights from personas to meet audience expectations. |
Tip: Setting objectives and knowing your audience makes your monthly report more relevant and actionable.
You need to gather and organize data from multiple sources to create a strong monthly business report. Many businesses face challenges like manual workflows, inconsistent data, and skill shortages. FineReport helps you overcome these problems by integrating data from various systems and automating the reporting process.
| Connection Method | Description |
|---|---|
| JDBC | Java Database Connectivity |
| JNDI | Java Naming and Directory Interface |
| SAP | Integration with SAP systems |
| XMLA | XML for Analysis |
| FineBI | Integration with FineBI for business intelligence |
Follow these monthly reporting best practices to organize your data:
FineReport supports these steps by connecting to multiple data sources and providing templates for monthly financial business report, monthly performance report, and other monthly business reports. You can use these templates to save time and improve accuracy.
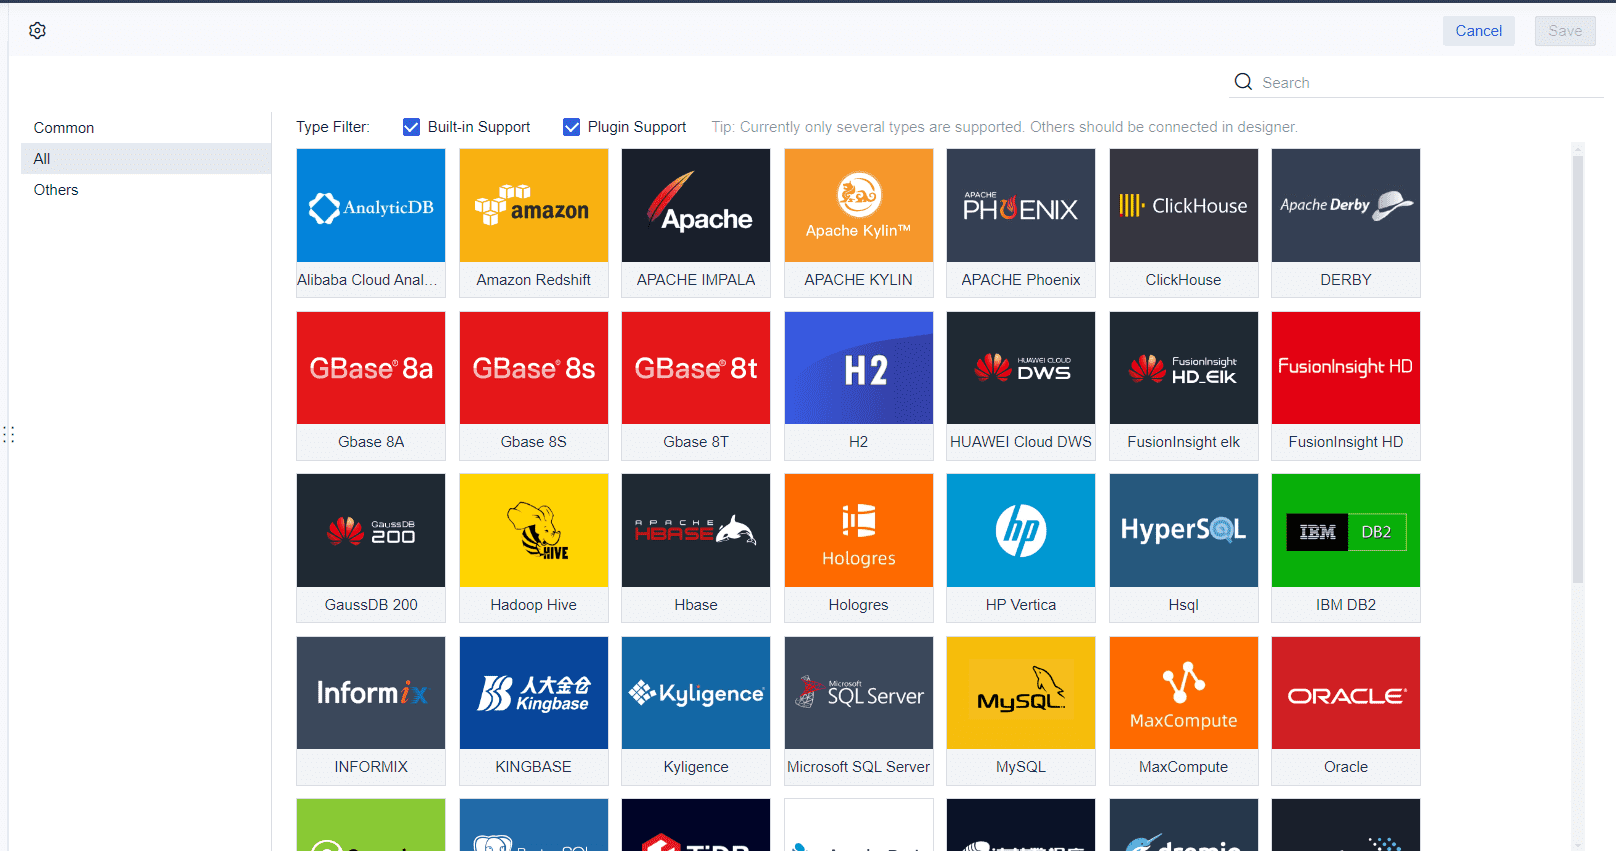
Note: Automating data collection and using a centralized platform like FineReport reduces errors and helps you deliver reliable monthly business reports.
A strong monthly report gives you a clear view of your business. You need to organize your monthly business report into sections that make it easy to read and understand. Each section helps you track performance, analyze data, and share key accomplishments with your team.
Tip: Use monthly report templates to keep your reports consistent and professional.
Here are the essential sections you should include in your monthly business report:
FineReport by FanRuan supports multi-source data integration and dynamic report layouts. You can use its templates to create monthly management reports, monthly financial business reports, and monthly performance reports. The platform lets you merge data from different sources and display it in a way that fits your business needs.
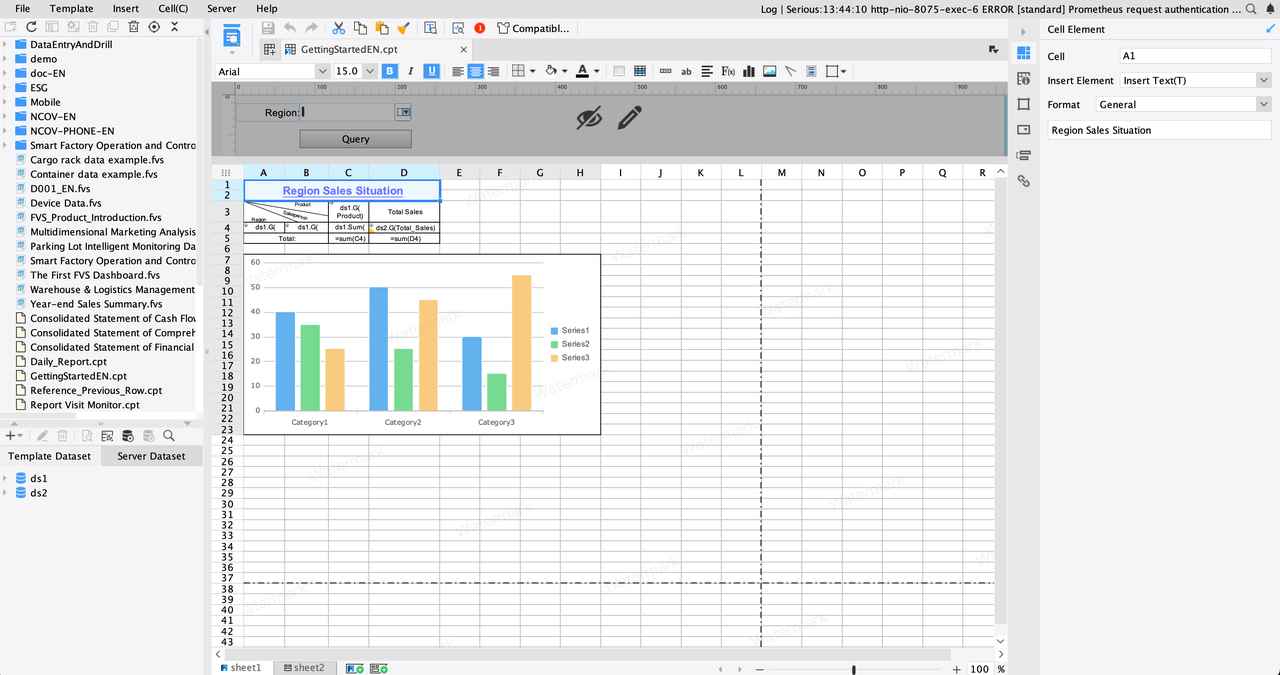
Start your monthly business report with an executive summary. This section gives your readers a quick overview of the report and highlights the most important points. You set the stage for the rest of the report and help your audience understand the purpose and main findings.
| Key Element | Description |
|---|---|
| Introduction or background | Sets the stage for the report, explaining the problem or opportunity addressed. |
| Objectives or goals | Clarifies what the document aims to achieve, including specific outcomes or targets. |
| Key findings or main points | Highlights critical insights or discoveries from the full document. |
| Recommendations or proposed actions | Suggests steps or actions based on the findings, providing clear, actionable recommendations. |
| Conclusion or impact | Wraps up the summary with a statement on the significance of the proposed actions. |
You should include important metrics that inform high-level decisions. Show year-to-date actuals and forecasts. Add critical financial ratios to highlight business performance areas. This approach helps your team focus on what matters most.
Key metrics show how your business is performing. You need to track these numbers every month to measure progress and spot trends. Monthly business reports often include financial performance, sales, and customer data.
| Metric | Description |
|---|---|
| Sales Revenue | Total income from sales after returns. |
| Revenue Growth | Year-over-year sales performance expressed as a percentage. |
| Gross Profit Margin | Percentage of profit from sales after deducting the cost of goods sold. |
| Net Profit Margin | Profit percentage after accounting for all expenses. |
| Customer Acquisition Costs | Cost associated with acquiring a new customer through marketing efforts. |
You can also track customer concentration to see if you rely too much on a few customers. Monthly sales reports and monthly marketing reports help you understand your strengths and weaknesses. Use monthly reporting best practices to choose metrics that match your business goals.
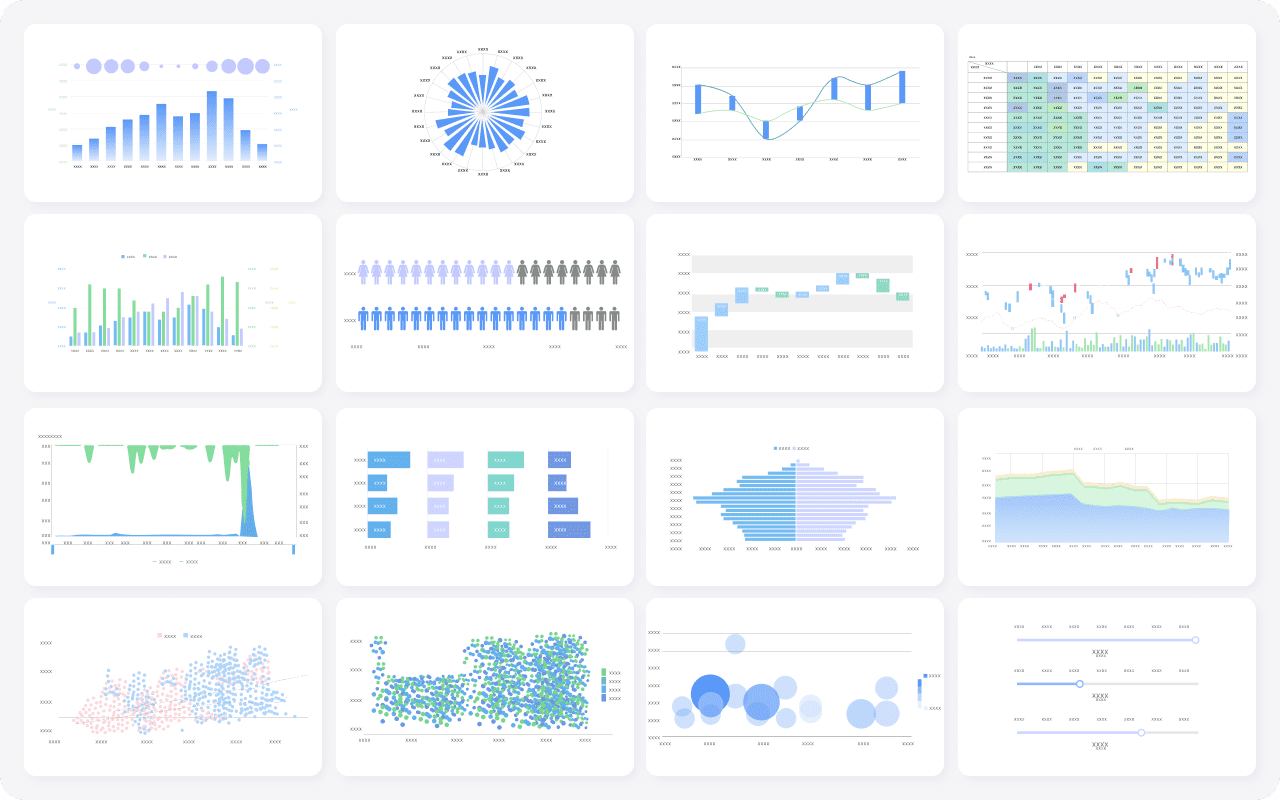
Data visualization makes your monthly business report easier to understand. Charts, graphs, and dashboards turn complex data into clear visuals. You help your team see trends and patterns quickly.
FineReport lets you create dynamic charts and dashboards. You can filter data by month or other parameters. This feature gives you tailored views for monthly performance reports and overall actual performance. You can use dashboard layouts to display key metrics and analysis side by side.
| Key Element | Influence on Clarity and Usefulness |
|---|---|
| Proper classification of data | Helps users access needed information easily and demonstrates professionalism in report preparation. |
| Visual elements | Enhances clarity by avoiding overcrowding and ensuring important data stands out. |
| Self-service analytics tools | Facilitates user engagement and allows for personalized data exploration, improving understanding. |
You need to update your team on ongoing projects in every monthly business report. This section shows progress, challenges, and next steps. You can include project status, financial performance, and individual team member achievements.
FineReport supports dynamic layouts, so you can display multiple project updates in one report. You can use templates to organize project data and highlight key accomplishments. This approach helps everyone stay informed and aligned with business goals.
Note: A well-structured monthly report improves communication and decision-making across your business.
You can make your monthly business report more effective by using visuals. Charts and graphs help you turn complex data into clear information. When you use visuals, you help your audience see trends and patterns quickly. For example, a line chart can show changes in sales performance over time. A bar graph can compare this month’s results to last month or to industry standards. These tools give context and clarity to your message.
FineReport makes it easy to add visuals to your monthly business report. Its drag-and-drop designer lets you build charts, dashboards, and tables without coding. You can use templates to display key performance indicators and highlight key accomplishments. With FineReport, you can also create mobile dashboards. This feature lets you share your monthly performance report with your team on any device, so everyone stays informed.
Tip: Use visuals to illustrate important data points and make your report more engaging for your business audience.
You should keep your monthly business report clear and to the point. Focus on the most important data and avoid overwhelming your audience with too much information. Use short paragraphs and clear headings to guide readers through each section. This approach helps business leaders and team members find what they need quickly.
FineReport supports concise reporting with its flexible template options. You can organize your data and performance highlights in a way that matches your business needs. The mobile dashboard feature also ensures that your report remains readable on any device.
Note: A concise monthly report saves time and helps your business make better decisions.
You can save time and improve visibility by automating your monthly business report process. Automated reporting supports smarter and faster decision-making for your business. FineReport helps you set up scheduled distribution, so your team receives updates on business matters and progress without manual effort. You can use monthly report templates to keep your reports consistent and professional.
Here are some effective tips for automating your monthly report:
| Tip | Description |
|---|---|
| Use BI Tools | Implement tools like FineReport for scheduling and customizing report delivery. |
| Set Delivery Rules | Configure rules based on schedule, content, or recipient group. |
| Prioritize Security | Encrypt and password protect reports to maintain data security. |
| Refine Filters | Adjust filters and distribution lists to improve report relevance. |
Tip: Use customizable templates to adapt reports for your business needs and ensure all necessary information is included.
Accuracy is essential for every monthly business report, especially when you track financial performance and other critical metrics. You need to use accounting and data analytics systems to manage financial data. Regular checks and audits help you find and fix mistakes in your monthly financial business report.
Follow these strategies to ensure accuracy in your monthly report:
Note: Accurate data in your monthly performance report, monthly marketing report, and monthly sales report builds trust and supports informed decisions.
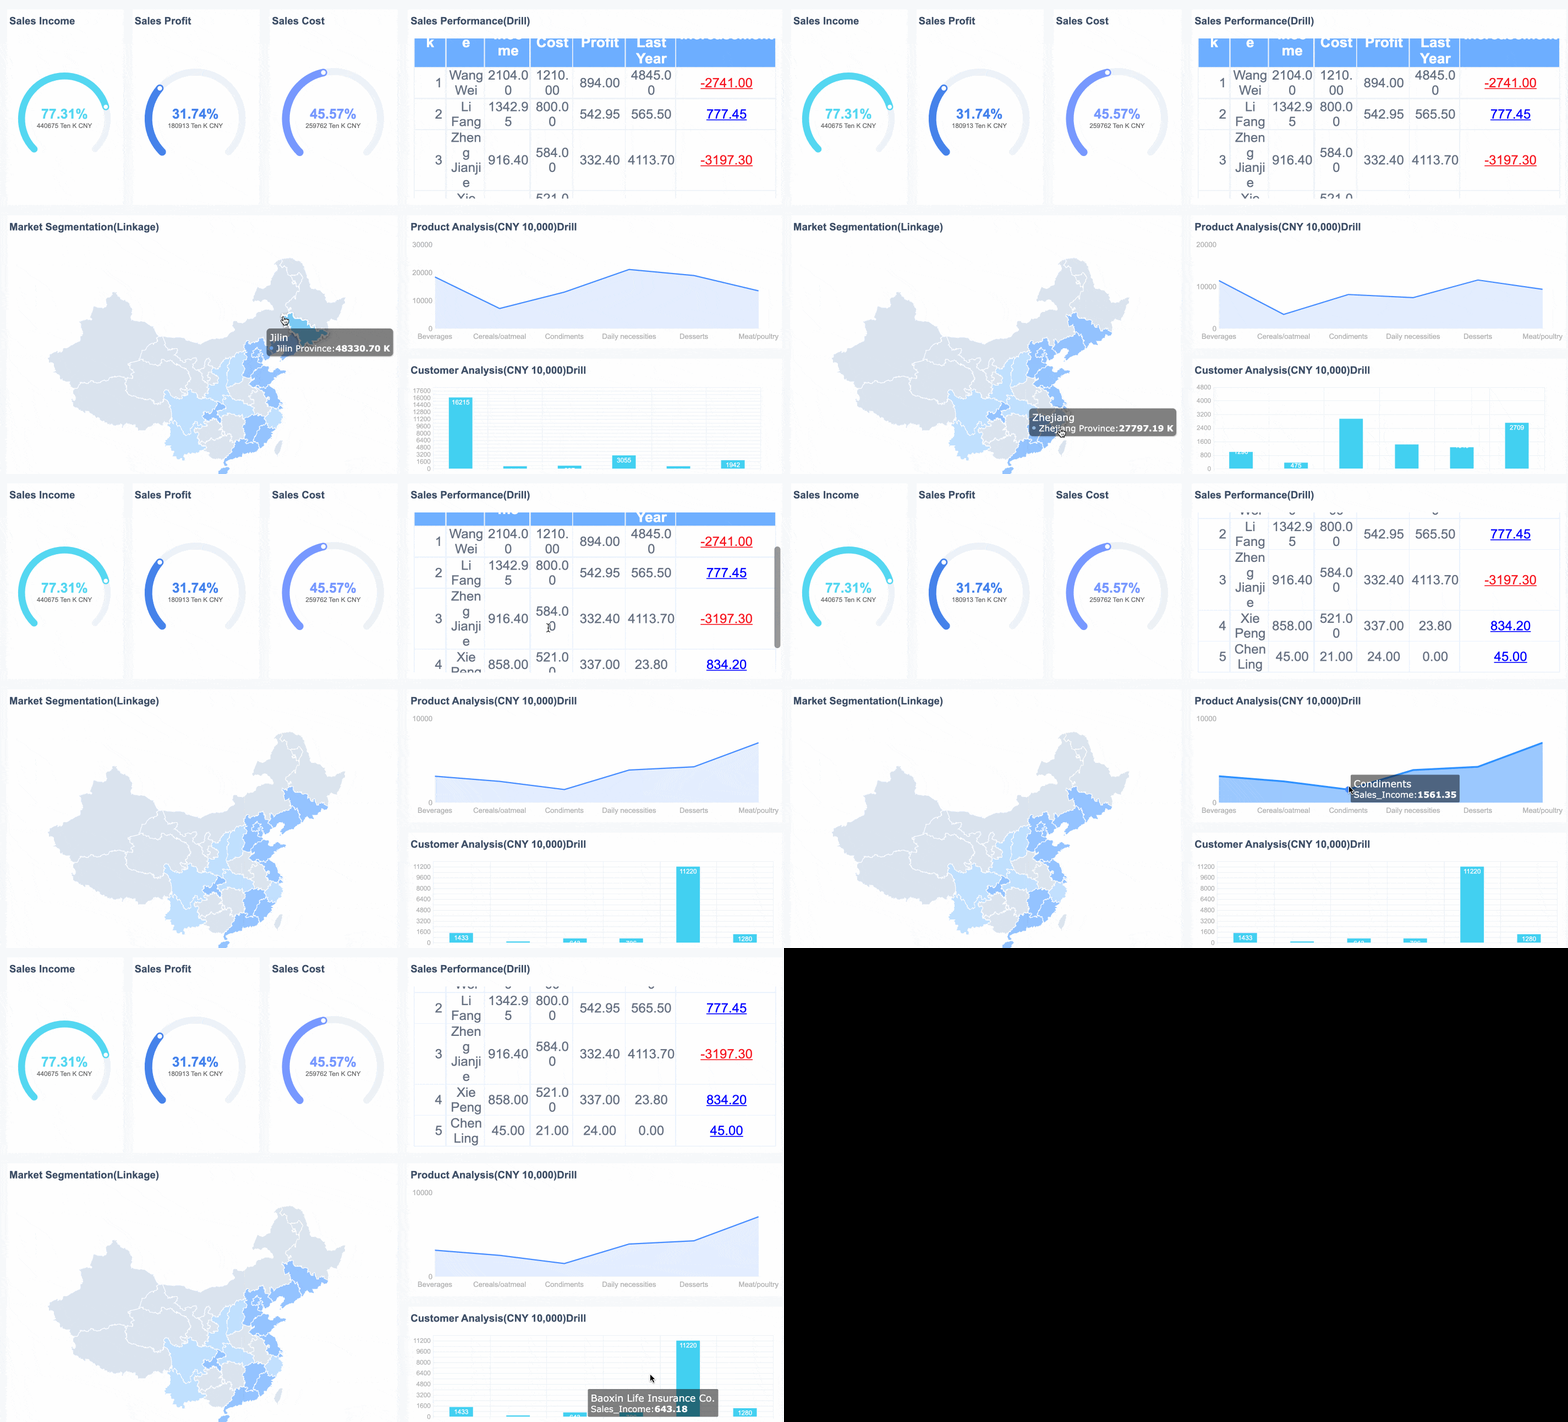
You can use a FineReport template to track sales results and improve your business strategy. The monthly report template includes several key components that help you understand your sales data. You see an overview with total sales for the month, the number of deals signed, and the average deal value. You also get details about product or service sales, which lets you compare performance across different offerings. The template shows sales by region, so you can manage resources based on local results. You can review the performance of each sales rep, including their closing rates and transaction volumes. The lead-to-conversion ratio tells you how many leads you need to make a sale. You can also analyze why some deals were lost. This monthly business report helps you identify strengths and areas for improvement.
Tip: Use these templates to keep your sales data organized and make better decisions for your business.
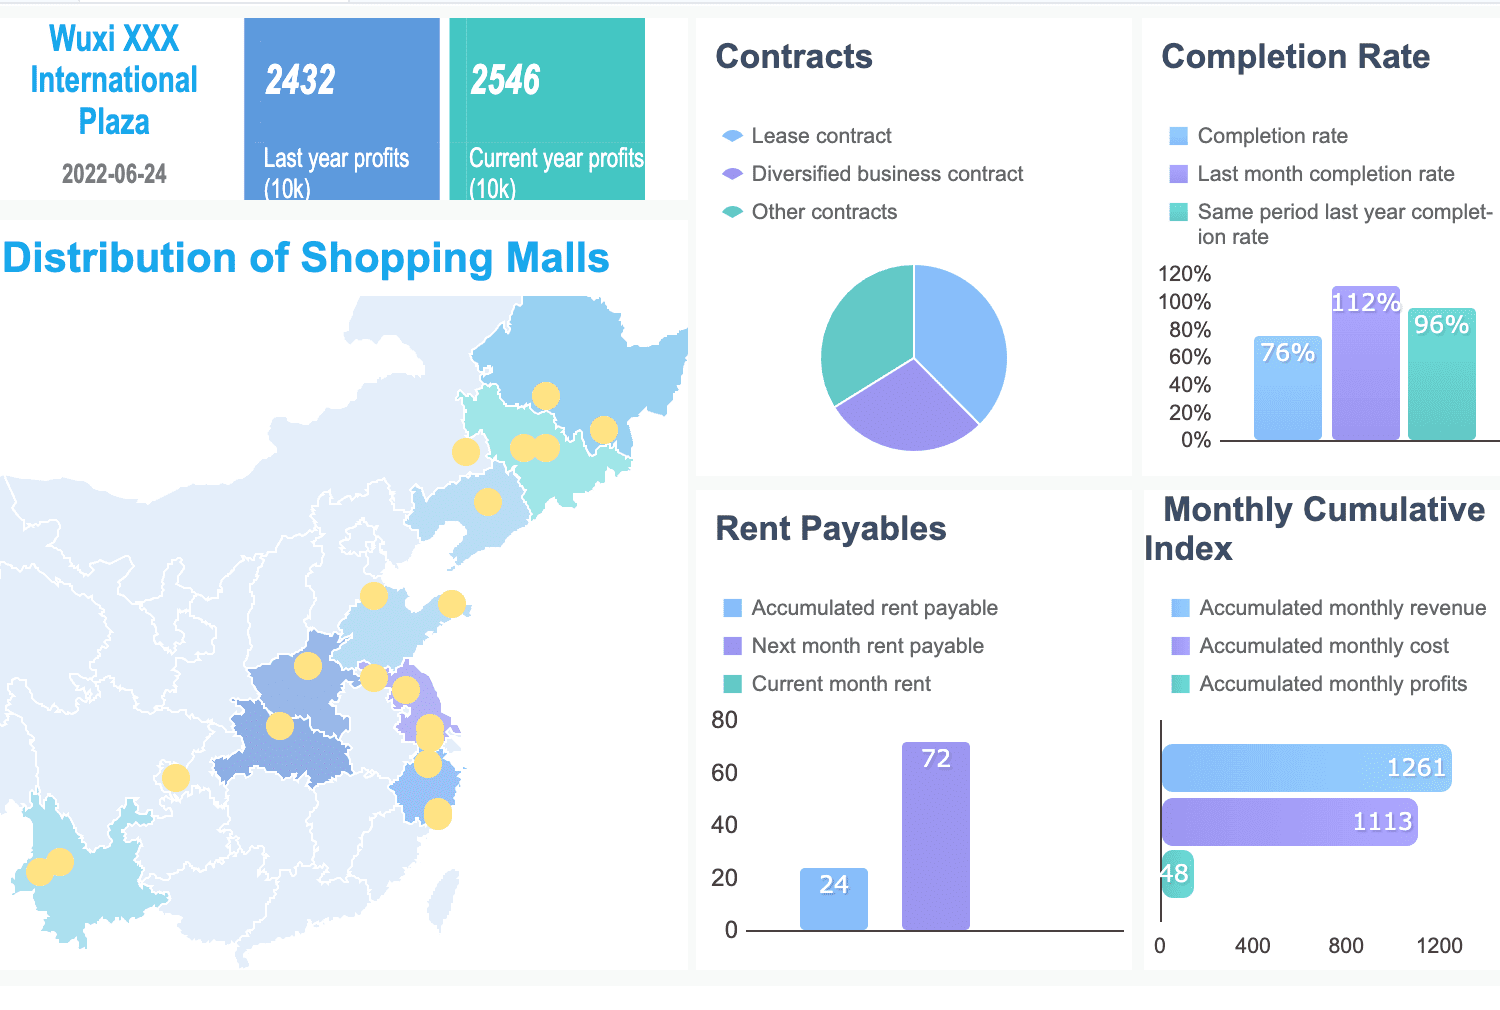
FineReport makes it easy for you to create a monthly financial report that supports business growth. The platform connects data from systems like OA, CRM, and ERP. You can generate reports quickly and analyze financial data in one place. FineReport integrates with BI systems, so you can visualize trends and spot issues early. You get a centralized view of your financial performance, which helps you make informed decisions. The template lets you automate report generation and distribution, saving time and reducing errors. You can customize the template to match your business needs and ensure consistency across all reports.
Note: FineReport helps you manage financial data efficiently and supports better decision-making for your business.
You can use FineReport to create a monthly manufacturing report that improves your business operations. The template offers many advantages for manufacturing companies. You get enterprise-level reporting that uses your data effectively. FineReport provides enhanced reporting functions, which go beyond traditional Excel reports. You save on development and maintenance costs. The platform integrates multiple data sources, giving you a complete view of your operations. You can use visual charts to show business data value clearly. The template includes simple data entry functions for better management. You can manage staff, reports, and permissions easily. FineReport supports web application deployment and mobile access, so you can view reports and notifications anytime. You can build dashboards using drag-and-drop components.
| Advantage | Description |
|---|---|
| Enterprise Reporting | Uses business data for effective reporting. |
| Enhanced Reporting | Offers more functions than Excel. |
| Cost Efficiency | Lowers development and maintenance costs. |
| Data Integration | Combines multiple data sources. |
| Visual Representation | Shows business data with clear charts. |
| Data Entry | Simplifies data management. |
| Report Management | Manages staff, reports, and permissions. |
| Web Application Deployment | Integrates with existing systems. |
| Mobile Access | Lets you view reports anywhere. |
| Dashboard Creation | Builds dashboards with drag-and-drop tools. |
Tip: FineReport templates help you track monthly performance and improve your business with better data management.
You can transform your business by following a clear process for your monthly report. Start with structure and focus on clarity. Actionable insights help your team make better decisions. Many businesses see real results:
FineReport from FanRuan gives your business powerful tools for reporting:
| Feature | Benefit |
|---|---|
| Automated data processing | Reduces manual work and errors, improving accuracy. |
| Template creation | Generates reports automatically, saving time. |
| Advanced visualization capabilities | Improves data analysis and decision-making. |
| Interactive data visualization | Lets you explore data for deeper insights. |
| Batch reporting | Boosts productivity across your business. |
Start using these steps and tools to improve your business reports today.
Click the banner below to try FineReport for free and empower your enterprise to transform data into productivity!

The Author
Lewis
Senior Data Analyst at FanRuan
Related Articles

Top 10 Best Automation Reporting Tool Picks for Businesses
Compare the top 10 best automation reporting tool options to streamline business data, automate reports, and boost decision-making efficiency.
Lewis
Jan 03, 2026
Top 10 Reporting Systems and Tools for Businesses
See the top 10 reporting systems that help businesses automate data, build dashboards, and improve decision-making with real-time analytics.
Lewis
Jan 03, 2026

What is integrated reporting and why is it important
Integrated reporting combines financial and non-financial data, offering a full view of value creation, transparency, and stakeholder trust.
Lewis
Dec 12, 2025