Portfolio performance reporting is the operating system for capital allocation decisions. If executives, finance teams, portfolio leaders, and operators are all looking at different numbers, decisions slow down, accountability weakens, and value creation gets buried in spreadsheet noise. A strong reporting framework gives enterprise teams one shared view of what is growing, what is deteriorating, where capital is productive, and which actions matter next.
Click To Try The Dashboard
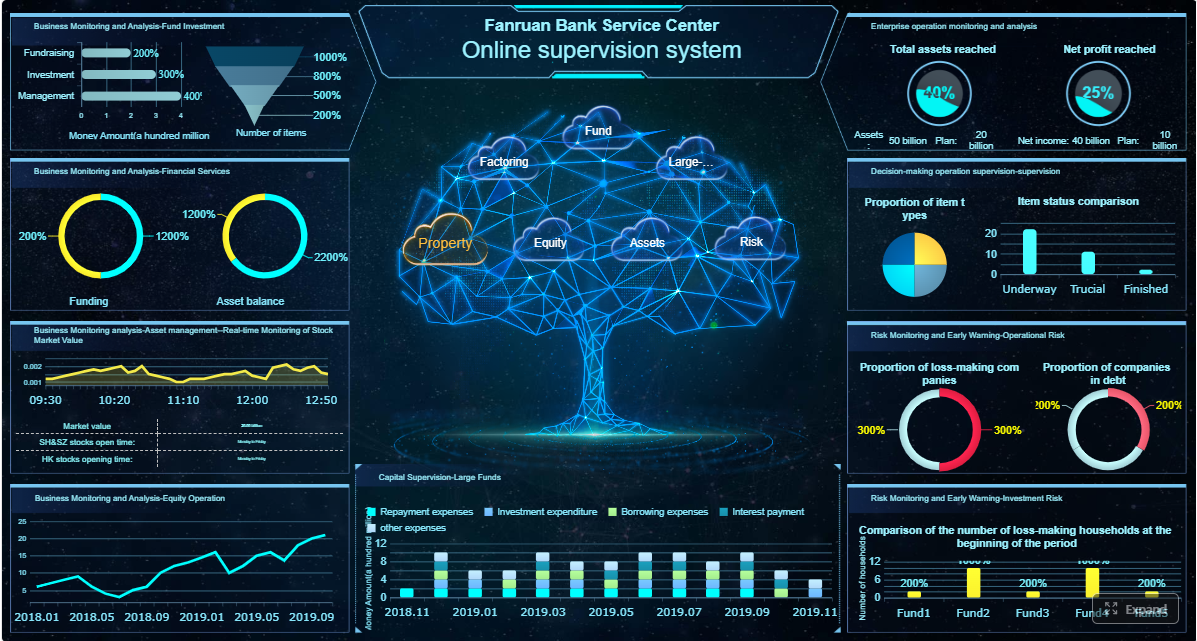
All reports in this article are built with FineReport
Portfolio performance reporting framework: the 12 metrics that matter most
A reporting framework is not just a dashboard. It is the agreed structure behind the dashboard: what gets measured, how each metric is defined, how often it is updated, which source system is trusted, and what action should follow when a number moves outside tolerance. In enterprise settings, this matters because portfolio performance reporting must align board-level oversight with day-to-day execution.
Teams need one shared framework for three reasons:
Decision speed: Leaders can spot underperformance faster and act before issues compound.
Cross-entity comparability: Different business units, geographies, or portfolio companies can be evaluated on common rules.
Governance discipline: Finance, operations, and investment teams stop debating definitions and focus on decisions.
Just as important, strong reporting separates three layers of insight:
Raw results: The basic output, such as revenue, margin, cash, or valuation.
Trend analysis: Whether results are improving, deteriorating, or becoming more volatile over time.
Decision-ready reporting: Results plus context, benchmark comparison, variance explanation, and recommended actions.
The 12 metrics in this article cover all three layers. Together, they help enterprise teams measure performance quality, not just performance volume.
Key Metrics (KPIs) in a portfolio performance reporting framework
Revenue growth: Measures top-line expansion in absolute and percentage terms.
EBITDA or operating margin: Shows whether growth is translating into profitable operations.
Return on invested capital (ROIC): Evaluates how efficiently capital generates returns.
Net asset value (NAV) and valuation change: Tracks portfolio value movement and valuation drivers.
Benchmark-relative performance: Compares outcomes to targets, peers, or market references.
Risk-adjusted return: Assesses whether returns justify the risk taken.
Capital efficiency: Measures deployment speed, utilization, and payback quality.
Debt leverage and coverage: Shows financial resilience and financing pressure.
Working capital efficiency: Reveals whether operations are tying up excess cash.
Forecast accuracy: Tests planning quality and management discipline.
Exit readiness or strategic milestone progress: Connects operational execution to value realization timing.
How to measure portfolio performance consistently across teams
Consistency is where most reporting systems fail. The issue is rarely a lack of data. The real problem is fragmented logic: different teams define performance differently, report on different timelines, and compare different baselines.
To measure portfolio performance consistently, start with the operating questions each stakeholder needs answered:
Executives: Are we creating value, where is risk rising, and what decisions require escalation?
Finance: Are results reliable, cash-backed, and aligned to plan?
Operations: Which performance gaps are operational, and what levers can close them?
Portfolio leaders: Which entities deserve more capital, intervention, or strategic review?
From there, standardize three foundational rules:
Set a common reporting cadence. Monthly operating review, quarterly strategic review, and rolling trend visibility usually work best.
Define a data source hierarchy. ERP, consolidation tools, treasury systems, CRM, and planning systems should each have a designated role.
Lock calculation rules. Margin, cash flow, ROIC, leverage, and forecast variance must be defined once and used everywhere.
Before comparing results, establish:
Baseline periods: Prior month, prior quarter, prior year, and entry baseline where relevant.
Thresholds: Green, amber, and red rules tied to escalation logic.
The last point is critical: good portfolio performance reporting does not mean creating more dashboards. It means creating fewer dashboards with clearer decisions attached to them. Most stakeholders only need one audience-specific view plus drill-down access when exceptions appear.
1) Revenue growth
Revenue growth is the first signal most stakeholders ask about, but it must be broken down correctly to be useful. Enterprise teams should track:
Absolute growth: The dollar increase in revenue.
Growth rate: The percentage increase relative to the prior period.
Contribution by unit or company: Which entities are driving overall growth.
A mature portfolio performance reporting process compares revenue growth against:
Plan
Prior period
Same period last year
Relevant market or sector conditions
That context matters. Ten percent growth in a shrinking market may indicate strong execution. The same result in a booming market may signal share loss.
Top-line expansion without margin discipline often masks weak value creation. EBITDA or operating margin shows whether the portfolio is scaling efficiently or simply buying growth at a high cost.
Track:
Margin percentage by entity
Period-over-period margin change
Variance versus plan
Margin bridge by price, volume, mix, labor, and overhead
Use this metric to flag margin compression early. Falling margins usually point to issues in one of four places:
Pricing power erosion
Input cost pressure
Inefficient execution
Unfavorable product or customer mix
For enterprise operators, this is one of the fastest ways to move from reporting into action.
3) Cash flow performance
Reported earnings are important, but cash determines resilience. A portfolio can look healthy on paper while facing serious operating stress if cash flow is weak.
Focus on:
Operating cash flow
Free cash flow
Cash conversion
Cash flow trend versus EBITDA
This metric helps leaders answer a simple but essential question: are reported gains becoming usable liquidity? If not, the root cause is often in receivables, inventory, capital expenditure timing, or one-time working capital distortions.
4) Return on invested capital
Return on invested capital is one of the most useful metrics for comparing portfolio entities with different sizes, growth rates, or capital structures. It tells you whether deployed capital is earning enough over time.
ROIC is especially valuable when:
Comparing business units competing for capital
Testing whether transformation initiatives are paying off
Reviewing acquisitions, expansions, or restructuring efforts
In portfolio performance reporting, ROIC should never stand alone. Pair it with trend lines, cost of capital assumptions, and management commentary on what is improving or dragging returns.
Portfolio performance evaluation through value creation metrics
Once operating metrics are in place, the next layer is value creation. This is where portfolio performance evaluation becomes more strategic. The objective is not just to understand what happened operationally, but whether the portfolio is becoming more valuable, more resilient, and more investable.
5) Net asset value and valuation change
Net asset value and valuation movement provide a high-level view of portfolio worth. But this metric must be handled carefully in internal reporting because valuation can move for reasons that have little to do with underlying execution.
Break valuation change into:
Operational improvement
Multiple expansion or compression
Market movement
Currency impact
Capital events
This separation is essential. Otherwise, teams may over-credit management for value changes driven primarily by market sentiment or sector rerating.
A portfolio result without a benchmark is incomplete. Benchmark-relative performance places outcomes in context by comparing actual performance against a relevant external or internal standard.
Useful benchmarks include:
Market indices
Peer groups
Budget targets
Investment committee hurdle rates
Target return bands
This metric strengthens understanding of your portfolio performance over time because it removes false comfort from isolated results. A portfolio may post positive returns and still underperform its opportunity set.
7) Risk-adjusted return
High returns can hide fragile economics. Risk-adjusted return improves reporting quality by asking whether returns were achieved efficiently or by taking excessive risk.
Enterprise teams typically evaluate this using a combination of:
Volatility
Maximum drawdown
Concentration risk
Downside exposure
Return per unit of risk
This metric is especially useful when teams need to analyze and optimize portfolio performance with ease across a mixed set of businesses or investment programs. It reframes the conversation from “who grew fastest” to “who created the best quality of return.”
8) Capital efficiency
Capital efficiency measures how well resources are deployed and converted into outcomes. In large portfolios, value destruction often comes from capital stuck in low-velocity initiatives rather than obviously failing assets.
Track:
Capital deployed versus approved
Capacity utilization
Time to payback
Return by initiative
Capital trapped in delayed or underperforming programs
This helps leaders identify where resources are being tied up without sufficient progress. It also supports sharper capital reallocation decisions.
Portfolio performance reporting: key metrics for PE firms and enterprise operators
Some metrics become especially important in private equity-backed environments, multi-entity enterprises, and capital-intensive operating groups. These measures connect financial discipline with operational control.
9) Debt leverage and coverage
Debt leverage and coverage ratios show how much financial risk the portfolio carries and how much room management has to respond to volatility.
Key measures include:
Net debt to EBITDA
Interest coverage
Debt maturity profile
Floating-rate exposure
Refinancing concentration
This is not just a lender metric. It directly affects strategic flexibility. A business with tight coverage and near-term refinancing exposure has fewer options, even if operating results appear stable.
Working capital efficiency is often the fastest source of recoverable value in under-optimized portfolios. It shows how much cash is tied up in day-to-day operations.
This metric surfaces operational bottlenecks that weaken portfolio-wide performance. It is also one of the clearest areas where finance and operations should collaborate directly.
11) Forecast accuracy
Forecast accuracy is a governance metric disguised as a planning metric. If forecasts consistently miss actuals, the issue is rarely just model quality. It usually points to weak assumptions, poor communication, or limited operational accountability.
Track:
Revenue forecast variance
Margin forecast variance
Cash flow forecast variance
Bias direction, whether optimistic or conservative
Accuracy by entity, function, and forecast horizon
Good portfolio performance reporting uses recurring forecast gaps to improve assumptions, tighten governance, and clarify who owns corrective action.
12) Exit readiness or strategic milestone progress
Not every portfolio aims for an external sale, but every portfolio needs a value realization path. That may mean divestiture, integration, geographic expansion, digital transformation, or operational turnaround.
Measure readiness through milestone-based indicators such as:
Commercial expansion progress
ERP or systems integration completion
Leadership hiring completion
Compliance or audit readiness
Customer concentration reduction
Margin and cash flow normalization
This metric connects execution to timing. It tells leadership whether value is merely planned or truly becoming realizable.
Building reports that turn metrics into action
The best portfolio performance reporting does not overwhelm stakeholders with data. It organizes metrics by audience and pairs every result with explanation and action.
A practical reporting design looks like this:
Board view
Focus on:
Portfolio value movement
Return versus benchmark
Leverage and liquidity risk
Major underperformance flags
Strategic milestone status
Executive team view
Focus on:
Revenue, margin, cash flow, and ROIC trends
Variance versus plan
Operational bottlenecks
Capital allocation priorities
Recommended interventions
Portfolio manager view
Focus on:
Entity comparisons
Trend diagnostics
Root-cause breakdowns
Leading indicators
Escalation thresholds
Operator view
Focus on:
Working capital
Margin drivers
Forecast variance
Milestone completion
Functional accountability
Every dashboard should include three supporting elements beside each major metric:
Variance explanation: What changed and why
Decision implication: Why this matters now
Recommended action: What should happen next
This is how you move from passive reporting to decision support. It is also the best way of checking your portfolio performance without reducing reporting to a compliance exercise.
Most reporting breakdowns are structural, not technical. The dashboards may look polished, but the process underneath is weak. Here are the most common mistakes.
1. Tracking too many disconnected metrics
When everything is measured, nothing is prioritized. Avoid dashboards that list dozens of KPIs without a clear decision purpose.
Best practice: Limit top-level reporting to the metrics that directly support capital allocation, intervention, and accountability.
2. Mixing inconsistent definitions
Revenue, EBITDA, free cash flow, and leverage often get calculated differently across entities. That destroys comparability.
Best practice: Publish a reporting dictionary with approved formulas, source systems, ownership, and exception rules.
3. Reporting only historical outcomes
Rear-view reporting delays action. Enterprise teams need leading indicators, not just lagging results.
Best practice: Pair outcome metrics with forward-looking indicators such as forecast accuracy, milestone progress, pipeline quality, or capacity utilization.
4. Treating tools as the framework
A BI tool cannot solve a governance problem by itself. Technology should support the framework, not define it.
Best practice: Decide what stakeholders need to learn, what decisions they need to make, and what thresholds trigger action before designing dashboards.
Best practices for implementing portfolio performance reporting
If you want portfolio performance reporting to work across a complex enterprise, implementation has to be disciplined. These are the steps seasoned operators use.
1. Start with decision use cases, not visuals
Define the recurring decisions the report must support:
This prevents definition drift as reporting scales.
3. Build exception-based reporting
Not every stakeholder needs every number every week. Use threshold-based alerts and red-amber-green logic so attention goes to what changed materially.
Define materiality thresholds
Flag outliers automatically
Require commentary only on material variances
Escalate unresolved risks on a set timeline
4. Design for drill-down, not clutter
Executives need summary. Analysts need detail. Operators need root cause. The right approach is layered reporting.
Start with a concise summary page
Enable drill-down by entity, region, or function
Preserve one metric definition across every layer
Show trend, variance, and action in the same workflow
5. Review and refine quarterly
A reporting framework is not static. Portfolio priorities evolve.
Retire metrics no longer tied to decisions
Add leading indicators where blind spots persist
Reassess thresholds as the portfolio matures
Validate whether the reports changed actual decisions
Build portfolio performance reporting faster with FineReport
Building this manually is complex; use FineReport to utilize ready-made templates and automate this entire workflow.
For enterprise teams, the challenge is rarely just visualization. It is connecting data across ERP, finance, operations, and portfolio systems; standardizing KPI logic; controlling permissions by audience; and delivering reports that are both executive-friendly and drill-down ready. FineReport helps solve that at scale.
Build audience-specific dashboards for boards, executives, portfolio managers, and operators
Standardize KPI calculations across entities and reporting cycles
Connect multiple enterprise data sources into one reporting layer
Automate refreshes, alerts, and scheduled distribution
Use interactive dashboards for variance analysis, trend review, and action tracking
Get Ready-to-Use Dashboard Templates in Fine Gallery
FineReport is especially effective when portfolio performance reporting must serve multiple stakeholders without creating multiple versions of the truth. Instead of maintaining fragmented spreadsheets and one-off presentations, teams can create a repeatable reporting framework that scales with the portfolio.
If your goal is faster reviews, better KPI governance, and dashboards that actually drive action, FineReport gives you a practical way to operationalize the framework covered in this guide.
It is a standardized structure for defining metrics, data sources, reporting cadence, and decision rules across the portfolio. Its purpose is to give executives and teams one consistent view for faster, better capital allocation decisions.
The core metrics usually include revenue growth, EBITDA margin, cash flow, ROIC, NAV or valuation change, benchmark variance, risk-adjusted return, leverage, working capital efficiency, forecast accuracy, and milestone progress. Together, they show growth, profitability, cash quality, capital efficiency, and risk.
Most teams work best with monthly operating reviews, quarterly strategic reviews, and rolling trend visibility in between. The right cadence depends on how fast the business changes and how quickly leaders need to intervene.
Use the same calculation rules, baseline periods, benchmark logic, and threshold definitions for every entity. Comparability improves when all teams rely on an agreed data source hierarchy and a shared reporting calendar.
It shows whether results are strong in context rather than only in isolation. Comparing against budget, peers, market references, or the investment case helps leaders judge if performance truly meets expectations.
Product Trial
FineReport
Pixel-perfect reports · Interactive dashboards · Easy data entry · Digital twins