Financial performance management is not just about producing monthly reports faster. For CFOs, it is the operating discipline that connects strategy, planning, execution, and review through trusted metrics and timely decision support. The practical challenge is familiar: finance teams produce board packs, management reports, budget updates, and forecast explanations, yet leaders still spend too much time asking what changed, why it changed, and who needs to act.
A strong financial performance management approach fixes that by combining a governed KPI framework with dashboards designed for decision-making. The next upgrade is AI. With FineBI + Dora, business users can ask for analysis in chat, generate chart-based answers or dashboard-style views from trusted BI assets, and receive scheduled summaries before the next meeting.
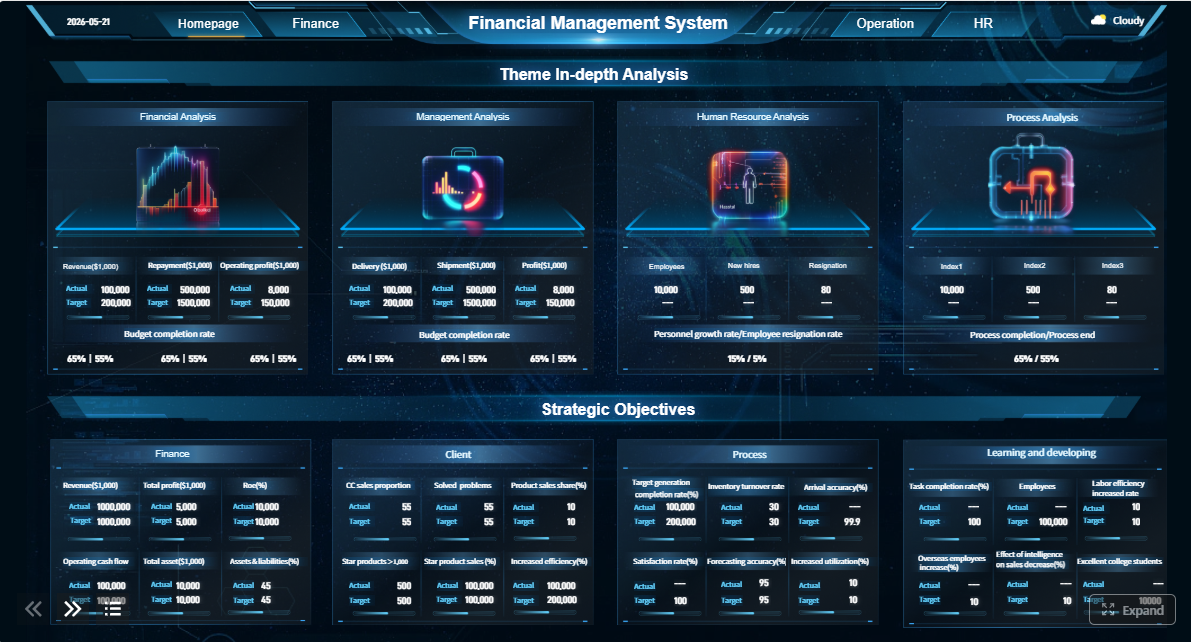 Click To Try The Dashboard
All dashboards in this article are built with FineBI
What financial performance management means for CFOs
Financial performance management is the structured process of monitoring, analyzing, and improving business performance through financial and operational metrics. In practical CFO terms, it means turning financial data into a management system for planning, control, and decision-making.
It supports three essential goals:
- Planning: align budgets, forecasts, and resource allocation with strategic priorities.
- Control: track results against plan, policy, and thresholds.
- Decision-making: identify where performance is improving, deteriorating, or deviating from expectations.
For CFOs, financial performance management should connect finance, operations, and executive reporting across the business. Revenue, margin, cash flow, cost discipline, customer performance, and working capital do not sit neatly inside one department. Finance may define the numbers, but operations, sales, procurement, and business unit leaders influence the outcomes every day.
That is why backward-looking reporting is not enough. Traditional finance reporting tells leaders what happened. A more mature financial performance management model helps them understand:
- what is changing
- what is driving the change
- what risk is emerging
- what action should follow
This is where BI and AI work together well. FineBI provides the governed dashboard, metric modeling, self-service analytics, and semantic foundation. Dora adds the enterprise Data Agent layer, so CFOs and finance leaders can move beyond opening reports manually and instead use an AI assistant for recurring review, summary, alerting, and follow-up.
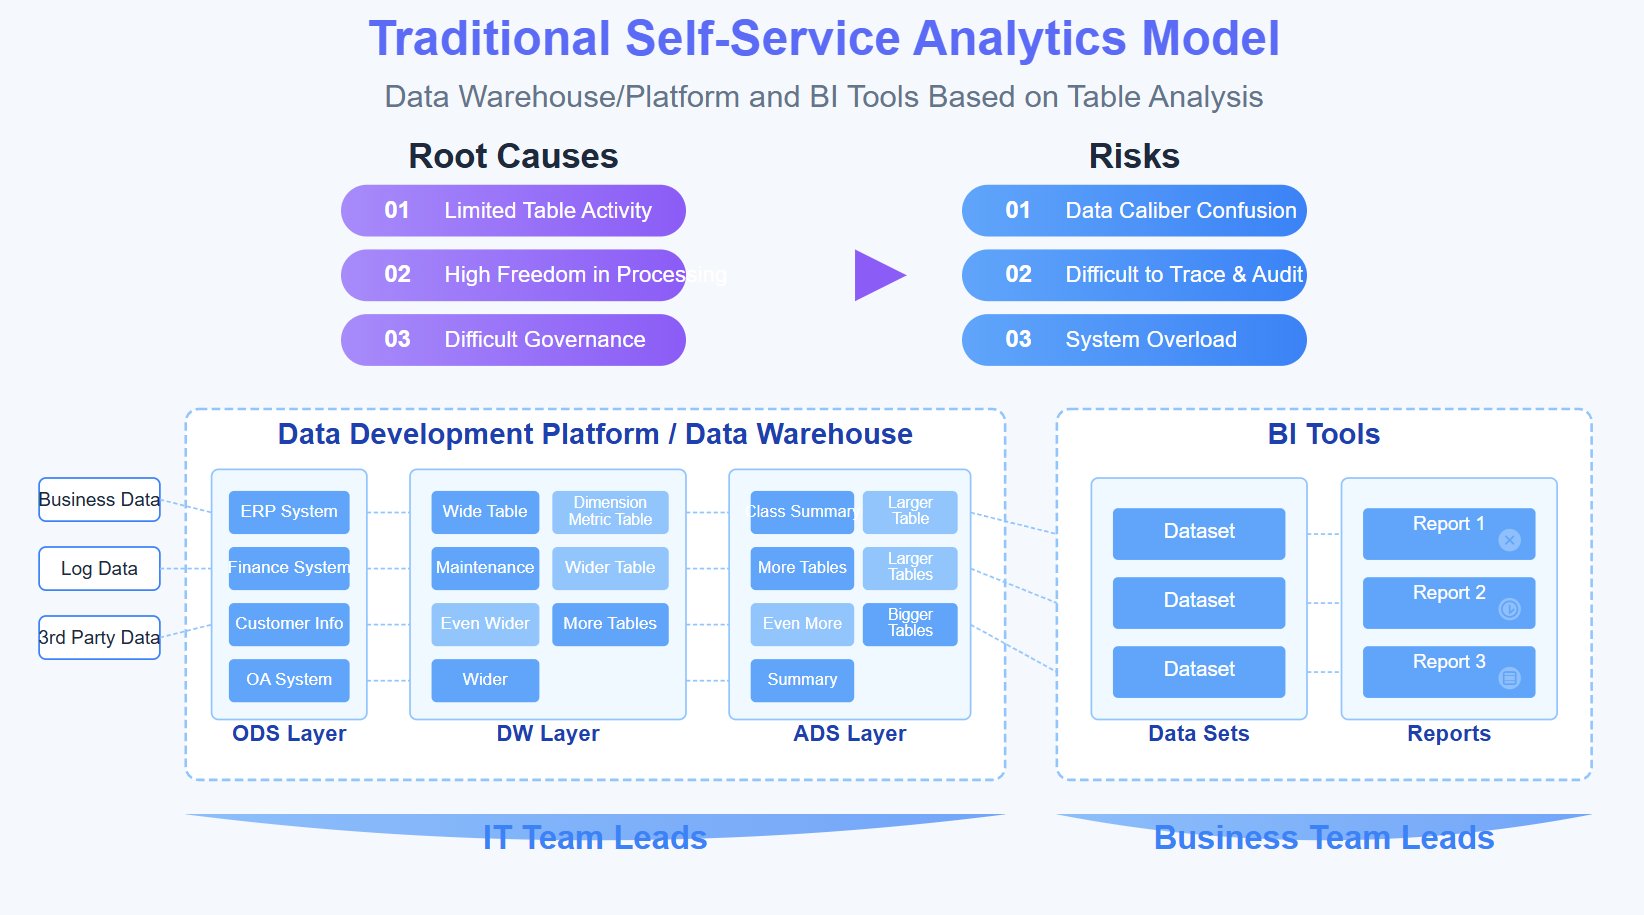
Build a KPI framework that links strategy to financial outcomes
A CFO-ready KPI framework should not start with a long list of available measures. It should start with strategy, then move to value drivers, then to measurable indicators with clear ownership.
Start with business objectives and value drivers
The first step is to identify the strategic outcomes the company is trying to achieve. Most CFOs will recognize a familiar set:
- growth
- profitability
- cash flow
- capital efficiency
- forecast reliability
- risk control
These objectives must then be translated into business drivers that operating teams can influence. For example:
- Growth may depend on pricing, sales volume, pipeline conversion, retention, and product mix.
- Profitability may depend on gross margin, discounting discipline, procurement cost, labor efficiency, and overhead control.
- Cash flow may depend on billing timeliness, collections, payables terms, inventory turns, and capital spending discipline.
- Capital efficiency may depend on asset utilization, return on invested capital, and working capital performance.
This step matters because strategy is too abstract for daily management. CFOs need a driver tree that links executive priorities to actions people can actually take.
Choose the right financial and operational KPIs
The best financial performance management frameworks combine lagging indicators that show outcomes and leading indicators that warn about what is coming next. They also prioritize measures that are actionable, comparable, and tied to accountability.
Below is a practical KPI structure for CFOs.
Revenue and growth KPIs
-
Revenue Growth: Percentage change in revenue over a selected period.
Business value: Shows whether the business is expanding in line with plan and market expectations.
AI use: Dora can retrieve this metric through chat, compare actuals versus plan or prior period, and include it in scheduled executive briefings. -
Revenue by Business Unit / Region / Product: Revenue segmented by responsibility or market dimension.
Business value: Helps CFOs see where growth is concentrated or underperforming.
AI use: Dora can generate a chart-based answer showing revenue concentration, declines, and major variance contributors. -
Average Selling Price or Mix Impact: Measures pricing and mix changes that affect top-line quality.
Business value: Distinguishes volume-driven growth from price-driven growth.
AI use: Dora can summarize whether revenue movement is mainly caused by volume, price, or product mix.
Profitability KPIs
-
Gross Margin: Revenue minus direct cost as a percentage of revenue.
Business value: Reveals core economic performance before overhead and financing effects.
AI use: Dora can surface margin declines, compare across segments, and highlight likely operational drivers. -
EBITDA: Earnings before interest, taxes, depreciation, and amortization.
Business value: Common management measure for operating profitability and performance comparison.
AI use: Dora can pull EBITDA trends from FineBI dashboards and summarize drivers behind plan variance. -
Operating Expense Ratio: Operating expenses as a share of revenue.
Business value: Shows cost discipline and scalability.
AI use: Dora can detect expense overrun patterns and push alerts to owners when thresholds are exceeded.
Cash flow and liquidity KPIs
-
Free Cash Flow: Cash generated after operating and capital expenditure requirements.
Business value: Indicates the company’s ability to fund growth, reduce debt, or return capital.
AI use: Dora can generate periodic summaries that connect profitability and working capital movement to cash outcomes. -
Working Capital: Current operating assets minus current operating liabilities.
Business value: Essential for liquidity management and capital efficiency.
AI use: Dora can track movement by AR, AP, and inventory components and explain what is driving changes. -
Days Sales Outstanding, Days Payable Outstanding, Inventory Days: Measures working capital cycle efficiency.
Business value: Improves cash discipline and exposes operational bottlenecks.
AI use: Dora can identify unusual movement, surface accountable owners, and push follow-up prompts before review meetings.
Planning and control KPIs
-
Forecast Accuracy: Degree to which forecast aligns with actual results.
Business value: Helps CFOs assess whether the organization can plan reliably.
AI use: Dora can compare current forecast error by entity, region, or cost center and summarize repeated bias patterns. -
Plan vs Actual Variance: Difference between budgeted and actual performance.
Business value: Core control measure for management review.
AI use: Dora can retrieve the relevant dashboard and create a dashboard-style analysis view showing major favorable and unfavorable variances. -
Close Cycle or Reporting Timeliness: Time required to close and publish management results.
Business value: Determines how quickly finance can support decisions.
AI use: Dora can include process performance indicators in periodic finance operations briefings.
Customer and operating driver KPIs
-
Customer Retention / Churn: Share of retained or lost customers over time.
Business value: Strong leading signal for future revenue stability.
AI use: Dora can connect customer movement to revenue risk summaries for CFO review. -
Order Backlog or Pipeline Coverage: Value of future revenue under contract or in pipeline.
Business value: Useful for forward-looking performance management.
AI use: Dora can answer natural-language queries about pipeline coverage versus plan. -
Production or Service Efficiency Metrics: Such as yield, utilization, or delivery performance.
Business value: Operational issues often show up later in financials; leading indicators help CFOs act earlier.
AI use: Dora can include these non-financial drivers in executive summaries so finance conversations stay connected to operations.
Set ownership, targets, and review cadence
A KPI framework only works when every critical measure has a clear owner, threshold, and review rhythm.
CFOs should define:
- Metric owner: who is accountable for explaining and improving the KPI
- Definition: what the KPI means and how it is calculated
- Target threshold: expected range, warning level, and escalation level
- Review cadence: weekly, monthly, quarterly, or event-driven
- Action path: what happens when the metric misses target
For example, gross margin may be reviewed weekly in commercial businesses and monthly at board level. Working capital risks may need daily or weekly monitoring. Forecast accuracy may be reviewed after every planning cycle and monthly in management meetings.
Dora becomes more useful when this governance is explicit. A governed AI workflow needs metric rules, semantic definitions, threshold logic, and responsibility mapping. Without that foundation, AI outputs may be fast but not enterprise-ready.
Design dashboards that support faster and better decisions
Once the KPI framework is defined, the next job is dashboard design. The goal is not to put every financial measure on one screen. The goal is to make decisions faster with less friction.
Structure dashboards for executive and functional audiences
CFOs typically need multiple dashboard layers:
- Board-level summary dashboard: a concise view of revenue, profitability, cash, working capital, and strategic exceptions
- Executive management dashboard: includes more variance analysis, business unit comparisons, and risk indicators
- Functional dashboards: deeper views for FP&A, controllership, treasury, sales finance, operations finance, or business unit leaders
Each dashboard should reflect the decisions the audience needs to make.
A board dashboard may focus on:
- total revenue versus plan
- EBITDA trend
- free cash flow
- major risks and outlook changes
A management dashboard may go deeper into:
- margin bridge
- expense variance by function
- working capital by business unit
- forecast change drivers
- exception ownership
A team-level dashboard may show operational and financial drivers together so managers can move from symptom to cause.
Make trends, variance, and root causes easy to see
Good financial performance management dashboards do three things clearly:
- Show the trend
- Show the variance
- Show the likely drivers
That means using:
- period-over-period trend lines
- plan-versus-actual views
- rolling forecast comparison
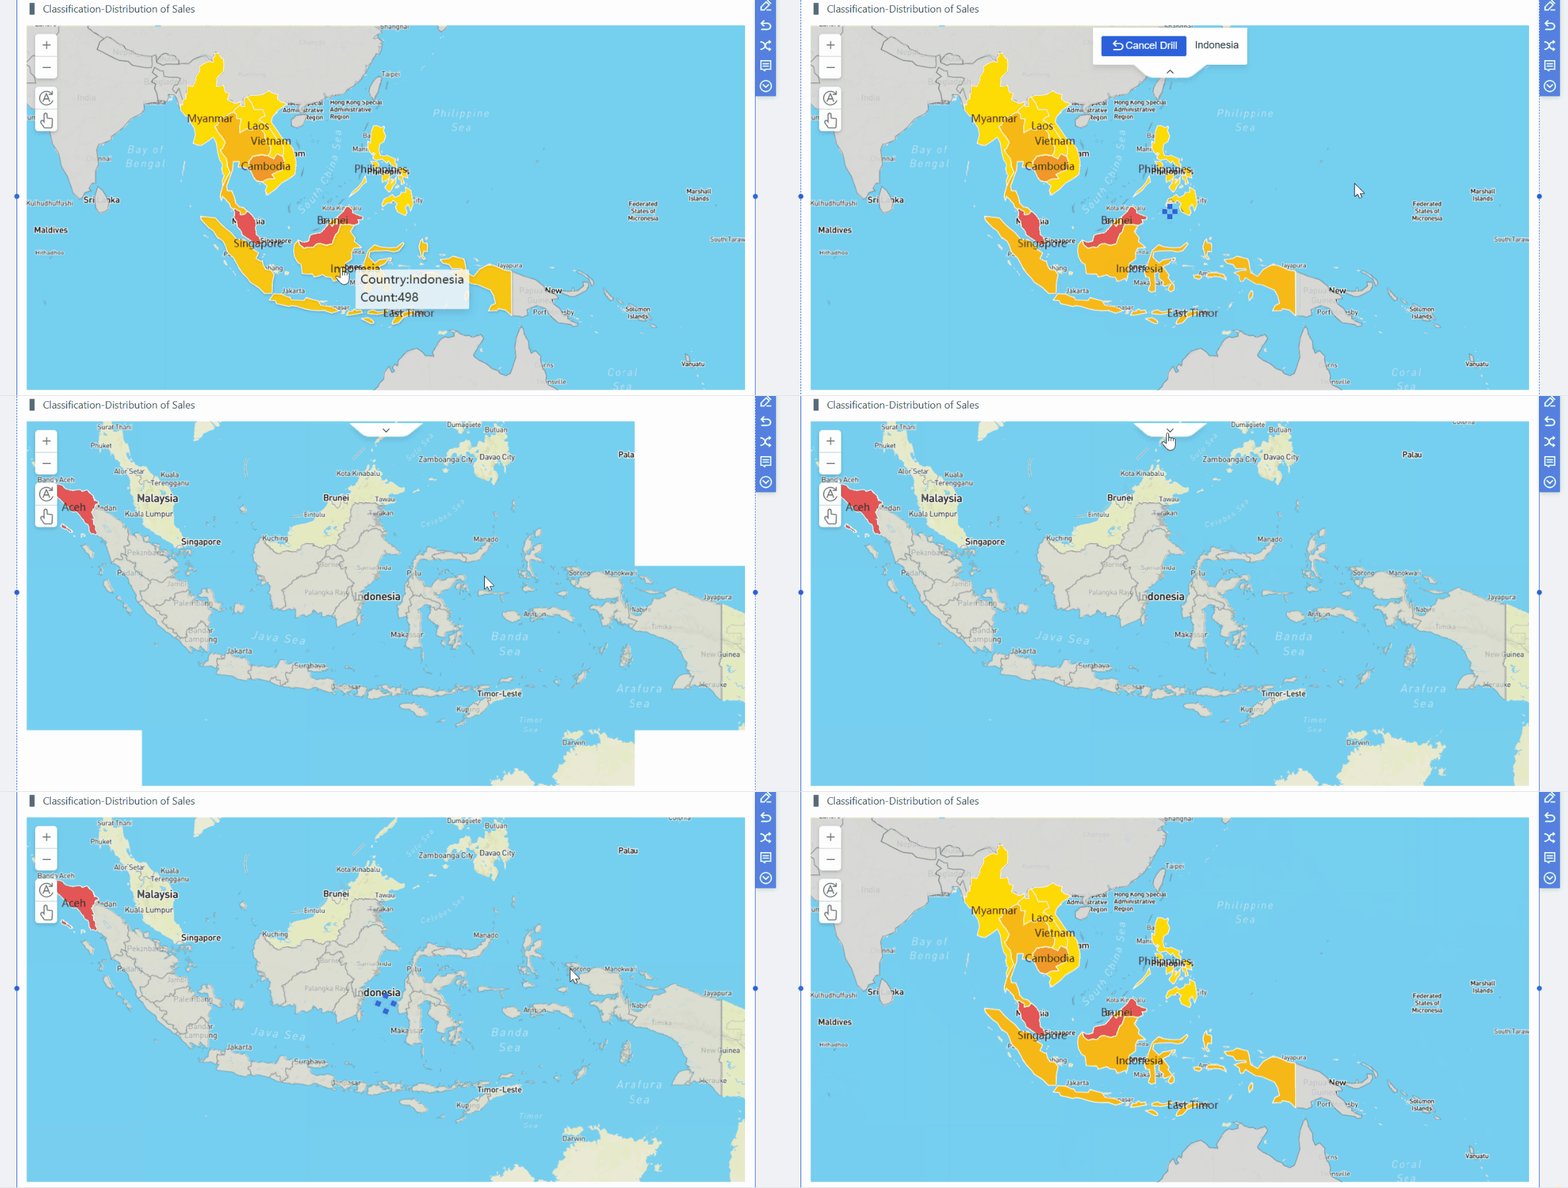
- drill-down by entity, region, department, product, or customer segment
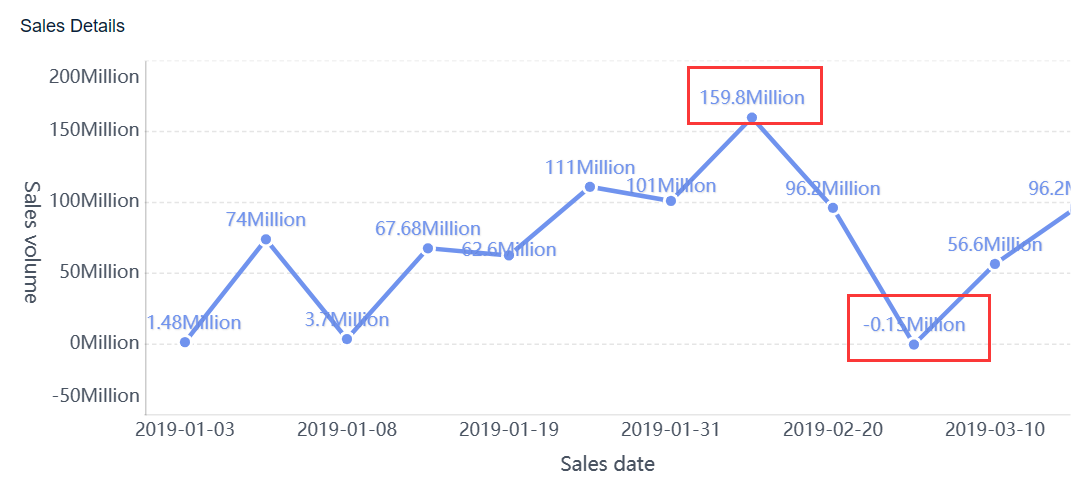
- anomaly markers and exception highlighting
- variance bridges where useful
CFOs do not need more numbers in meetings. They need faster pattern recognition. A dashboard should help answer:
- Which metrics are moving materially?
- Is the movement temporary or persistent?
- Which dimension is driving the change?
- Which owner needs to respond?
FineBI is well suited here because it supports trusted dashboards, metric modeling, visual exploration, and reusable semantic assets. That means finance leaders can start from a board summary and move down into a governed analysis path instead of relying on disconnected spreadsheets and one-off explanations.
Improve trust through data quality and governance
A dashboard is only useful if people trust it. In finance, trust comes from consistency, auditability, and clear ownership.
To improve trust, CFOs should standardize:
- KPI definitions
- source systems
- dimension hierarchies
- data refresh schedules
- plan and forecast versions
- access permissions
- exception handling logic
FineBI helps organizations establish this trusted BI foundation. Metrics, dashboards, and semantic assets can be governed centrally while still supporting self-service analysis. That matters even more when adding AI, because Dora should answer from governed assets, not from uncontrolled data fragments or inconsistent definitions.
Add an AI briefing assistant to turn data into executive insight
Many finance teams already have dashboards. The next bottleneck is not chart creation but management attention. Executives do not always have time to open every dashboard, compare every period, and write every summary manually. This is where an AI assistant becomes valuable.
Automate narrative summaries for KPI reviews
Finance leaders spend significant effort preparing weekly and monthly performance briefings. Much of this work is repeatable:
- collect the latest KPI values
- compare against plan and prior period
- highlight major movements
- summarize risks
- prepare talking points for leadership review
Dora can support this as a Daily Briefing Secretary or Report Researcher digital employee. Instead of making executives search through dashboards, Dora can retrieve governed FineBI assets and generate concise plain-language summaries around:
- revenue changes
- gross margin movement
- operating cost variance
- free cash flow trends
- working capital pressure
- forecast risk
This is not about replacing finance judgment. It is about reducing repetitive preparation work and improving timeliness.
Use AI to surface risks, patterns, and next actions
The value of AI in financial performance management is not limited to summarization. A governed enterprise Data Agent can help CFOs move from passive review to active monitoring.
For example, Dora can help:
- flag unusual changes in margin, expense, or cash performance
- identify trend breaks that deserve attention
- compare KPI behavior against thresholds or business rules
- suggest follow-up questions for the CFO or FP&A team
- push scheduled summaries before operating reviews
- notify responsible users when exceptions require action
This is especially useful for recurring finance scenarios such as:
- weekly executive performance briefings
- monthly management pack preparation
- working capital risk review
- budget variance follow-up
- forecast risk escalation
Because Dora works on top of trusted BI assets and governed Skills, it is better suited for enterprise landing than a feature-only AI demo. The goal is not a generic chat experience. The goal is a controllable, auditable AI workflow that fits finance operations.
Put guardrails around accuracy, security, and oversight
CFOs should adopt AI with discipline. Material decisions and external reporting still require human oversight. An AI briefing assistant is most effective when it operates inside governance boundaries.
Key guardrails include:
- human review for board materials and external reporting
- permission-based access to financial data
- governed KPI definitions and business terms
- clear approval workflows for distributed summaries
- auditability of data sources and logic paths
- staged rollout of agent Skills for high-value use cases first
This is also why FineBI + Dora makes sense together. FineBI provides the trusted dashboard and semantic layer. Dora provides the AI assistant layer for chat, summaries, pushes, alerts, and follow-up, while respecting governed access and definitions.
How an AI Data Agent Handles This Scenario
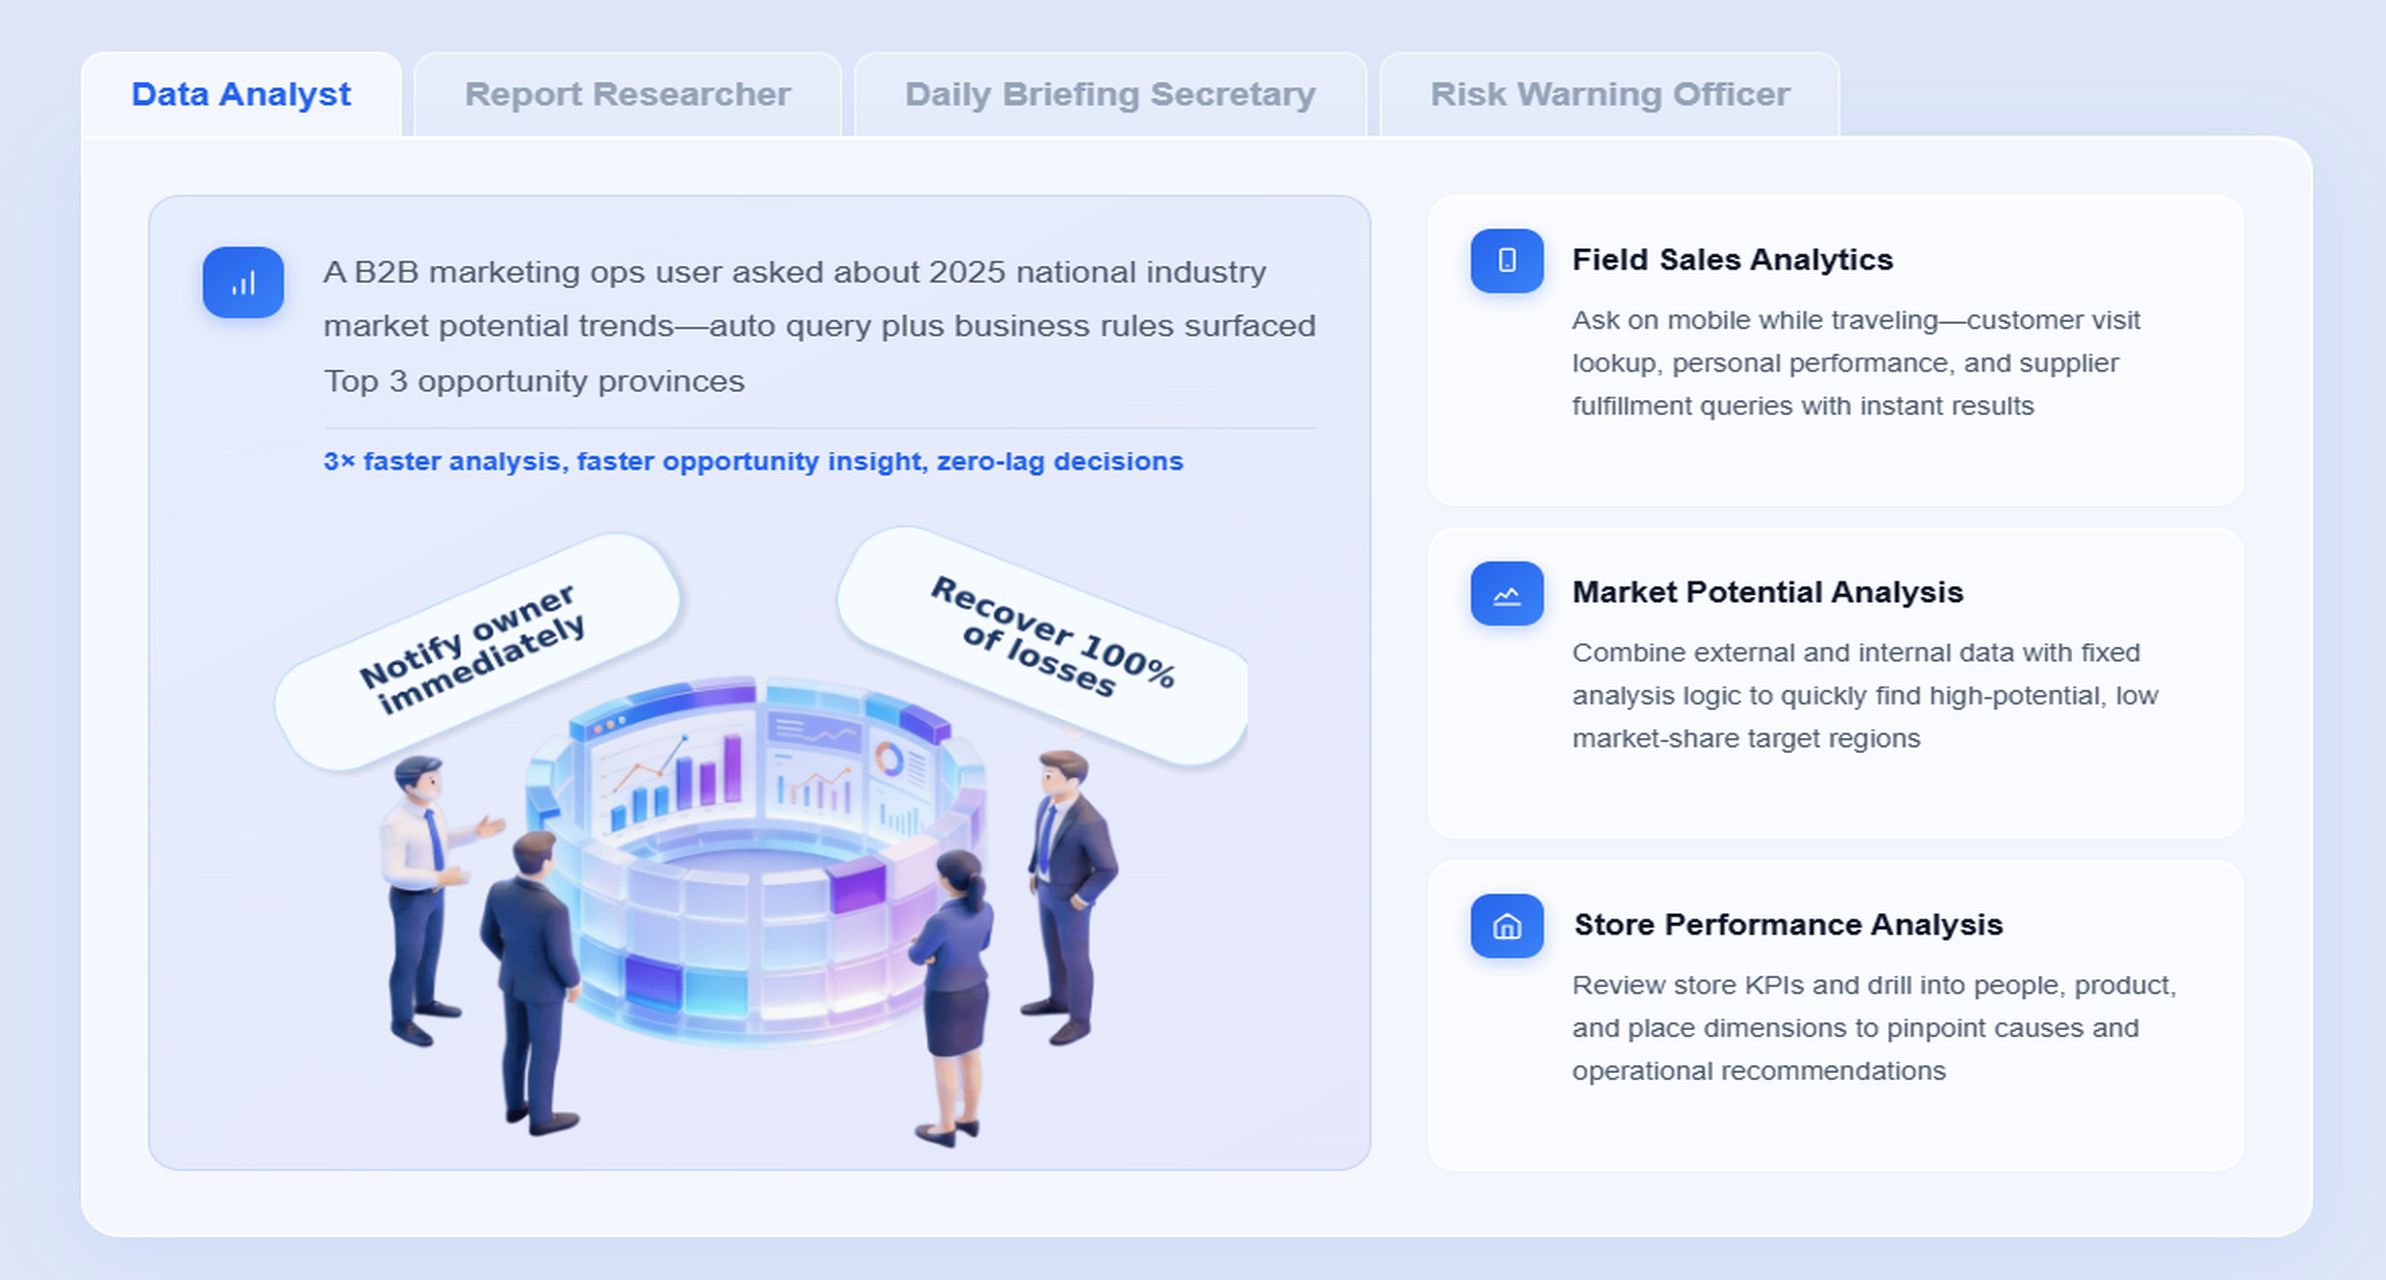
For CFOs, the most relevant Dora digital employee in this scenario is the Daily Briefing Secretary, often supported by Data Analyst and Risk Alert Officer capabilities.
A common finance request might sound like this:
“Prepare this week’s financial performance management briefing. Show revenue, gross margin, EBITDA, free cash flow, working capital, and forecast variance by business unit. Highlight exceptions versus plan, explain likely drivers, and list the items I should raise in tomorrow’s executive review.”
Here is how a governed Dora workflow can handle that request:
-
Retrieve trusted FineBI dashboard or analysis-subject data.
Dora pulls the relevant executive finance dashboard, KPI subject areas, and approved management views from FineBI. -
Understand KPI definitions, filters, business terms, and semantic rules.
Dora uses the trusted semantic layer to interpret terms like EBITDA, free cash flow, plan variance, forecast version, and business unit correctly. -
Generate chart-based answers and dashboard-style analysis views through chat.
The CFO receives a concise answer with key KPI summaries, a supporting chart or table, and drill paths to the underlying FineBI views. -
Detect anomalies and threshold breaches.
If margin drops below a defined threshold or working capital deteriorates sharply, Dora flags the exception and includes it in the response. -
Push insights, alerts, or suggested actions to responsible users.
Dora can notify FP&A, business finance, or operational owners that a KPI has breached a rule and ask for follow-up commentary or action. -
Produce follow-up summaries for meetings or management review.
Dora turns the same governed output into a scheduled executive briefing, a pre-meeting summary, or a post-meeting recap.
This is where fourth-generation Agentic BI becomes practical. The workflow is not just natural-language query. It combines:
- natural-language request
- trusted semantic layer
- governed query or Skill execution
- answer, chart, summary, action, and follow-up
That sequence matters for finance. CFOs do not need an AI tool that simply sounds fluent. They need an enterprise Data Agent that can operate on governed metrics, respect permissions, reduce token waste, improve workflow stability, and support repeatable finance processes.
In this model, FineBI remains the BI foundation:
- dashboards
- metric modeling
- semantic assets
- trusted data exploration
- governed permissions
Dora adds the AI assistant layer:
- chat-based analysis requests
- dashboard and metric retrieval
- chart-based answers
- scheduled weekly or monthly briefings
- anomaly alerts
- owner follow-up
- meeting preparation support
For executives, this makes AI concrete. Dora is not an AI experiment. It is a landed AI digital employee for recurring data work such as monthly financial briefing, variance review preparation, working capital follow-up, and forecast risk escalation.
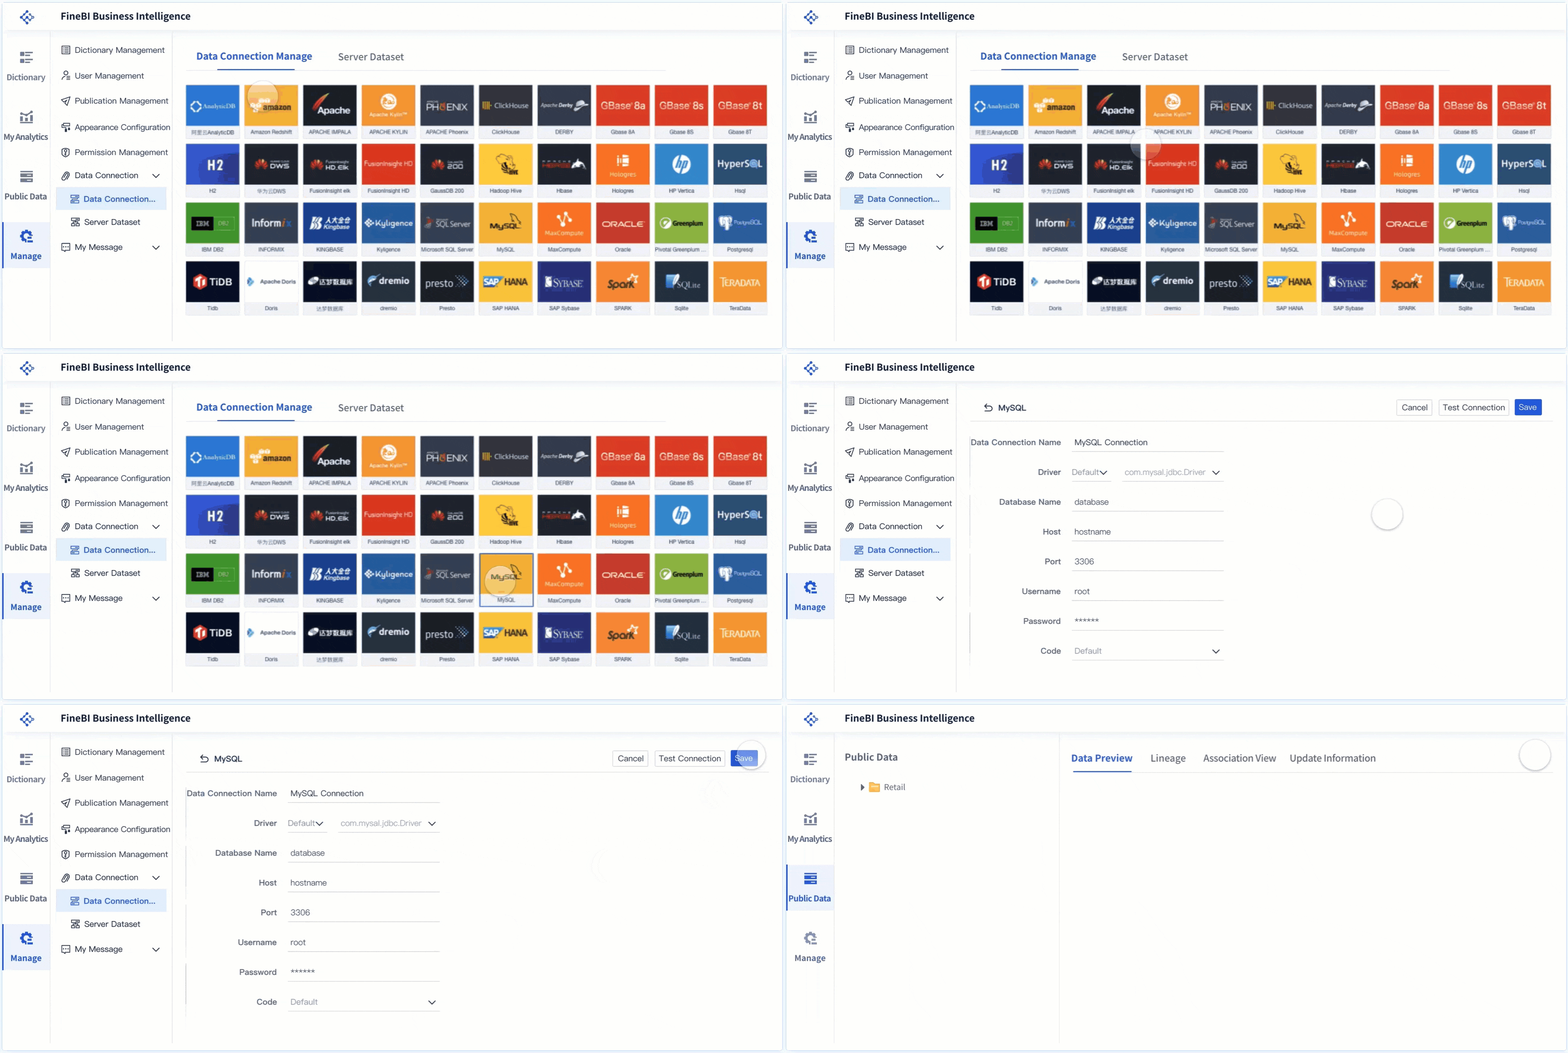
For IT and data teams, the role also becomes clearer. They do not have to manually build every response. Instead, they optimize data connections, semantic rules, permissions, data quality, and reusable agent Skills so AI can operate safely at scale.
For finance users, the benefit is lower operating friction. They can get timely metrics, chat-based answers, scheduled summaries, and exception pushes without waiting for analysts to rebuild the same report every cycle.
Implement a financial performance management operating model that scales
A financial performance management system becomes sustainable when it is embedded into people, process, and technology, not treated as a reporting side project.
Roll out in phases across people, process, and technology
Most CFOs should start with a phased rollout instead of trying to redesign every finance workflow at once.
A practical sequence is:
- define priority strategic outcomes
- choose a focused KPI set
- build one executive dashboard and one management dashboard
- validate definitions, owners, and data quality
- add Dora for one recurring briefing or risk monitoring scenario
- expand to additional processes and business units
This phased model works because it aligns with how finance actually operates. Planning, forecasting, close, and management review are interconnected. A scalable operating model should support those cycles consistently, not create separate reporting islands.
Examples of strong first use cases include:
- monthly CFO performance briefing
- weekly revenue and margin update
- working capital exception monitoring
- forecast variance review pack
Track adoption and continuous improvement
CFOs should not measure success only by dashboard delivery. They should also measure whether the framework is being used in real decisions.
Good adoption indicators include:
- executive meeting usage of dashboards
- frequency of KPI review by owners
- reduction in manual report preparation effort
- improvement in timeliness of briefing distribution
- follow-up actions created from exception reviews
- usage of Dora summaries, alerts, and chat-based analysis
Over time, organizations should refine:
- KPI definitions
- thresholds
- variance commentary formats
- AI Skills and approval flows
- dashboard structure by audience
Financial performance management should be reviewed regularly to remain relevant. A framework that worked during a growth phase may need a different emphasis during a margin recovery or cash preservation phase.
Common questions and mistakes to avoid
What makes a strong framework effective in practice?
An effective financial performance management framework has a few clear characteristics:
- metrics are tied to strategy and value drivers
- each KPI has a clear definition and owner
- dashboards are designed for decisions, not data dumping
- reviews happen on a disciplined cadence
- exceptions trigger follow-up, not just discussion
- data governance supports trust in the numbers
- AI outputs are grounded in governed BI assets
In practice, the strongest frameworks are simple enough to use regularly but rich enough to explain what is happening in the business.
Which pitfalls reduce impact?
Several common mistakes reduce the value of financial performance management:
- Too many metrics: leaders lose focus and cannot distinguish signal from noise.
- Poor data quality: even attractive dashboards fail if numbers are not trusted.
- Unclear ownership: everyone sees the KPI, but no one feels responsible for improving it.
- Disconnected systems: finance and operations work from different versions of the truth.
- Weak review discipline: meetings review numbers without clear decisions or follow-up.
- AI without governance: summaries may be fast, but not reliable enough for finance use.
- Trying to automate everything at once: this often creates complexity instead of adoption.
How should CFOs get started?
A practical first-step checklist looks like this:
- Clarify the top 3-5 business objectives for the next planning horizon.
- Define the value drivers behind those objectives.
- Select a focused KPI set with both leading and lagging indicators.
- Assign metric ownership, thresholds, and review cadence.
- Build one executive dashboard and one management dashboard in FineBI.
- Standardize KPI definitions, filters, and data refresh rules.
- Pilot Dora for a recurring finance scenario such as monthly executive briefing or working capital alerting.
- Keep human review in place for material decisions and expand gradually.
Actionable Best Practices
Here are practical ways to make financial performance management work in a real enterprise.
-
Standardize KPI definitions, synonyms, filters, and metric ownership.
This is essential for both dashboard trust and AI interpretation. If revenue, contribution margin, or forecast version mean different things across teams, neither dashboards nor AI briefings will scale well. -
Build a semantic layer inside the BI workflow.
FineBI should be used to create governed metrics, dimensions, hierarchies, and reusable analysis assets. This becomes the trusted foundation Dora uses for natural-language query and governed AI workflow execution. -
Start with high-value recurring workflows instead of automating everything.
Good first AI use cases include monthly CFO briefings, variance summaries, working capital risk alerts, or forecast commentary preparation. These processes are frequent, structured, and visible enough to deliver real value. -
Define alert thresholds, responsibility rules, and escalation paths.
Dora is much more effective when exceptions have clear business rules. For example, a margin drop above a threshold should trigger notification to the relevant finance partner and business owner with a required follow-up timeline. -
Preserve permission governance and human review.
AI outputs should respect FineBI access boundaries. Use human review for AI-generated finance summaries at first, then gradually expand Dora Skills as confidence, data quality, and governance mature.
FineBI + Dora Solution Pitch
Building this manually is complex. FineBI helps teams build trusted dashboards, metrics, and semantic assets. Dora turns those assets into an AI assistant that can answer questions in chat, generate dashboard-style analysis views, push scheduled summaries, monitor anomalies, and follow up with responsible owners.
For CFOs, this matters because financial performance management requires more than reporting visuals. It requires governed metrics, executive-ready insight, repeatable review workflows, and timely coordination across finance and business teams.
FineBI + Dora is not only a BI upgrade; it is a practical fourth-generation Agentic BI path. FineBI provides governed metrics and visual analysis. Dora provides the AI assistant layer for scenario execution, with more controlled Skills, lower token waste, faster execution paths, and more stable workflows than prompt-only agents.
This combination supports a realistic enterprise model:
- FineBI builds the trusted BI foundation with dashboards, self-service analytics, metric modeling, and semantic assets.
- Dora acts as the enterprise Data Agent layer on top of those assets, helping users ask, analyze, generate, push, alert, and follow up.
- Services and implementation connect the last mile: data integration, KPI governance, semantic setup, Skills design, workflow rollout, and adoption.

Get Ready-to-Use Dashboard Templates in Fine Gallery
The strongest Dora pitch is scenario + product + service: FineBI provides the trusted BI foundation, Dora provides the AI digital employee, and implementation service connects data, governance, semantic setup, Skills, and rollout.
If your finance team wants to move from static reporting to governed, scalable financial performance management, FineBI + Dora offers a practical path: trusted dashboards for finance, plus an AI briefing assistant that helps leaders ask better questions, receive timely summaries, and act faster on risk and performance signals.
FAQs
Financial performance management is the process of tracking, analyzing, and improving financial results using trusted metrics, planning inputs, and decision-ready reporting. For CFOs, it connects strategy, budgets, forecasts, and operational performance so leaders can act faster.