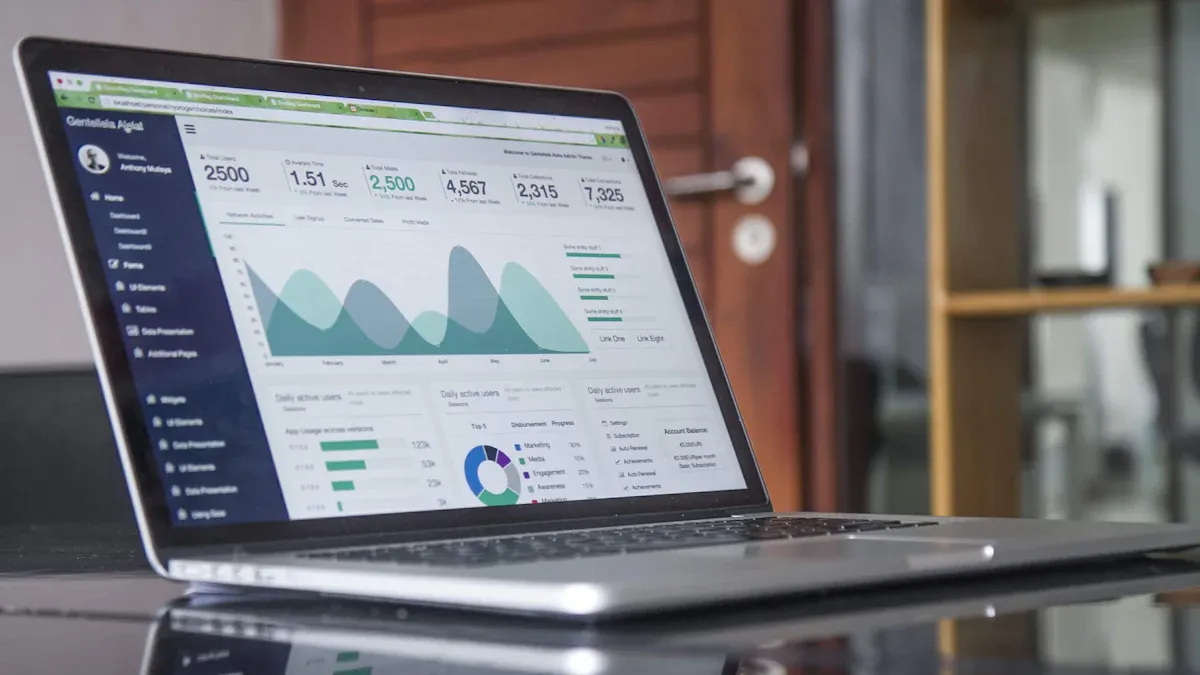
A Pipedrive Dashboard shows you your sales pipeline and important numbers. You can see data as it happens. This helps you make good choices and notice trends quickly. Dashboards let you see your business like a pilot sees the cockpit. All the important details are right in front of you. Many companies grow sales faster and get more customers by using dashboards to make numbers simple. FineReport is a top tool for making strong dashboards that help you get these results.
What Is a Pipedrive Dashboard
Core Purpose and Benefits
A pipedrive dashboard helps you see your sales steps. You can look at each part, from new leads to deals that are finished. This dashboard lets you watch important numbers and notice changes right away. You do not have to look through many screens or reports. Everything you need is in one spot.
You can use a pipedrive dashboard to check how your team is doing. It shows how many deals move in each step. You can match your results with your goals. This helps you make smart choices and change your plan fast. Many teams use dashboards to get better at sales and reach their goals quicker.
Here is a table that lists the main benefits you get from a pipedrive dashboard:
Benefit
Description
Revenue trend monitoring and forecasting
Watch closed deal money over time to find growth and changes.
Lost opportunity analysis and learning
See why deals are lost and use this to make your plan better.
Sales funnel effectiveness evaluation
Check your pipeline to find slow spots and help more deals close.
Individual and team performance benchmarking
Compare how each team member does, like deal speed and pipeline growth.
Activity-to-outcome correlation analysis
Connect sales actions to results to see what helps close more deals.
Key Features Overview
A pipedrive dashboard gives you many tools to help with sales. You can see pipeline size and value as time goes on. You can check win and loss rates by step, product, or team member. The dashboard shows sales speed and how long deals stay in each step. You can compare guessed revenue with real results.
You can look at numbers by team, deal step, or time.
The dashboard helps you see changes and compare results.
Automatic data sharing helps your team work better.
You can track close rates, sales time, and deal success rates.
Real-time tracking keeps you updated and helps you stay on track.
A pipedrive dashboard makes it simple to check your sales numbers and see what works best. You can use this tool to get better results and make smarter choices every day.
How Pipedrive Dashboard Works
Real-Time Data Visualization
You want to see your sales numbers right away. A pipedrive dashboard lets you do this. You do not need to wait for reports. You do not need to search through emails. You get updates on your screen as things happen. This helps you notice trends and track progress fast. You can react quickly when things change.
With pipedrive, you can see many kinds of data live. Here are some examples:
You can show these numbers on TV screens or computers. When you see team goals and results live, you feel more excited. Your team can make choices fast. You can spot problems before they get big. This keeps your sales process smooth and easy.
Tip: Use an insights dashboard to show your top numbers. This helps you focus on what matters most every day.
Leaders use pipedrive dashboards to watch team talks and customer actions. You can change your marketing plans and help your team better. Seeing your deal pipeline clearly helps you find the best chances. You can guide your team to close more deals and reach your goals.
CRM Integration and Data Sources
A pipedrive dashboard works best when it connects to all your tools. Pipedrive lets you bring data from many places into one dashboard. You can connect your CRM, email, marketing, and finance tools. This gives you a full view of your business.
Pipedrive supports many connections:
Popular CRMs like HubSpot and Salesforce
Email marketing tools such as Mailchimp and Klaviyo
You can use the open API to build custom links. Pipedrive’s Marketplace has over 400 connections. You can pick the apps that fit your work style. This makes your dashboard flexible and strong.
When you connect your CRM, you get a true customer management experience. You can see all your sales data, customer talks, and team actions in one place. This helps you make better choices and find new ways to grow.
Note: Advanced tools like FineReport let you connect to more places. You can link to many databases, files, and cloud services. FineReport lets you build dashboards that mix data from different sources. You can make custom views for sales, marketing, and operations. This gives you deeper insights and helps you run your business with confidence.
An insights dashboard helps you track key numbers across your company. You can watch sales, customer support, and marketing live. You can share dashboards with your team to keep everyone together. This boosts teamwork and helps you reach your goals faster.
A pipedrive dashboard, when connected to the right data, becomes your control center. You can see what is happening now and plan your next move with clear, fresh information.
Dashboard vs. Report in Pipedrive
Main Differences
You might wonder how a pipedrive dashboard is not the same as a pipedrive report. Both tools help you learn about your business, but they do different things. A dashboard gives you a fast look at your most important numbers. A report lets you look closer at the details.
Here is a table that shows how a pipedrive dashboard and a pipedrive report are different:
Feature
Pipedrive Dashboard
Pipedrive Report
Definition
A collection of reports
A visual representation of performance metrics
Purpose
To track overall progress and performance
To analyze specific performance metrics
Types
Various dashboards can be created
Different types based on data entities: Activity, Deals, Forecast
A pipedrive dashboard helps you see your sales pipeline and team progress quickly. You can check daily goals and notice trends fast. A pipedrive report gives you more ways to pick what you want to see. You can change it to focus on certain sales numbers or team actions.
There are also differences in how each tool shows your data. A pipedrive report lets you change almost everything. You can watch key performance indicators and use many kinds of graphs. A pipedrive dashboard gives you updates right away. You see the newest numbers as soon as they happen. This helps you act fast.
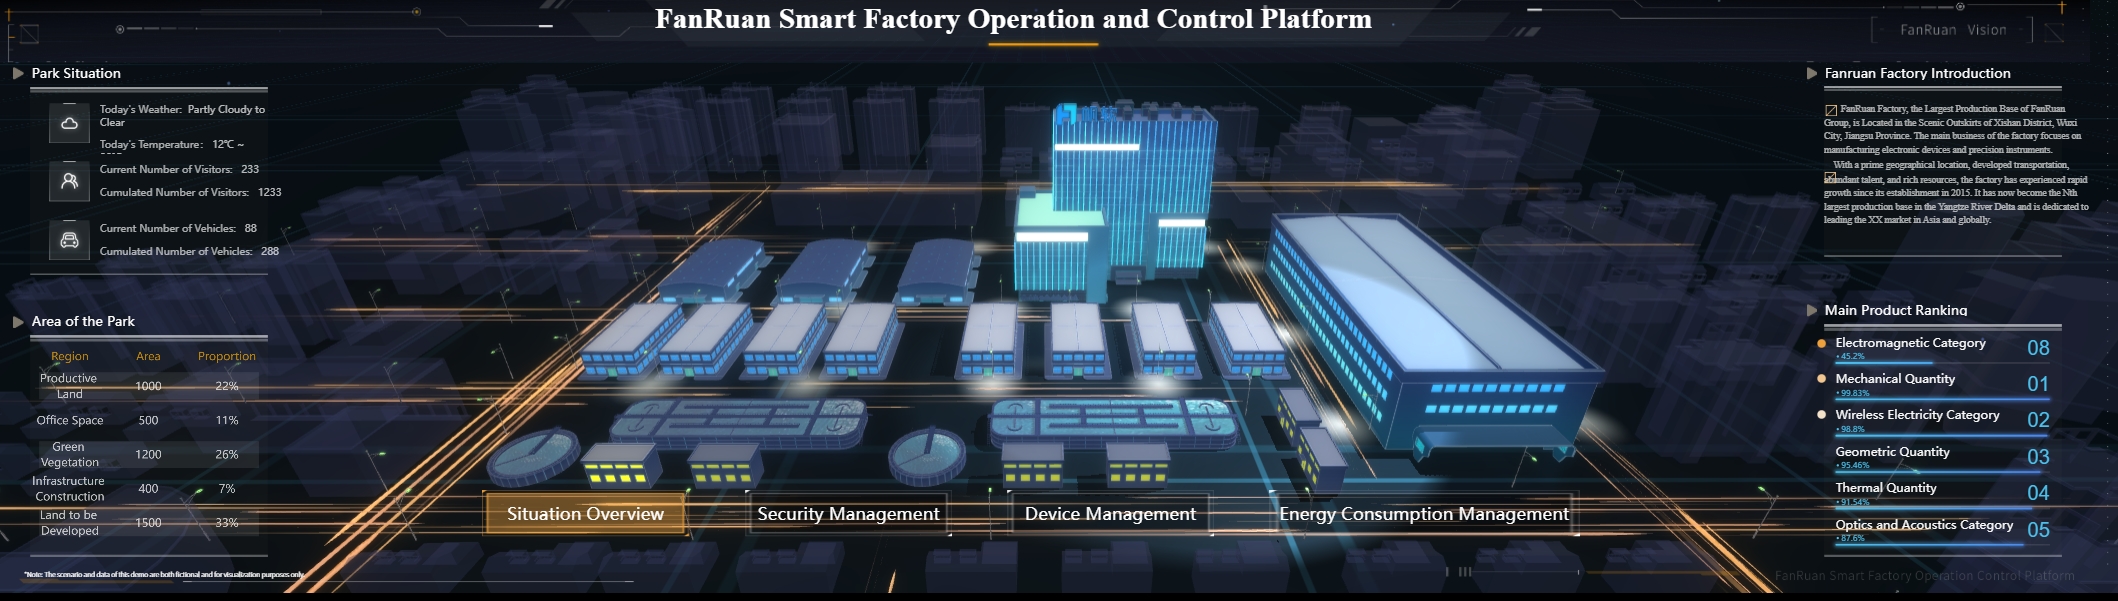
You should use a pipedrive dashboard when you want to see sales numbers as they happen. Dashboards are good for checking things every day. You can watch website analytics, IT system health, and customer support numbers. If you work in manufacturing, dashboards help you see production numbers and make changes fast. Marketing teams use dashboards to see campaign results right away.
Smart factory dashboard created by FineReport(click to engage)
A pipedrive report is better when you need to study details. You can use reports to look at sales trends, compare team results, or check how a project went. Reports help you answer special questions. You can share a pipedrive report with your team to show results or plan what to do next.
Tip: Use a pipedrive dashboard for quick checks and a pipedrive report for deep dives. This way, you get the best of both tools.
You can use both dashboards and reports in pipedrive to handle your sales process. Each tool helps you see your numbers in its own way. You will make better choices when you know when to use each one.
Create and Customize a Pipedrive Dashboard
Step-by-Step Creation Guide
You can build your own pipedrive dashboard in a few easy steps. Start by thinking about what you want to see. Do you want to track new leads, watch deals move through the pipeline, or check team sales numbers? Clear goals help you get the most from your dashboard.
Define your objectives. Decide which sales or leads numbers matter most.
Choose your dashboard platform. Pipedrive gives you built-in options, but you can also use tools like FineReport for more advanced needs.
Gather your data. Make sure your leads, deals, and sales numbers are up to date and accurate.
Design your dashboard. Pick a layout that makes it easy to spot trends and track progress.
Review and test. Check your dashboard to make sure it shows the right data. Ask your team for feedback before you start using it every day.
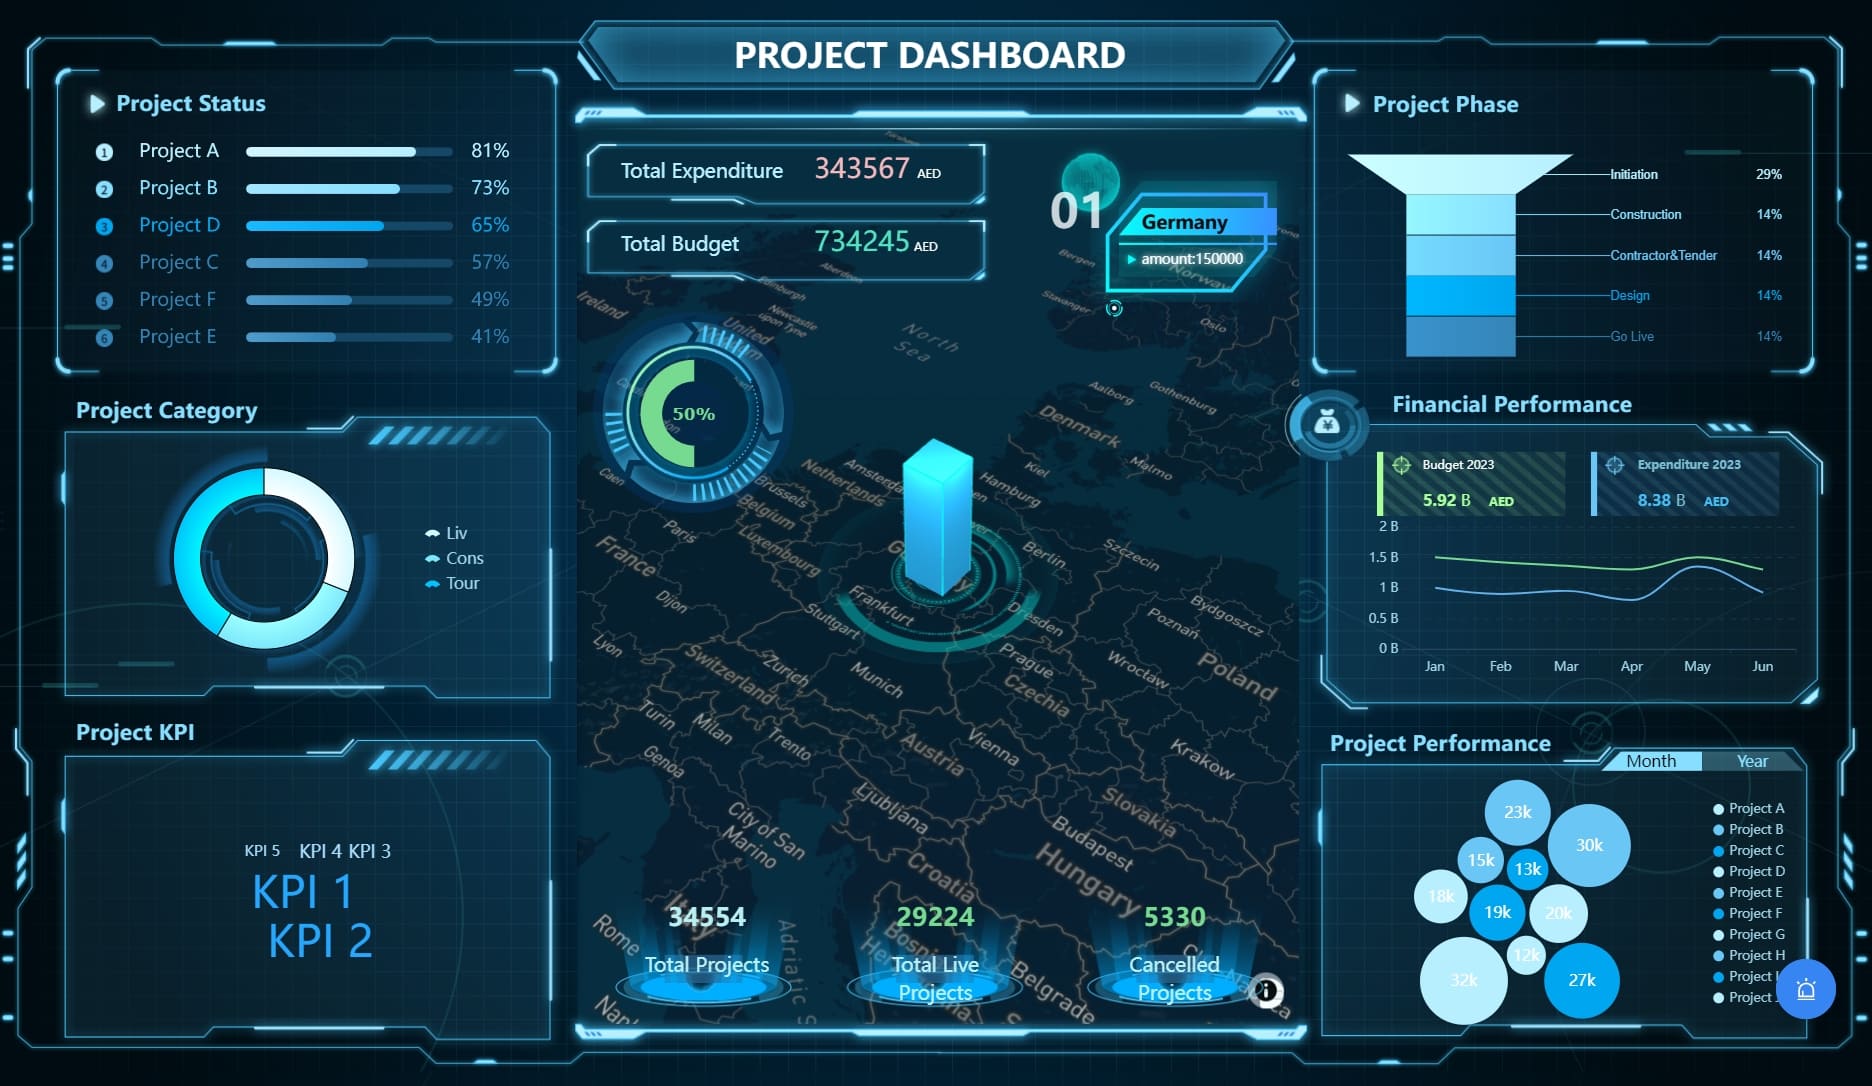
You can create dashboards for different needs. For example, you might build a sales KPI dashboard to track closed deals, or a customer acquisition dashboard to follow new leads. FineReport lets you do the same, with even more ways to connect data and customize your view.
Project dashboard created by FineReport(click to engage)
You can make your pipedrive dashboard fit your workflow. Rename your dashboard to match your project. Move widgets around by dragging and dropping them. Hide widgets you do not need. If you use a higher plan, you can create more dashboards for different teams or goals.
Here are some widgets you can add:
Widget Type
What It Does
Why Use It?
Sales Pipeline Monitoring
Shows real-time sales and deals progress
Spot slow spots and improve forecasting
Customizable Dashboards
Lets you tailor dashboards to your sales process
Focus on what matters for your team
AI-Powered Sales Tools
Helps close deals faster and find new leads
Boosts your results with smart suggestions
Global Sales Performance
Tracks leads and deals across different countries
Supports teams working worldwide
You can use these widgets to track leads, watch deals, and see how your sales team is doing. FineReport also gives you many chart types and layouts, so you can build dashboards that match your business.
Tip: Try different widget layouts to see which one helps you spot trends in your leads and deals fastest.
Sharing and Collaboration
Sharing your pipedrive dashboard helps your team stay on the same page. You can let others view your dashboard, or give them editing rights if they need to change layouts or add new widgets. Share dashboards with your team, or send a public link to people outside your company. You can also export dashboards as PDF or PNG files for meetings.
Action
Viewer
Editor
View dashboards and reports
✅
✅
Apply quick filters
✅
✅
Edit layout and widgets
❌
✅
Add or remove reports
❌
✅
Share dashboards
❌
✅
When everyone sees the same dashboard, you can track leads, deals, and sales together. This makes it easier to spot problems and celebrate wins. FineReport supports sharing and collaboration too, so your whole team can work with the same data and insights.
Business Value and Use Cases of Pipedrive Dashboard
Sales Performance Tracking
You want to see how your team does each day. A pipedrive dashboard shows your sales numbers and team work. You can check important numbers as they happen. This helps you know what works and what needs fixing. When you use pipedrive, you get a crm dashboard with your pipeline, money earned, and customer info in one spot.
Here is a table that shows how pipedrive dashboards help you track sales performance:
Metric Type
How It Helps You Track Sales Performance
Customizable dashboards
You see the sales pipeline and focus on the numbers you need.
Real-time metrics
You get live updates on prospects and customers.
Deal snapshots
You spot which reps close the most deals.
Sales activities tracking
You learn which actions lead to more sales.
Revenue and sales forecasts
You find top team members by revenue earned.
Individual performance
You check each rep’s wins, losses, and tasks.
AI Sales Assistant insights
You get tips to boost conversions and productivity.
Automated performance reports
You find who needs more training.
You can also watch key performance indicators (KPIs) with pipedrive dashboards. Some common KPIs are:
Sales conversion rate
Average sales cycle length
Sales win rate
Average deal size
Customer acquisition cost
Weighted pipeline value
Number of emails sent
Lead response time
With pipedrive, you use these numbers to make smart choices. You can set goals, check progress, and help your team do better. The crm dashboard keeps everyone focused on money and results.
Real-World Example: FineReport in Action
You can see how a crm dashboard helps in real life. Kintetsu World Express, a big logistics company, used FineReport to build a strong reporting system. They linked many data sources to make dashboards that update right away. Now, their sales teams see customer visits, cargo amounts, and money earned quickly.
Before FineReport, Kintetsu had trouble finding all their customer info. Sales teams could not see everything they needed. With FineReport, they made a crm dashboard that brings pipedrive data, customer talks, and team work together. This helped them decide faster and give better service.
FineReport works well for companies in manufacturing and logistics. You can link your pipedrive data, sales reports, and money numbers in one cloud crm software. You get a full look at your business. You can share dashboards with your team and check results together. This makes it easy to spot trends, fix problems, and grow your money.
Note: If you use pipedrive dashboards and pipedrive reports together, you get both the big picture and the details. This helps you lead your team and reach your money goals.
You can use Pipedrive dashboards to watch sales and help your team do better. These dashboards show you important numbers and trends very quickly. Here is a simple comparison:
Feature
Pipedrive
Freshsales
Dashboard Customization
Highly customizable visual dashboards
Specialized dashboards for functions
Reporting Flexibility
Custom field reports and forecasting
Curated and custom reporting
Collaboration
Shareable dashboard links
N/A
Key Metrics
Pipeline metrics and goal-setting
Win rates, sales cycles, customer feedback
Target Audience
Sales teams needing visualization
Lead generation and service teams
To begin:
Pick the integrations that help your business the most.
Look at how data moves in each integration.
Try using native integrations first.
Write down each step you take to set things up.
Test everything before you start using it for real.
You can find more tips and guides on websites like Klipfolio. If you want more details and stronger dashboards, try FineReport. This tool lets you connect data, change how things look, and share results with your team.
Product Trial
FineReport
Pixel-perfect reports · Interactive dashboards · Easy data entry · Digital twins
See how Dora turns trusted BI data into chat-based answers, scheduled briefings, and automated follow-up — built for real enterprise workflows, not just chat.
FAQ
What is a Pipedrive dashboard?
A Pipedrive dashboard shows your sales data in one place. You can track deals, team performance, and key numbers. This helps you make smart choices fast.
Can you customize a Pipedrive dashboard?
Yes, you can. You can add or remove widgets, change layouts, and focus on the numbers that matter most to you. This makes your dashboard fit your workflow.
How does FineReport help with dashboards?
FineReport lets you connect many data sources. You can build custom dashboards for sales, marketing, or operations. You get real-time updates and easy sharing with your team.
Is it possible to access dashboards on mobile devices?
You can view dashboards on your phone or tablet. FineReport and Pipedrive both support mobile access. This keeps you updated wherever you go.
What is the difference between a dashboard and a report?
A dashboard gives you a quick view of key numbers. A report lets you study details and trends. You use dashboards for daily checks and reports for deeper analysis.