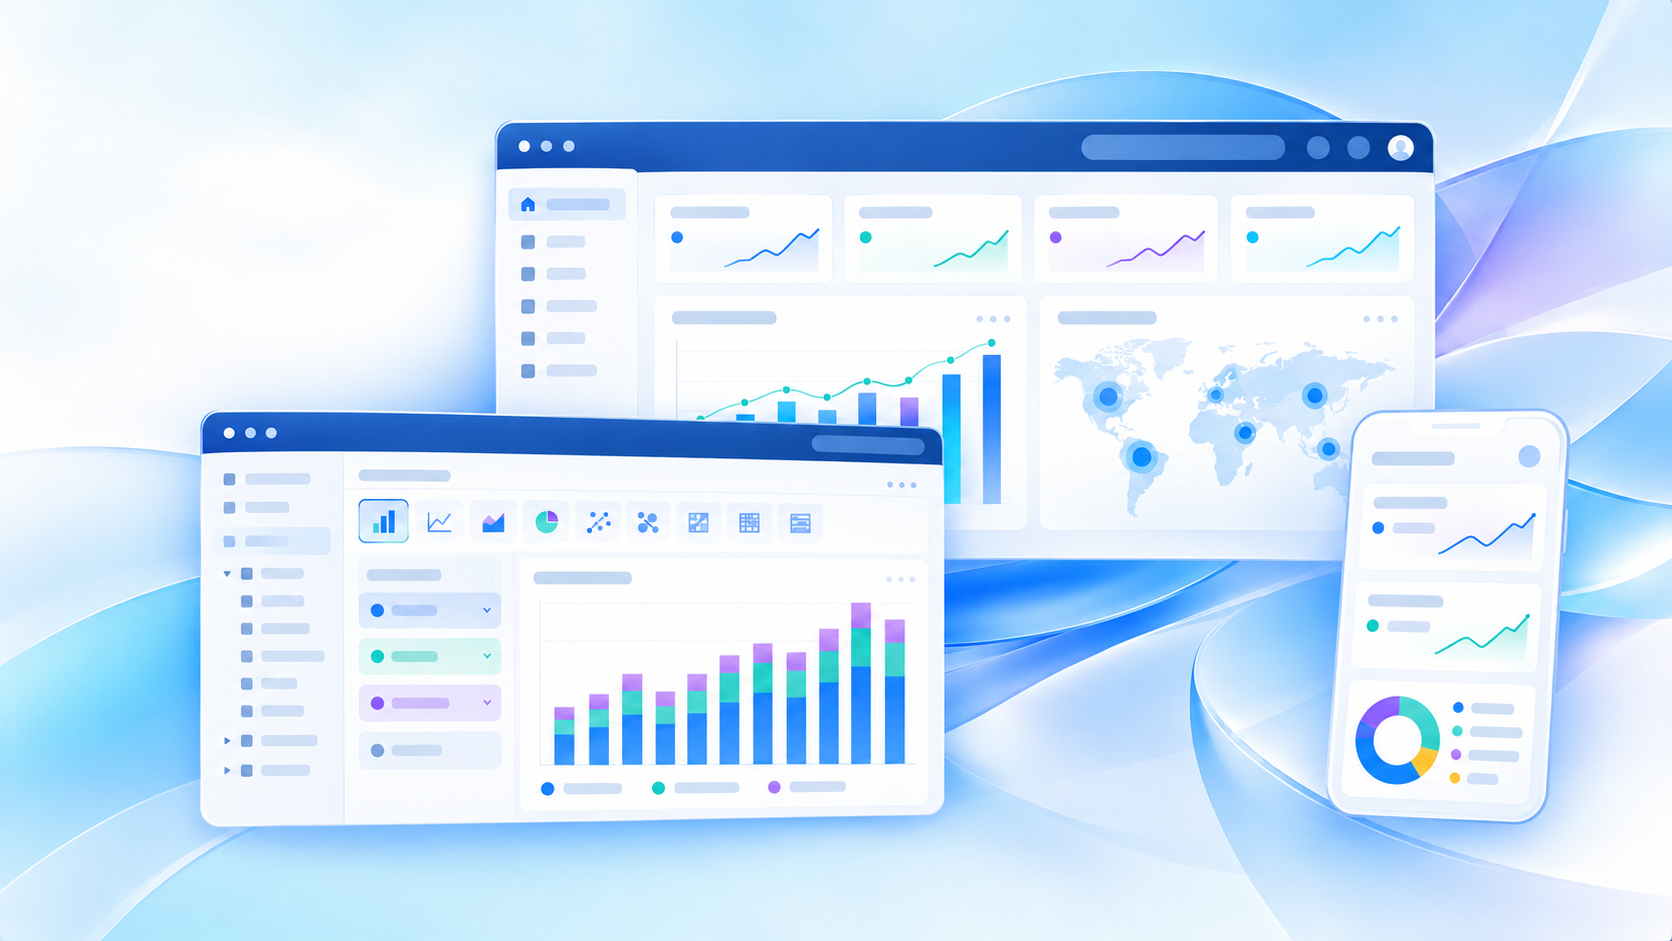
If you are searching for Microsoft Fabric vs Power BI, you are probably trying to answer a practical buying question: Do we just need dashboards and reporting, or do we need a broader analytics platform too?
That distinction matters more than most comparison articles admit. Power BI and Microsoft Fabric overlap, but they are not identical products. Power BI is primarily a business intelligence and reporting tool. Microsoft Fabric is a broader analytics platform that includes Power BI as part of a wider environment for data integration, engineering, storage, analytics, and governance.
For BI managers, data leaders, IT teams, and operations stakeholders, the real goal is not to pick a winner in a simplistic feature battle. It is to decide which operating model matches your data maturity, budget, and internal skills.
Quick Comparison Table
| Criteria | Microsoft Fabric | Power BI |
|---|---|---|
| Best for | Organizations needing a unified analytics platform | Teams focused on dashboards, reports, and self-service BI |
| Primary purpose | End-to-end data platform | Business intelligence and visualization |
| Ease of use | Broader and more complex due to multiple workloads | More approachable for reporting-focused users |
| Dashboard design | Includes Power BI for dashboards | Strong interactive dashboards and reports |
| Data preparation | Broader support for ingestion, transformation, and engineering workflows | Solid data prep for BI use cases, but not a full data platform |
| Enterprise reporting | Strong when organizations want one platform across data and analytics | Strong for reporting and semantic modeling |
| Collaboration | Useful across data engineers, analysts, and governance teams | Well suited for report consumers and analysts |
| Deployment model | Platform-oriented, often capacity-based | Commonly user-based for smaller deployments, with broader options available |
| Learning curve | Higher, especially for multi-team data programs | Lower for business reporting teams |
| Recommended users | Enterprises, data platform teams, growing organizations consolidating analytics | SMBs, analysts, department teams, reporting-first organizations |
Microsoft Fabric vs Power BI at a glance in 2026
In plain English, Power BI helps people analyze and visualize data, while Microsoft Fabric helps organizations manage more of the full analytics lifecycle.
A useful way to think about it:
- Use Power BI when your main need is reporting, dashboards, KPI tracking, and self-service analysis.
- Use Fabric when you also need a shared data foundation, broader analytics workloads, and more platform-level coordination across teams.
- Use both together when reporting is only one piece of a bigger analytics strategy.
The shortest answer for buyers is this:
- If your team needs a BI tool, Power BI may be enough.
- If your team needs a data platform, Fabric is the closer fit.
- If your organization wants one environment for upstream data work and downstream reporting, you may need both in practice because Power BI remains the familiar consumption layer inside a broader Microsoft analytics stack.
The core mistake buyers make is comparing them as if they are two standalone dashboard tools competing head-to-head. That is not really the decision. The better question is:
Are you buying for reporting only, or for the full data-to-insight workflow?
What Microsoft Fabric includes that Power BI alone does not
The broader data platform layer
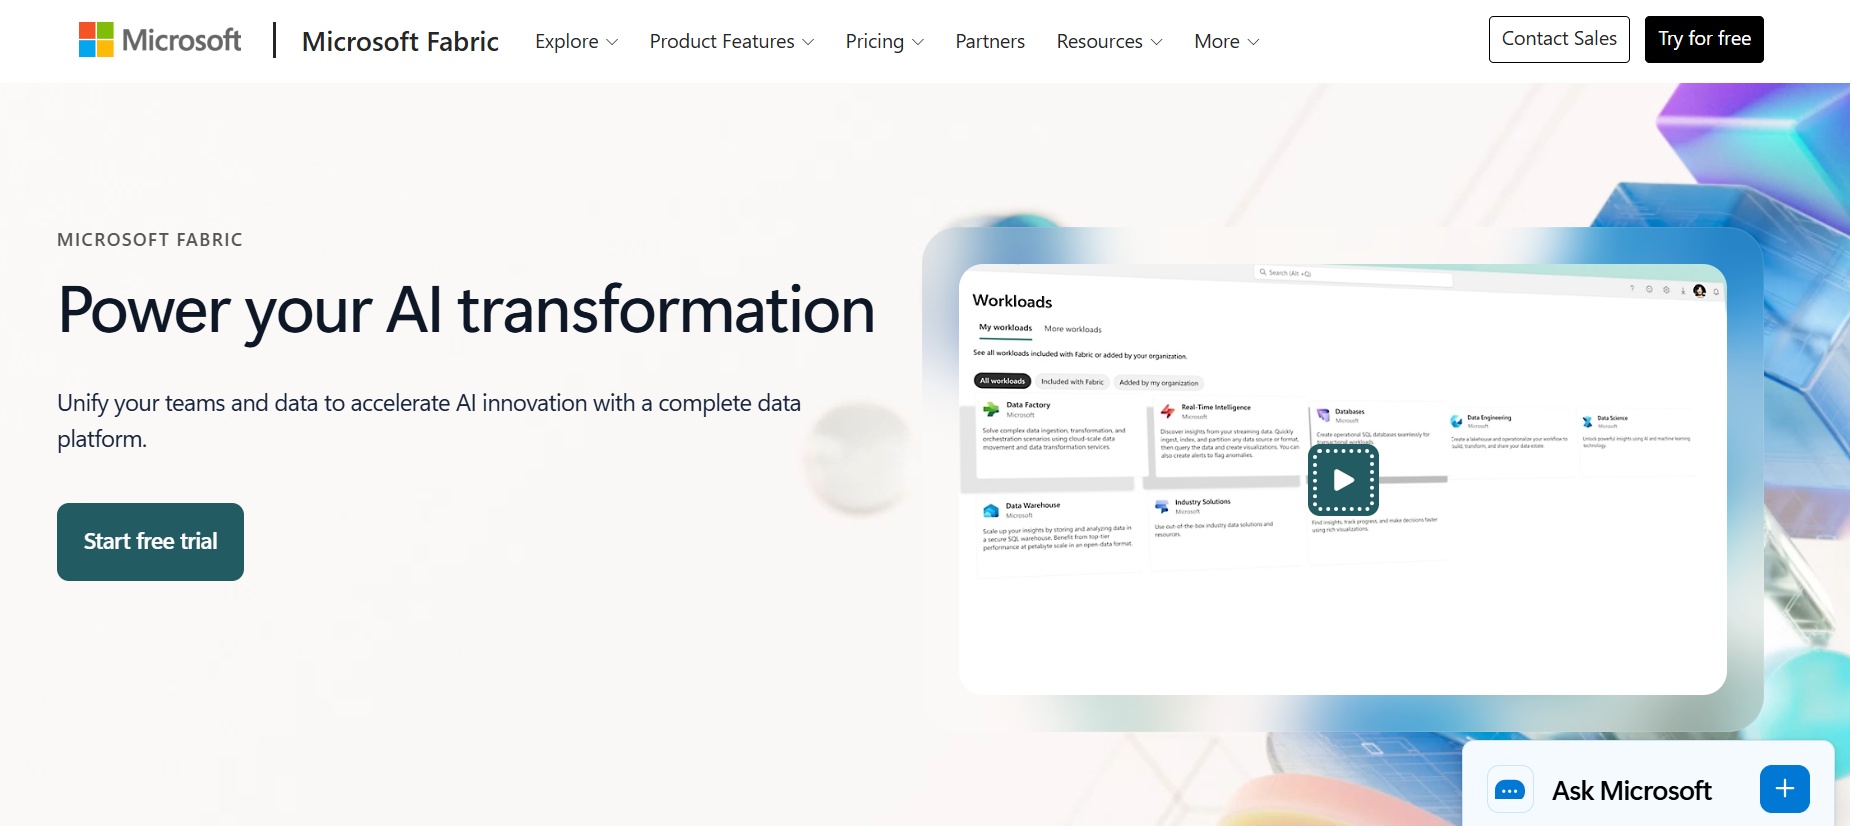
What Fabric adds beyond Power BI is the platform layer around analytics. Instead of focusing only on reports and dashboards, Fabric is designed to support more of the work that happens before and around reporting.
That broader layer typically includes capabilities associated with:
- Data ingestion and orchestration
- Data engineering workflows
- Shared storage and data organization
- Real-time or near-real-time analytics scenarios
- Data science and advanced analytics support
- Centralized governance across more of the analytics estate
This is why Fabric is often positioned as an end-to-end analytics environment, not just a reporting tool. It is meant to reduce fragmentation between teams that prepare data, model data, analyze data, and consume insights.
For organizations that have outgrown isolated dashboards, this broader foundation can matter a lot. Instead of stitching together separate services for pipelines, storage, transformation, and BI, they can evaluate a more unified operating model.
Where Power BI still remains the familiar front end
Even with all the attention on Fabric, Power BI remains highly relevant because reporting and semantic modeling still sit at the center of how many business users consume analytics.
Power BI continues to matter for:
- Interactive dashboards
- Business reporting
- Semantic models
- Self-service exploration
- KPI monitoring
- Report sharing across departments
For many organizations, the first analytics pain point is not “we need a full platform.” It is usually something simpler:
- We need executive dashboards
- We need departmental reporting
- We need better Excel replacement workflows
- We need one place to track performance
That is why many teams still start with reporting needs before they invest in a wider platform. Power BI can be the first practical step because it aligns with immediate business demand: turn data into usable insights quickly.
Real business differences: pricing, licensing, and total cost
How 2026 pricing is typically structured
The biggest pricing difference in a Microsoft Fabric vs Power BI decision is usually the buying model.
Power BI has commonly been adopted through user-based licensing, especially for smaller or reporting-first teams. Fabric is more commonly evaluated through capacity-oriented purchasing, which reflects its broader platform role.
In simple terms:
- Power BI pricing logic often starts with how many report creators and consumers need access.
- Fabric pricing logic often starts with how much platform capacity, workload activity, and enterprise usage you expect.
That means license price alone is not enough to compare them fairly.
Organizations should also estimate:
- Implementation and architecture effort
- Data migration or redesign work
- Governance setup
- Skills and training needs
- Ongoing administration
- Monitoring and optimization
- Change management for business teams
A platform can look efficient on paper but become expensive if your team lacks the expertise to operate it well. On the other hand, a tool-centric approach can appear cheaper initially but create long-term tool sprawl and duplicated effort.
Cost scenarios by company size
When a small team may overbuy with Fabric
A small company or departmental team often needs:
- Basic dashboarding
- KPI reporting
- A few shared datasets
- Moderate refresh frequency
- Light governance
In those cases, going straight to Fabric can be more platform than the business actually needs. If there is no dedicated data engineering team and no urgent need for broader analytics consolidation, a reporting-first path is usually easier to justify.
Common signs of overbuying include:
- No shared enterprise data strategy yet
- Limited internal technical skills
- Only a handful of dashboards required
- Most reporting comes from relatively clean source systems
- The main stakeholders are business users, not platform teams
When a growing or enterprise team may reduce tool sprawl by consolidating on Fabric
For larger organizations, the cost conversation changes. If multiple teams are already juggling separate tools for pipelines, storage, analytics, and reporting, then a more unified platform can reduce fragmentation.
Fabric may become more attractive when you have:
- Multiple departments using separate analytics workflows
- Growing governance requirements
- Increasing data volume and complexity
- Shared data assets needed across teams
- More advanced analytics or near-real-time use cases
- A need to align engineering, analytics, and reporting under one model
In that case, the ROI may come less from “cheaper licenses” and more from:
- Fewer disconnected tools
- Less duplicated data movement
- Better governance consistency
- Faster collaboration between technical and business teams
How to think about ROI if you already pay for Microsoft data services
If your organization already uses Microsoft products across the data stack, the decision should consider stack alignment, not just incremental license cost.
Ask questions such as:
- Are we duplicating services we already own or operate?
- Will Fabric simplify our current architecture?
- Do we have enough scale to benefit from platform consolidation?
- Will business users actually consume the extra capabilities?
- Are we solving a data platform problem, or just a reporting problem?
A common mistake is assuming the broader platform automatically creates value. ROI only improves when the platform helps the organization operate more simply, govern more consistently, or deliver insights faster.
Microsoft Fabric vs Power BI Capabilities comparison: where each option wins
When Power BI is the better fit
Power BI is often the better fit when the goal is a faster path to dashboards and reporting.
It tends to make more sense when you need:
- Self-service reporting for business users
- Interactive dashboards for executives and departments
- A relatively quick BI rollout
- Data visualization without redesigning the full data estate
- A familiar Microsoft reporting experience
Power BI is especially practical when the upstream data environment already exists. If your data is already stored and managed well enough elsewhere, then you may not need to invest immediately in a broader analytics platform just to improve reporting.
Power BI is also often the better choice for teams that want to:
- Validate demand for analytics first
- Start small and expand later
- Avoid adding platform complexity too early
- Focus on business adoption rather than architecture modernization
When Fabric is the better fit
Fabric is the stronger fit when the business need extends beyond visualization into shared analytics infrastructure.
It becomes more compelling when multiple teams need one platform for:
- Ingestion
- Transformation
- Shared storage
- Modeling
- Analytics collaboration
- Reporting at the end of the workflow
Fabric is often the better option when organizations want unified analytics, especially where separate tools have created silos between engineers, analysts, and business stakeholders.
Typical scenarios include:
- Enterprises building a standardized data operating model
- Teams supporting broad governance and compliance requirements
- Organizations trying to centralize analytics foundations
- Analytics programs where reporting is only one workload among many
- Cross-functional teams working with shared data assets
Where they work best together
In many real-world cases, this is not an either-or decision.
A common architecture pattern is:
- Fabric supports the upstream lifecycle for ingesting, organizing, and preparing data
- Power BI serves as the downstream consumption layer for dashboards, reports, and business analysis
That pattern works because the organization gets:
- A broader platform for technical teams
- A familiar reporting environment for business users
- Better alignment between data preparation and data consumption
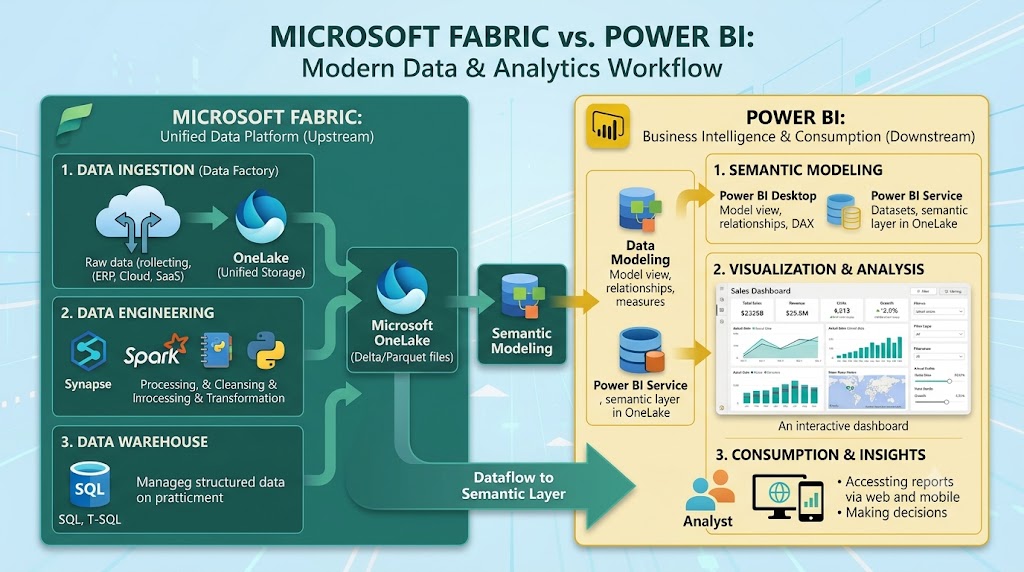
For decision-makers, this is one of the most important takeaways: Power BI can still be the right answer even if Fabric is also part of the strategy.
Microsoft Fabric vs Power BI: Who should use what in 2026
Best fit by team type
Small businesses needing reporting without major platform complexity
Small businesses usually benefit most from the simpler path. If the immediate need is visibility into sales, finance, operations, or marketing performance, Power BI is often the more direct starting point.
This is especially true when:
- The team is small
- Reporting requirements are well defined
- There is no dedicated data engineering function
- Budget discipline matters more than platform breadth
- Adoption by non-technical users is a top priority
Mid-market teams balancing speed, control, and future scalability
Mid-market organizations often sit in the gray zone. They need faster reporting today, but they also want to avoid repainting the whole architecture in two years.
For this group, the best choice depends on whether the pressure is mostly:
- Business visibility now → Power BI first
- Platform standardization now → Fabric becomes more attractive
- Both at once → consider a phased strategy using reporting as the starting point and broader platform capabilities where needed
The right answer is often less about product marketing and more about sequencing.
Enterprises standardizing governance, data operations, and advanced analytics
Enterprises usually have more reasons to evaluate Fabric seriously because they face broader coordination problems:
- Multiple teams
- Higher data volume
- Governance demands
- Analytics silos
- More diverse workloads
- Pressure to support AI and advanced analytics initiatives
That said, even enterprises should not assume they need every capability immediately. The most successful programs usually tie platform adoption to clear operating needs, not abstract modernization goals.
Practical decision checklist
Use these questions to clarify whether you need Power BI, Fabric, or both:
- Is our primary goal dashboarding and reporting, or broader analytics operations?
- Do we already have a working data platform outside Microsoft?
- Are our data sources relatively clean, or do we need significant engineering and transformation?
- Do we have internal skills to manage a broader analytics platform?
- Will multiple teams share the same data foundation?
- Are governance and standardization becoming urgent?
- Are we trying to reduce tool sprawl?
- Is our current pain point about visibility, data plumbing, or both?
Warning signs you need Power BI now, Fabric later:
- Business users are waiting on dashboards
- Reporting is the immediate bottleneck
- Data engineering maturity is still developing
- You need quick wins before a larger platform investment
Warning signs you may need Fabric from the start:
- Reporting delays are caused by upstream data fragmentation
- Multiple teams are duplicating pipelines and datasets
- Governance problems are growing
- The organization wants a more unified analytics operating model
- BI is only one part of a broader modernization effort
Final recommendation: how to choose without overcomplicating it
The simplest framework is this:
-
Start with the use case
- If the job is reporting and self-service analysis, start with Power BI.
- If the job is end-to-end analytics operations, evaluate Fabric.
-
Check your scale
- Smaller teams usually need less platform breadth.
- Larger organizations often benefit more from consolidation.
-
Look at your operating model
- Reporting-led organizations can adopt BI first.
- Platform-led organizations may justify Fabric earlier.
-
Be honest about internal skills
- A broader platform creates more value only if your team can govern and operate it effectively.
For many organizations upgrading from standalone BI toward a broader data platform, the most likely path is:
- Start by solving reporting needs
- Standardize semantic logic and KPI definitions
- Improve governance and shared data foundations
- Expand into broader platform capabilities when scale and complexity justify it
In other words, do not overcomplicate a reporting problem by buying a platform too early. But do not under-solve a platform problem by treating it as a dashboard purchase.
Practical recommendations before you decide
Here are five consultant-style recommendations to make the decision easier:
-
Map the bottleneck first
Identify whether your delay is in dashboard creation, data preparation, governance, or cross-team coordination. -
Estimate total operating cost, not just license cost
Include implementation effort, training, ownership, and the overhead of managing multiple tools. -
Run a use-case-based proof of concept
Test one real business workflow end to end instead of comparing products only through demos. -
Separate business-user needs from platform-team needs
Reporting users and data engineers often need different capabilities, and one buying decision may need to serve both groups. -
Plan a phased architecture if you are unsure
It is often smarter to sequence adoption than to force a full-platform decision too early.
A practical alternative for teams comparing BI complexity: FineBI + Dora
Tools like Power BI and Microsoft Fabric are widely used in the BI market, but teams that need a more business-user-friendly, self-service BI platform may also consider FineBI.
FineBI is designed for organizations that want to make analytics more accessible to business teams without requiring every user to think like a data engineer. It is especially relevant when the priority is:
- Self-service BI adoption
- Drag-and-drop analysis
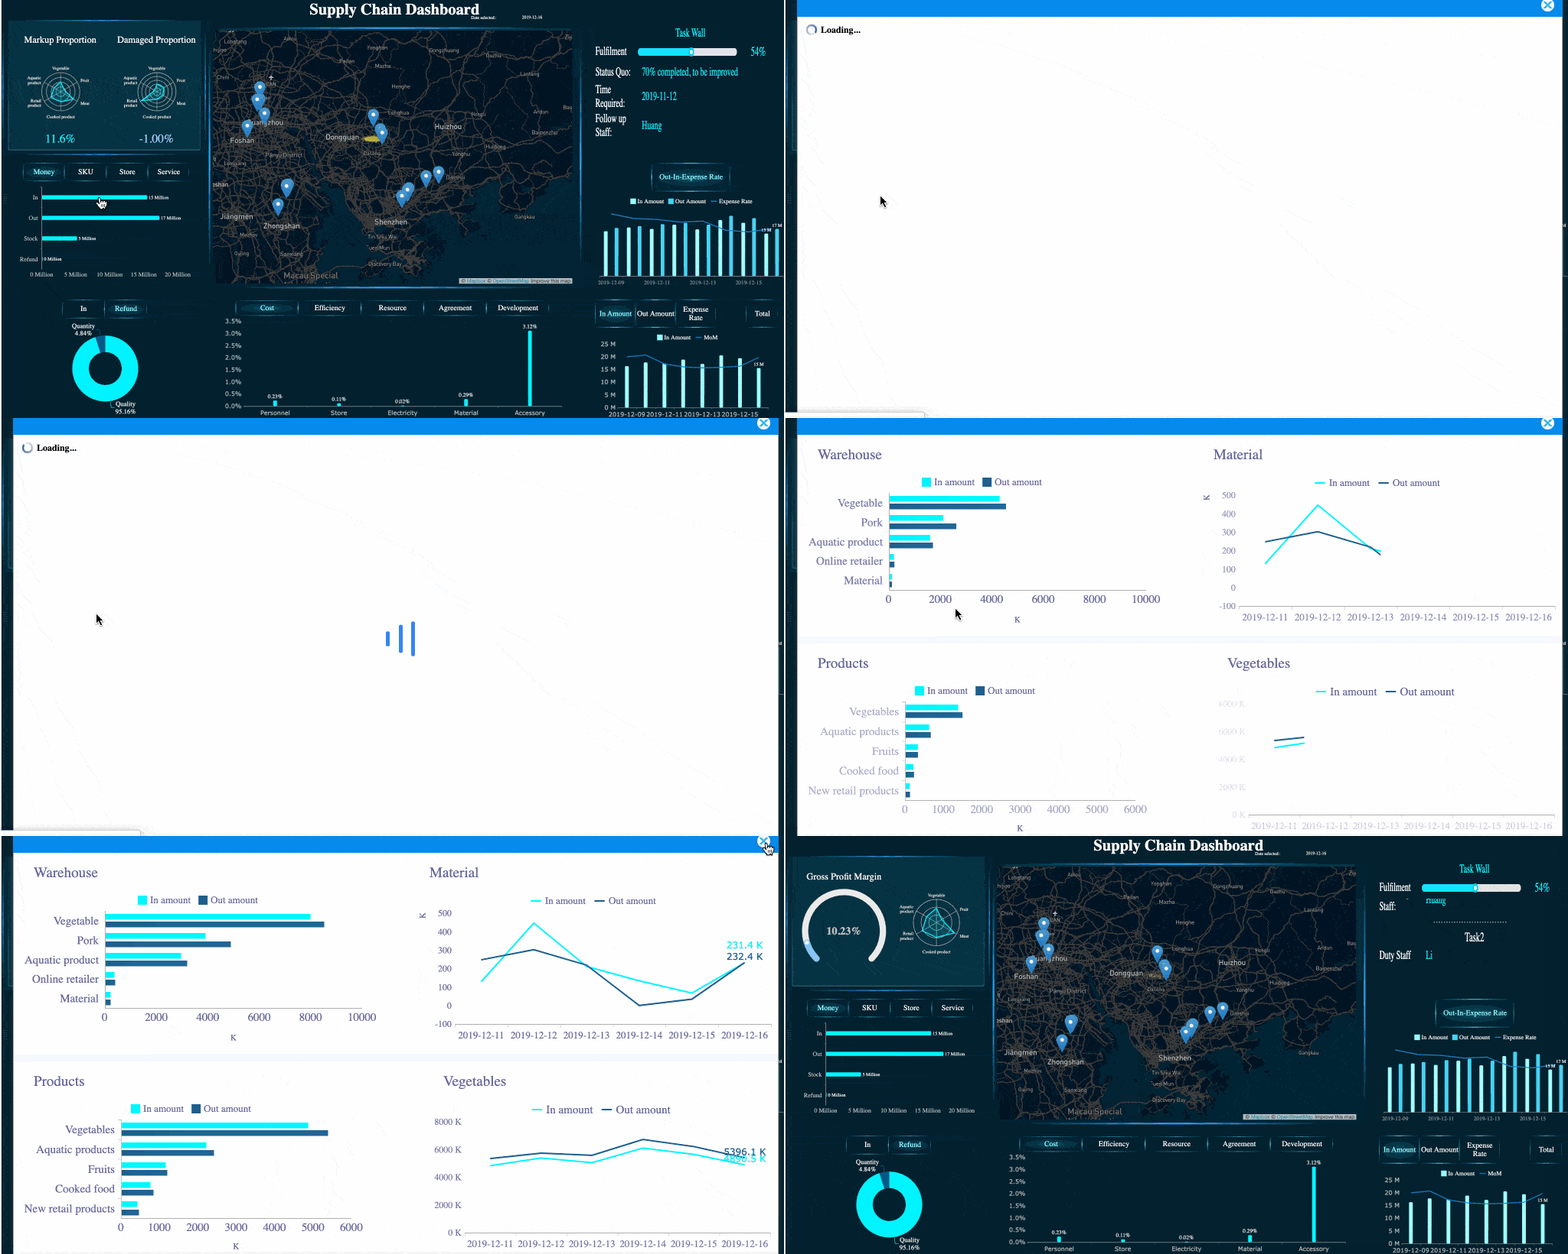
- Interactive dashboard creation
- Drill-down exploration
- Faster dashboard iteration for business teams
- Shared access to trusted enterprise data
 Drill-down exploration
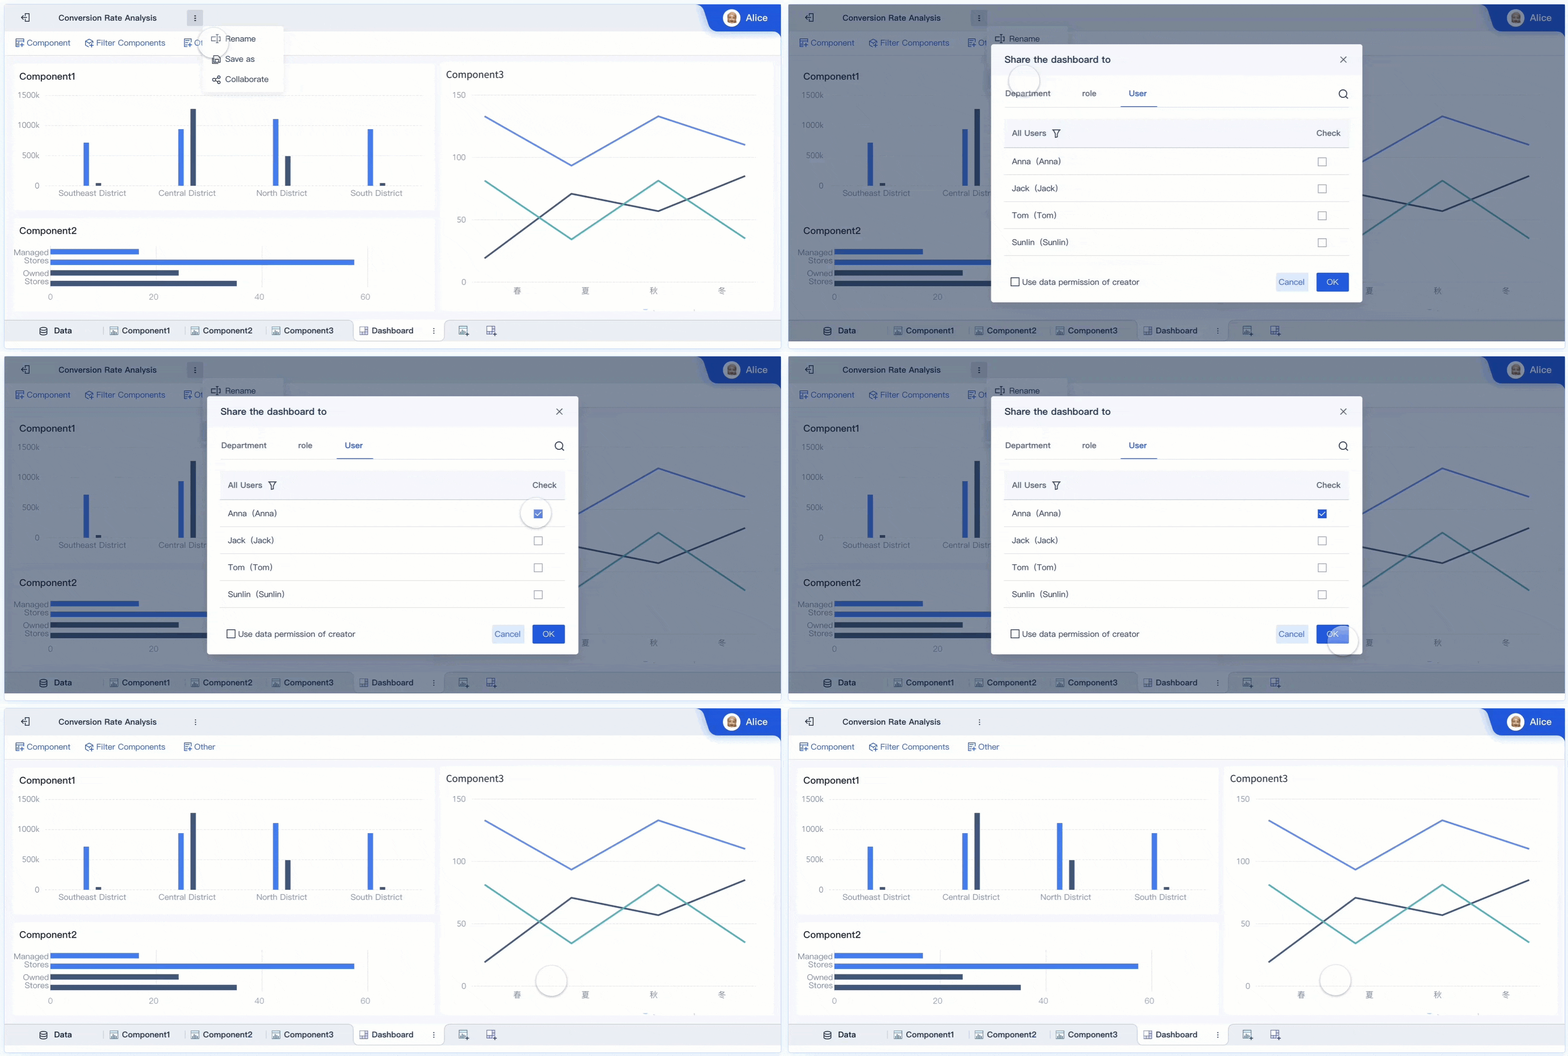 Sharing and Collaboration
For organizations comparing reporting-first approaches, FineBI can be a practical option when the goal is to shorten the path from business question to dashboard insight.
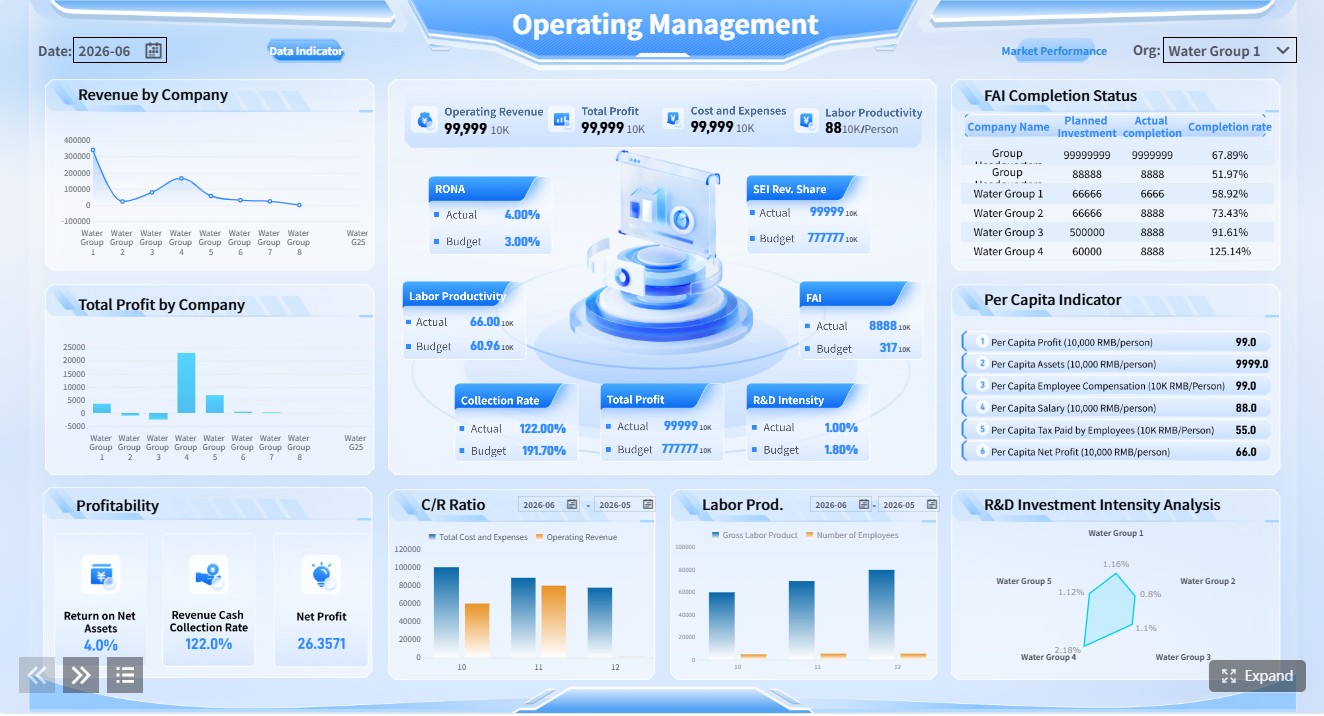
FineBI helps build the trusted dashboard and metric foundation, while Dora extends that foundation into a more advanced AI-assisted operating model.
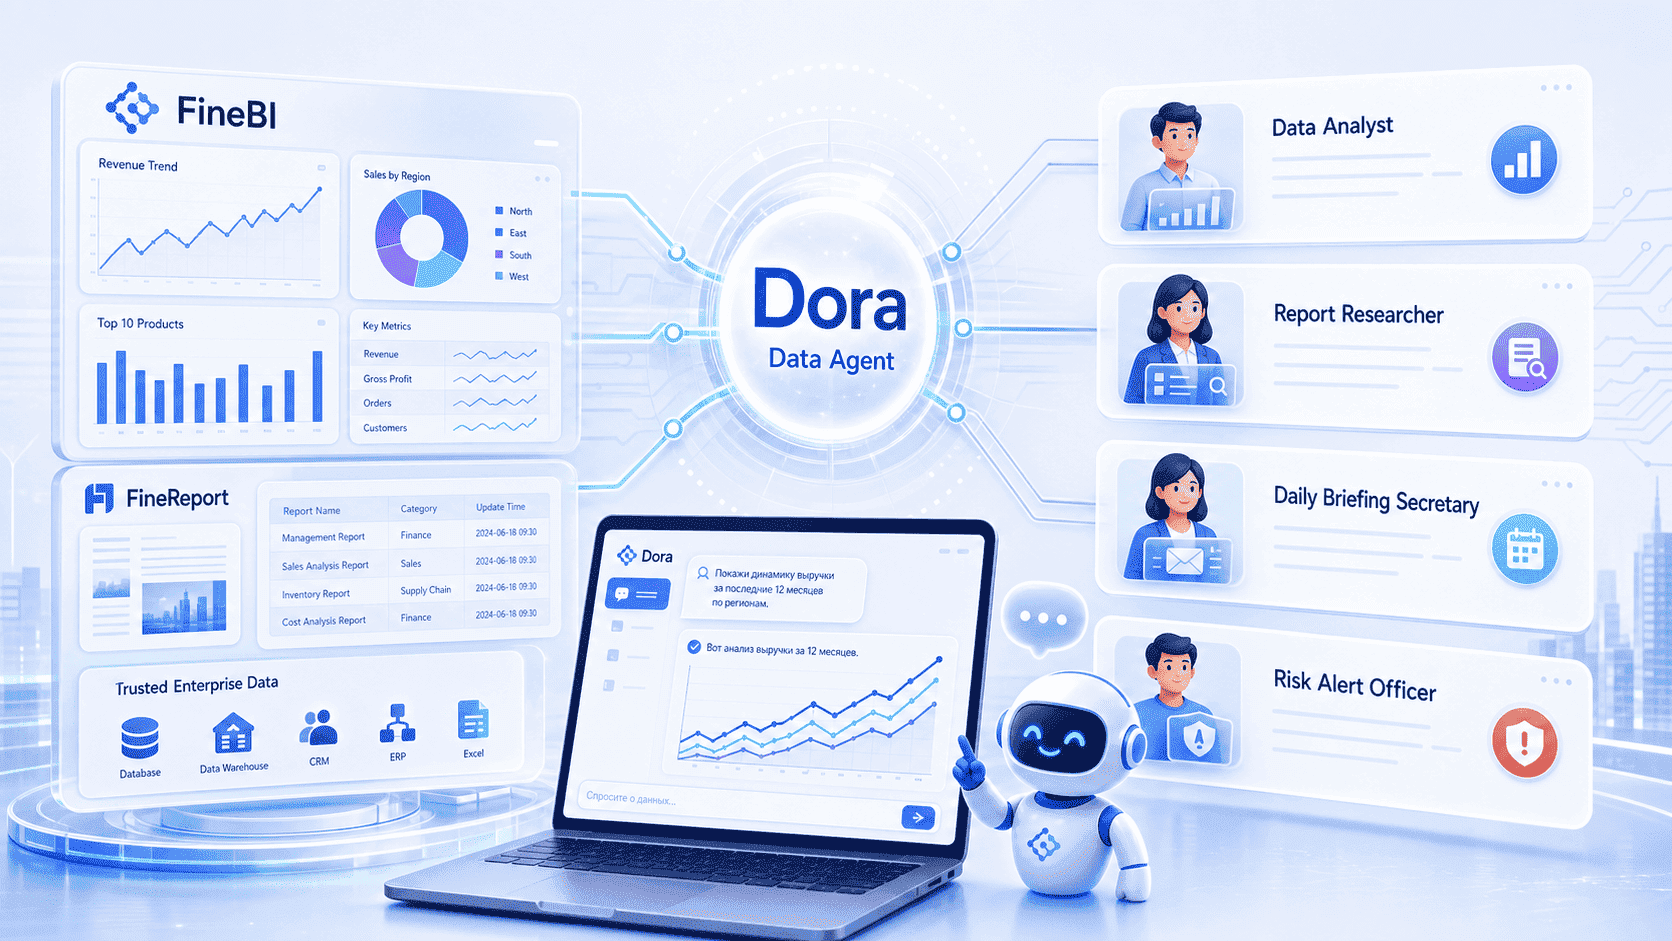
Dora is FanRuan’s enterprise Data Agent platform. Rather than acting like a generic chatbot, Dora works as an AI assistant or AI digital employee layer on top of FineBI and existing enterprise data assets. Together, FineBI + Dora supports a shift from people only viewing dashboards to AI helping users ask, analyze, generate, push, alert, and follow up through a governed workflow.
This is where the combination becomes especially relevant for enterprises exploring the future of BI:
- FineBI provides the governed dashboard, semantic logic, and business metrics foundation
- Dora turns that foundation into scenario-specific Agentic BI
Dora can support workflows such as:
- Data Analyst digital employee
- Report Researcher
- Daily Briefing Secretary
- Risk Alert Officer
That positioning matters because many organizations do not just want more dashboards. They want analytics systems that help people move from passive monitoring to guided action.

Get Ready-to-Use Dashboard Templates in Fine Gallery
If your team is evaluating not only how to visualize data, but also how to make BI more usable for business users and more actionable with governed AI workflows, FineBI + Dora is worth considering alongside Microsoft-centric options.
The bottom line
The best way to approach Microsoft Fabric vs Power BI in 2026 is to stop asking which one is universally better and start asking what problem you are actually solving.
- Choose Power BI when reporting, dashboards, and self-service BI are the main need.
- Choose Fabric when you need a broader analytics platform across the data lifecycle.
- Choose both when your organization wants a unified upstream foundation with a familiar downstream reporting layer.
And if your team wants a strong self-service BI experience with a practical path toward governed, AI-assisted analytics, FineBI + Dora is a sensible option to evaluate as well.
FAQs
Power BI is mainly for dashboards, reports, and self-service analysis, while Microsoft Fabric is a broader analytics platform. Fabric includes Power BI but also adds data engineering, storage, pipelines, and governance capabilities.