Manufacturers often invest in OEE tracking software to get a clearer picture of production performance. But the real value of OEE does not come from displaying a percentage on a dashboard. It comes from using that data to understand where losses happen, why they happen, and what actions will actually reduce them.
When used correctly, OEE tracking software helps teams move beyond passive monitoring. It connects machine signals, operator input, downtime reasons, speed losses, and quality events into a system that supports root cause analysis and continuous improvement. Instead of asking, “What is our OEE today?” the better question becomes, “What specific losses are preventing better output, and what should we do next?”
Why OEE tracking software matters beyond the score
A single OEE percentage is useful as a summary, but it is not enough to improve operations by itself. If a line runs at 62% OEE, that number tells you performance is below potential, but it does not tell you whether the biggest problem is breakdowns, slow cycles, short stops, changeovers, startup scrap, or recurring defects. Without that detail, improvement efforts often become guesswork.
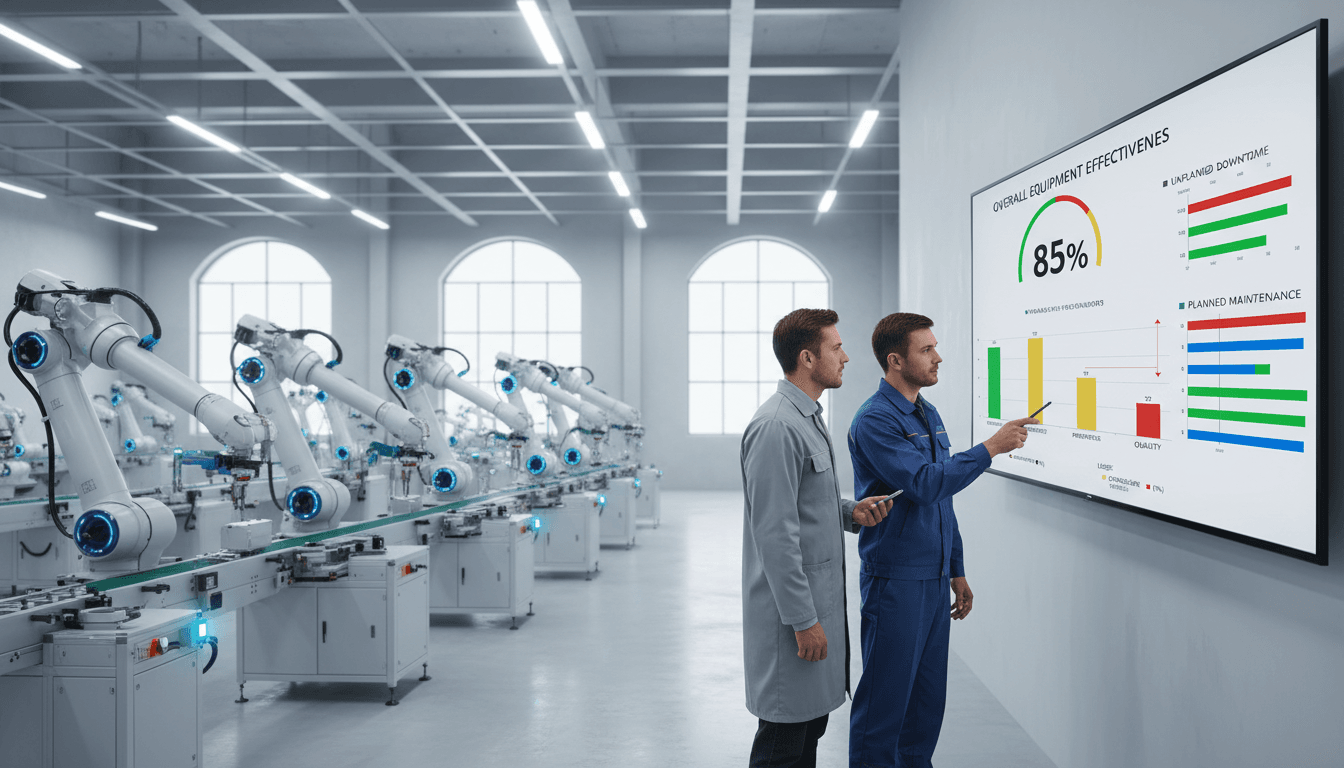
That is why OEE tracking software matters beyond the score. Good software breaks OEE into its three components:
Availability: time lost to downtime and stoppages
Performance: time lost to running below ideal speed
Quality: time and materials lost to defects and rework
This structure matters because each category requires different decisions. A maintenance-driven downtime issue needs a different response than a training issue, a setup problem, or a raw material quality problem. The software helps translate high-level metrics into a practical daily management system.
More importantly, there is a big difference between tracking metrics and finding actionable causes. Tracking means you can see what happened. Root cause analysis means you understand why it happened and what should be changed. The best OEE systems support both, but improvement only begins when teams use the data to connect losses with specific events, patterns, and operating conditions.
How to use OEE tracking software for root cause analysis
Start with clean, reliable production data
Root cause analysis is only as good as the data behind it. If machine states are unclear, downtime categories are inconsistent, or operators classify the same issue in different ways, the analysis will be misleading. Before trying to diagnose losses, define exactly what the system should capture.
That usually includes:
Running state
Idle state
Planned stop
Unplanned downtime
Changeover
Minor stop
Reduced speed
Scrap or reject events
Rework events
Quality hold or inspection delays
Each state should have a clear operational definition. For example, teams need to agree on when a short interruption becomes downtime instead of a minor stop, or whether waiting for materials belongs under logistics, scheduling, or line starvation. Ambiguity creates weak data, and weak data leads to poor decisions.
Operator input also needs to be standardized. If one shift records “jam,” another records “blockage,” and a third uses “machine issue,” then the same recurring problem may appear as three unrelated losses. Standard entry rules, guided workflows, and simple operator screens are essential. The goal is not to collect more data. The goal is to collect data that can actually support accurate analysis.
Break losses into the right categories
Once the data foundation is solid, the next step is to categorize losses correctly. Effective OEE tracking software should help separate the major production loss types instead of combining them into broad, unhelpful buckets.
The main categories typically include:
Planned stops such as scheduled breaks, planned maintenance, or no production orders
Unplanned downtime such as equipment failures, jams, sensor faults, or utility interruptions
Speed loss when the line runs below its ideal cycle rate
Minor stops that are frequent but short enough to be missed in manual logs
Scrap and defects that reduce good output
This distinction is important because each category affects OEE differently and points to different causes. A plant may think downtime is the main issue, only to discover that cumulative small stops and reduced speed are creating a larger output gap than major breakdowns.
Consistent reason codes are critical here. Avoid vague labels like:
Other
General issue
Mechanical problem
Production delay
Instead, build a reason structure that reflects real plant conditions. A useful downtime reason tree might move from broad to specific, such as:
Equipment failure
Conveyor
Motor
Sensor
Sealer
Material issue
Film break
Incorrect label
Missing components
Changeover
Tooling adjustment
Recipe loading
First article approval
This level of structure makes it much easier to identify repeat causes without overlapping explanations.
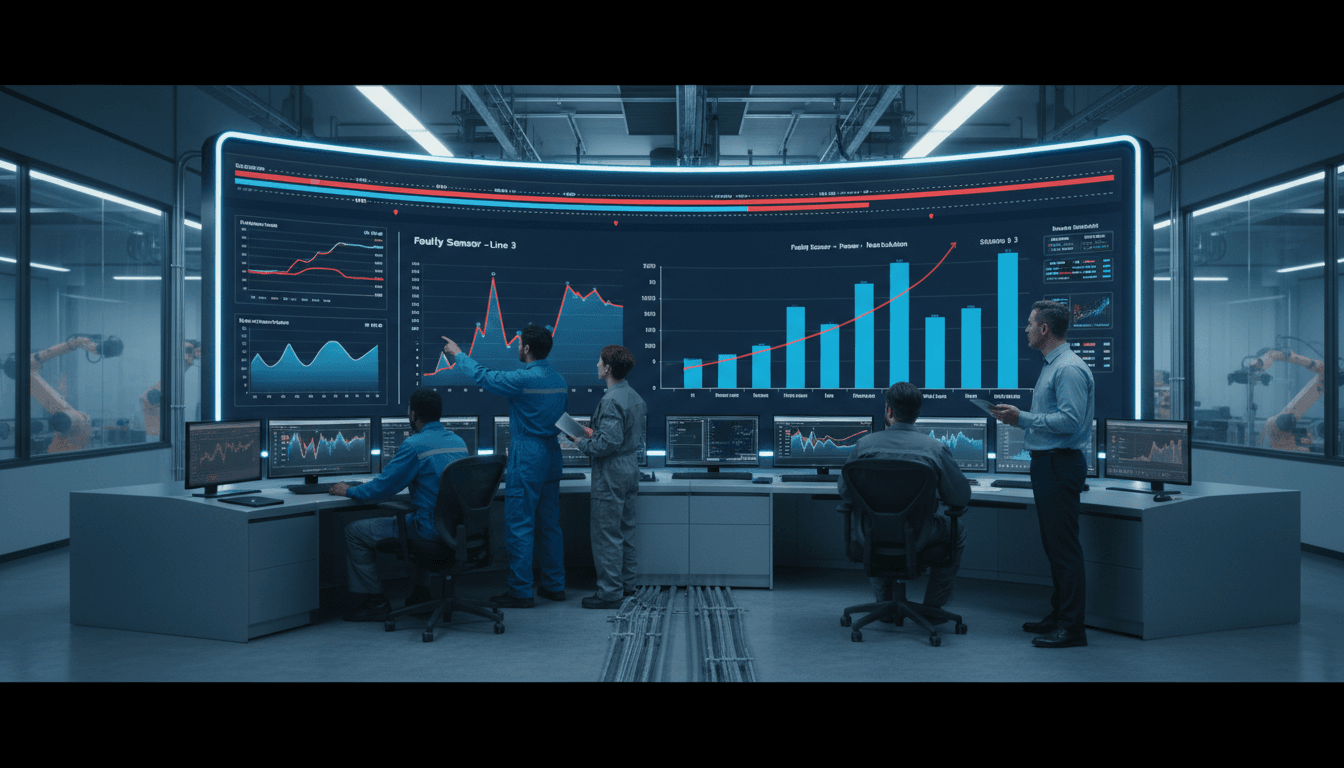
Drill from trends into events
Root cause analysis should begin with trends, then move into specific events. A good OEE dashboard may show that one line underperformed last week, but real insight comes when you drill down by shift, asset, product, operator team, or SKU.
Useful analysis paths include:
Comparing OEE by line or machine
Reviewing downtime by shift
Checking whether certain SKUs create more speed loss
Looking for repeated failures at the same time of day
Identifying whether one crew reports more minor stops or scrap than others
Studying event timelines around changeovers, startups, or maintenance windows
For example, if performance drops every time a specific product runs on second shift, the problem may not be the machine alone. It could be setup variation, material differences, operator practices, or cleaning-related adjustments from the previous run. The software helps narrow the investigation by showing patterns that are hard to detect in spreadsheets or manual shift notes.
Event timelines are especially valuable. Instead of only seeing totals, teams can examine the exact sequence of production losses. A recurring pattern such as minor stops followed by speed loss and then scrap may indicate a developing mechanical issue rather than separate unrelated events.
Confirm causes before taking action
Data can point to likely causes, but it should not replace direct validation. One of the most common mistakes is treating the most visible pattern as the root cause without confirming it with the people closest to the process.
Before assigning corrective actions, review findings with:
Operators
Maintenance technicians
Production supervisors
Quality personnel
Process engineers
This step helps distinguish symptoms from causes. For instance, repeated “jam” events may not be the real root cause. The true issue could be worn guides, inconsistent material dimensions, incorrect settings after changeover, or insufficient cleaning during sanitation. The software tells you where to look, but cross-functional review helps you verify what is actually happening.
A simple way to validate is to ask:
What event appears most often?
Under what conditions does it occur?
What changed before the problem started?
Does direct observation confirm the data pattern?
What cause would explain the full sequence of losses?
That discipline keeps teams from launching corrective actions that only treat surface-level symptoms.
Turning OEE insights into actionable loss reduction
Prioritize the biggest losses first
Once recurring causes are identified, the next goal is to decide where to act first. Not every loss deserves the same level of attention. The best improvement opportunities usually come from the few issues that create the largest gap in output.
Use OEE tracking software to rank losses by:
Frequency
Duration
Lost production volume
Cost impact
Scrap impact
Repeatability across shifts or assets
A Pareto view is often effective here. It helps teams focus on the small number of issues responsible for most lost production. A line may experience dozens of downtime reasons, but only three or four may account for the majority of lost time.
This prioritization matters because plants often spread effort too widely. When every problem is treated as urgent, the biggest opportunities remain unresolved. Strong loss reduction begins with concentration, not complexity.
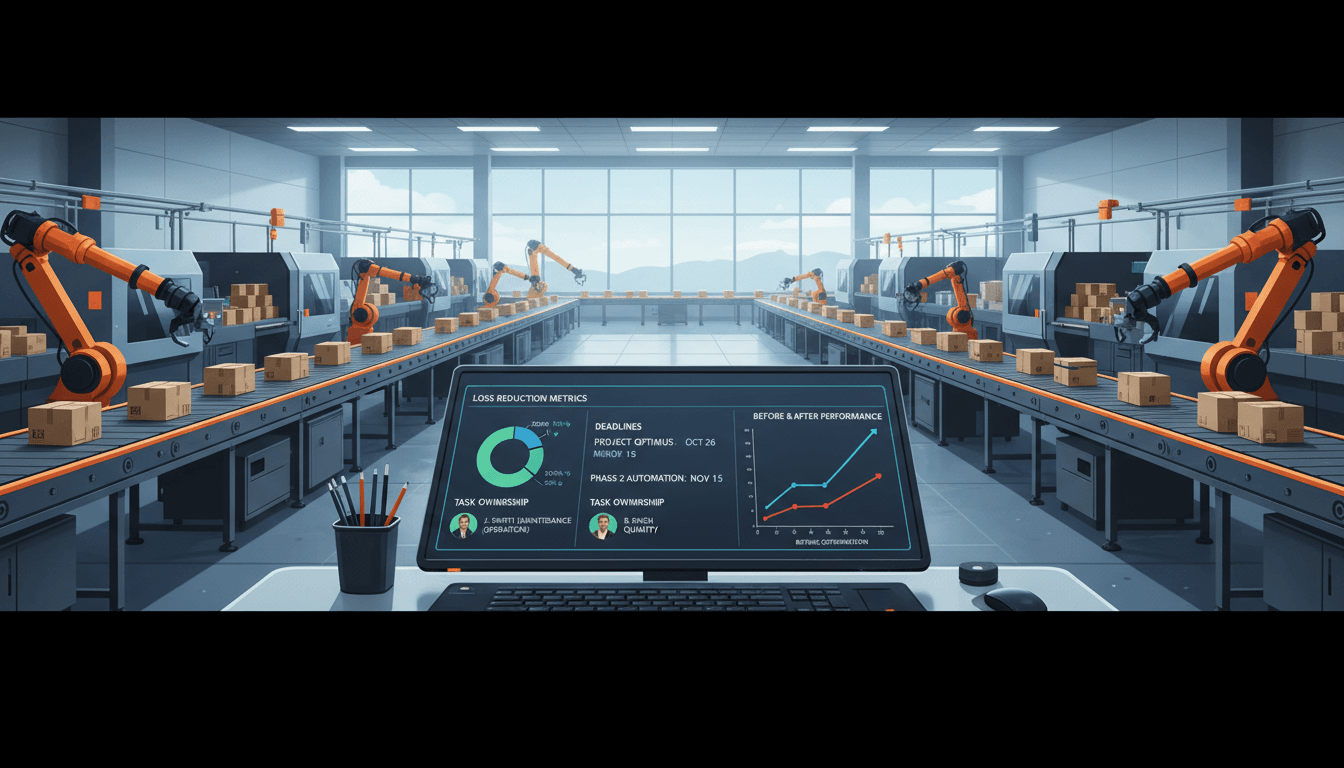
Assign owners and deadlines for corrective actions
Analysis alone does not improve OEE. Improvement happens when recurring losses are linked to specific actions, owners, and follow-up dates. Every major issue identified in the software should lead to a basic action plan.
That plan should define:
The recurring loss being addressed
The confirmed root cause
The corrective action
The owner
The due date
The expected result
The metric used to verify improvement
For example:
Loss Pattern
Root Cause
Action Owner
Due Date
Expected Result
Frequent sealer jams
Worn guide alignment
Maintenance lead
Friday
30% reduction in sealer downtime
Slow cycles on SKU B
Incorrect standard settings
Process engineer
Next shift review
Restore target cycle rate
Startup scrap after changeover
Inconsistent setup checklist
Production supervisor
End of week
Lower startup reject rate
This is also a good place to use a reporting and action management platform that can turn OEE insights into structured follow-up. When discussing recommended tools, FineReport is worth considering because it can help plants build visual reports, track recurring losses, assign improvement tasks, and create management dashboards that connect shop floor events with operational review. For organizations that need flexible reporting across production, maintenance, and leadership layers, FineReport can support stronger visibility and accountability.
The key is to track whether actions actually reduce downtime, slow cycles, or defects over time. If the metric does not improve, the team may have addressed the wrong cause or implemented the right idea inconsistently.
Build a continuous improvement loop
The most effective use of OEE tracking software is not a one-time analysis project. It is a continuous improvement loop that turns production data into routine operational learning.
A practical loop often looks like this:
Capture accurate production and loss data
Review top losses daily
Investigate recurring patterns weekly
Confirm root causes with cross-functional teams
Assign corrective actions
Measure results over time
Update standards and reason codes as needed
Daily meetings should focus on immediate issues and current shift performance. Weekly reviews should focus on recurring patterns, trend movement, and unresolved action items. As the process matures, reason codes, operator workflows, and standard work instructions should evolve too.
If a code is too vague, refine it. If operators are selecting the wrong reasons, simplify the interface. If new process changes eliminate old problems, update the loss model so the system reflects current reality. Continuous improvement requires the measurement system to improve alongside the process.
What to look for in an OEE software and monitoring system
Core features that support analysis
Not all OEE tools are equally useful for root cause analysis. Some systems are mainly scoreboards, while others provide the depth needed to investigate and reduce losses. If the goal is real improvement, look for software that supports both monitoring and structured analysis.
Key features include:
Real-time dashboards for live production visibility
Alerts for abnormal downtime, speed loss, or reject spikes
Event timelines that show the sequence of production losses
Historical reporting to compare trends over time
Custom reason trees for downtime and scrap classification
Operator workflows for guided data entry and exception handling
Integrations with MES, ERP, SCADA, PLC, sensors, and quality systems
These features help ensure that the system is not just calculating OEE, but also helping explain it. Real-time data supports fast response, while historical analysis supports better decisions on recurring issues.
Usability matters on the shop floor
Even the best analytics engine will fail if shop floor teams do not use it consistently. That is why usability matters. The interface should be simple enough for operators to enter reasons quickly and correctly, without creating extra friction during production.
A good shop floor experience includes:
Clear machine status displays
Easy selection of downtime reasons
Minimal training required for common tasks
Visual prompts that reduce input errors
Mobile or tablet access where needed
Screens that highlight what action is needed now
Simple interfaces improve adoption, and adoption improves data quality. This is especially important for mixed environments where some data is automated and some still depends on operator confirmation or context entry.
Clear visuals also help non-technical users understand problems faster. Supervisors and line leaders should be able to look at a dashboard and quickly answer basic questions like:
What is down right now?
What are the top losses this shift?
Is speed loss increasing on a specific product?
Are defects concentrated on one machine or one crew?
If the software makes these answers hard to find, teams will fall back to spreadsheets, emails, and guesswork.
Reporting for plant and enterprise teams
OEE reporting needs vary by role. Operators need live status. Supervisors need shift-level accountability. Plant managers need trend views and top losses. Enterprise leaders need comparable reporting across lines, plants, and time periods.
That makes structured reporting a critical part of any OEE software and monitoring system. Useful reporting capabilities should support:
Comparison across assets and production lines
Comparison across plants or business units
Analysis by day, week, month, and quarter
Product and SKU-level performance review
Exportable summaries for operations meetings
Trend views for capacity, downtime, and quality loss
This is another area where FineReport can be a strong fit. It is especially useful for organizations that need flexible, exportable, and highly visual reports for both plant teams and enterprise leadership. If your operation wants to combine OEE data with maintenance, quality, ERP, or production planning information, FineReport can help create unified dashboards and structured reporting views that support deeper decision-making.
Common mistakes when using OEE software for root cause analysis
Many OEE initiatives fail not because the software is weak, but because the process around it is poorly designed. Several mistakes appear repeatedly across plants.
Treating OEE as a scorecard instead of an improvement tool
If teams only review the final percentage, they miss the underlying losses that actually matter. OEE should point to action, not just performance ranking.
Collecting too much data without a clear loss model
More data does not automatically create better insight. If there is no clear structure for machine states, downtime reasons, and quality categories, analysis becomes noisy and confusing.
Using inconsistent downtime reasons across shifts or sites
Inconsistent coding makes trend analysis unreliable. Two lines may appear different only because they classify the same event differently. Standardization is essential for trustworthy comparison.
Failing to close the loop between findings, actions, and measured results
This is one of the biggest gaps. Teams identify a top loss, discuss it in a meeting, and then move on without assigning ownership or checking whether the issue improved. Without follow-through, OEE tracking becomes passive observation.
To avoid these mistakes, plants need a management routine that links data review, root cause validation, action planning, and result tracking into one system.
How to choose the right next step for your operation
The right next step depends on your plant size, process complexity, and improvement goals. A small operation with a few manual lines may need a lightweight OEE tracking approach with simple dashboards and reason capture. A multi-site manufacturer may need enterprise reporting, automated machine connectivity, custom reason trees, and integration with MES or ERP platforms.
When evaluating options, ask these questions:
Does the tool help us calculate OEE accurately?
Does it help explain losses, not just display them?
Can operators use it easily and consistently?
Can we standardize reason codes across shifts and sites?
Does it support root cause analysis with drill-down reports and timelines?
Can it track corrective actions and improvement over time?
Will it integrate with the systems we already use?
It is also smart to start with a pilot. Implement the software on one line, cell, or asset first. Use that pilot to test data quality, operator adoption, reporting usefulness, and improvement workflow. If the system helps your team identify real causes and sustain measurable gains, then scale it across the operation with stronger confidence.
Ultimately, OEE tracking software should do more than tell you how well equipment performed yesterday. It should help your teams understand loss patterns, confirm root causes, prioritize action, and build a repeatable path to better output. When the software becomes part of daily problem-solving instead of just monthly reporting, it starts delivering the real value manufacturers are looking for.
FAQs
It connects OEE losses to specific events such as breakdowns, slow cycles, minor stops, changeovers, and quality issues. That lets teams move from a high-level score to the actual reasons output is being lost.
It should capture machine states, downtime events, cycle speed, scrap or rework, and standardized operator-entered reasons. Clean and consistent data is essential if you want accurate analysis and useful corrective actions.
Reason codes make recurring losses visible by grouping similar events in a consistent way. If teams use vague or inconsistent labels, the software cannot reliably show the true cause patterns behind low OEE.
Yes, many systems provide real-time visibility into downtime, speed loss, and quality events as they happen. This helps supervisors and operators respond during the shift instead of waiting for end-of-day reports.
Start by validating data quality, then review trends by line, shift, product, or machine before drilling into specific events. Focus on the largest recurring losses first, assign actions, and track whether the changes improve availability, performance, or quality over time.
Product Trial
FineReport
Pixel-perfect reports · Interactive dashboards · Easy data entry · Digital twins