OEE, or Overall Equipment Effectiveness, is one of the most useful manufacturing metrics for understanding how well a machine or production line is really performing. If you are new to production metrics, OEE can sound technical at first. But once you break it into simple parts, it becomes a practical tool that helps operators, supervisors, maintenance teams, and production leaders see where time and output are being lost.
This beginner-friendly guide explains OEE in plain language, shows how it is calculated, and walks through simple shop floor examples so you can understand what the number means in daily production.
What Is OEE and Why It Matters on the Shop Floor
At its simplest, OEE measures how effectively equipment is used during planned production time. It tells you how much of that time was truly productive.
A machine may look busy all day, but that does not always mean it is performing well. It might stop often, run slower than expected, or produce bad parts. OEE helps reveal those hidden losses in one clear percentage.
For first-time readers, think of OEE as a quick answer to this question:
“Out of the time we planned to produce, how much was spent making good parts at the right speed?”
If a machine had no downtime, ran at the ideal speed, and produced only good parts, its OEE would be 100%. In real factories, that never happens perfectly, which is why OEE is so useful. It shows the gap between actual performance and ideal performance.
OEE matters on the shop floor because it helps teams understand equipment losses at a glance. Instead of only saying, “The line had a bad shift,” OEE helps explain why:
Did the machine stop too often?
Did it run slower than normal?
Did it make too much scrap?
That makes OEE more than a reporting metric. It becomes a daily improvement tool. Operators can spot recurring short stops. Maintenance can focus on breakdown causes. Supervisors can see whether a low result came from downtime, speed loss, or quality issues.
Used well, OEE supports better decisions during the shift, not just after the shift.
The Three Parts of OEE: Availability, Performance, and Quality
OEE is built from three factors:
Availability
Performance
Quality
Each one shows a different kind of production loss. When combined, they give a fuller picture of equipment effectiveness.
Availability: When the Machine Is Ready to Run
Availability measures how much of the planned production time the machine was actually running.
If production was scheduled for 8 hours, but the machine was down for part of that time, Availability goes down.
Common reasons include:
Breakdowns: the equipment fails and cannot run
Changeovers: time spent switching from one product or setup to another
Waiting time: no material, no operator, no tool, no instructions
Other downtime: cleaning, adjustments, resets, or troubleshooting
In simple terms, Availability asks:
“Was the machine ready and running when it was supposed to be?”
If not, lost production time reduces the score. Even if the machine runs perfectly once restarted, the lost time still hurts OEE because that production opportunity is gone.
For beginners, Availability is often the easiest factor to understand because downtime is visible. Everyone notices a machine that is not running.
Performance: How Fast the Machine Runs
Performance measures whether the machine runs at the expected speed while it is operating.
A machine may be available and running, but if it is producing more slowly than it should, Performance drops.
This compares:
Actual output
Expected output at the ideal run rate
Common causes of Performance loss include:
Minor stops: brief interruptions that happen often
Slow cycles: the machine keeps running but below standard speed
Small jams or misfeeds
Operator intervention that slows the process
Worn tooling or unstable settings
Performance asks:
“When the machine was running, did it run as fast as it should?”
This part is important because many lines look fine from a distance. The machine is moving, parts are coming out, and no one sees a major stoppage. But if the line is running just a little slower all shift, a lot of output is lost.
Quality: How Much Good Output You Produce
Quality measures how much of the total output is good output.
Not every part produced counts as value-added production. If a part is rejected, scrapped, or needs rework, it lowers the Quality score.
Quality separates:
Good parts: meet specification and can move forward
Rejects: fail quality requirements
Rework: parts that need correction before use or shipment
Quality asks:
“Out of everything produced, how much was actually good?”
This matters because a machine can run all shift with excellent Availability and Performance, but if too many parts are defective, total effectiveness still suffers.
Defects reduce OEE because making bad parts uses time, material, labor, and machine capacity without creating full value.
How OEE Is Calculated Step by Step
The basic formula is simple:
OEE = Availability × Performance × Quality
Each factor is calculated as a percentage, then multiplied together.
Here is the beginner-friendly breakdown:
Availability = Run Time / Planned Production Time
Performance = Actual Output Rate compared to Ideal Output Rate
Quality = Good Parts / Total Parts Produced
You can also think of OEE this way:
Availability tells you how much time was lost to stops
Performance tells you how much output was lost to slow running
Quality tells you how much output was lost to defects
A Simple Step-by-Step Example
Let’s say a machine is planned to run for 480 minutes in one shift.
Step 1: Calculate Availability
During the shift, the machine loses 60 minutes to downtime.
Planned Production Time = 480 minutes
Run Time = 420 minutes
Availability = 420 / 480 = 87.5%
Step 2: Calculate Performance
Suppose the machine should ideally make 1 part per minute.
In 420 minutes of run time, it should make 420 parts.
But it actually makes only 380 parts.
Performance = 380 / 420 = 90.5%
Step 3: Calculate Quality
Out of those 380 parts, 20 are rejected.
Good Parts = 360
Total Parts = 380
Quality = 360 / 380 = 94.7%
Step 4: Calculate OEE
Now multiply the three percentages:
Availability = 87.5%
Performance = 90.5%
Quality = 94.7%
OEE = 0.875 × 0.905 × 0.947 = 0.749
OEE = 74.9%
That means about 75% of the planned production time was truly effective.
What the Final Number Really Tells You
The OEE percentage alone is useful, but the real insight comes from the three parts behind it.
For example:
A low score caused by Availability points to downtime, changeovers, waiting, or breakdowns
A low score caused by Performance points to minor stops or slow running
A low score caused by Quality points to scrap, defects, or rework
That is why OEE should never be treated as just one single number. The score matters, but the losses behind the score matter more.
Simple Shop Floor Examples for Beginners
The best way to understand OEE is to see how it behaves in everyday production situations.
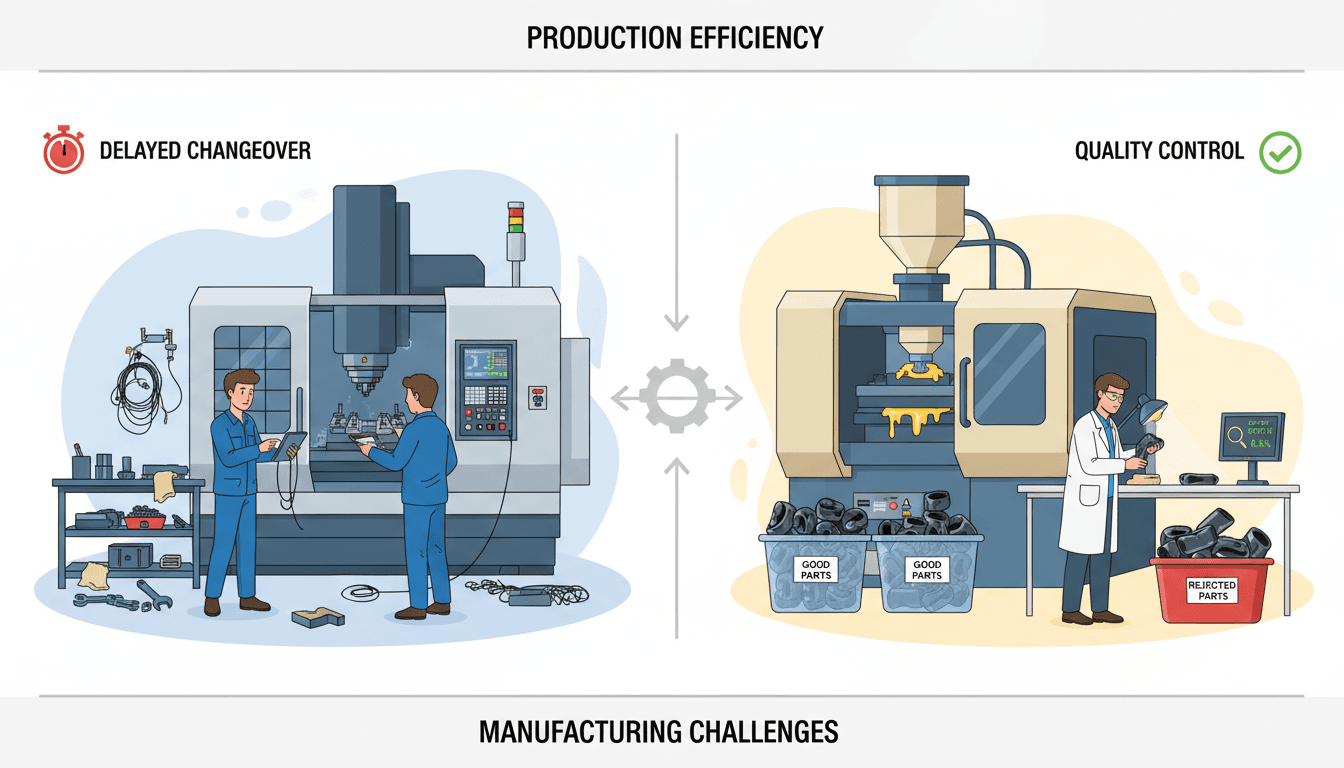
Example 1: A Packaging Line with Frequent Short Stops
Imagine a packaging line that rarely has major breakdowns. It starts on time, materials are available, and the team finishes the shift without long downtime. At first glance, everything seems fine.
But during the shift, the line keeps stopping for a few seconds here and there:
labels do not feed correctly
cartons shift slightly out of position
sensors need quick resets
operators clear small jams
None of these stops lasts very long. Because of that, the team may not feel they are a serious problem. But over the whole shift, those short interruptions add up.
In this case:
Availability may still look decent if the short stops are not counted as major downtime
Performance drops because the line is not maintaining its expected speed
Quality may remain strong if most packs are still good
This is a classic beginner example of performance loss. The equipment is technically running, but not at the expected pace.
What should operators and supervisors notice first?
repeated small interruptions
patterns by product, shift, or material type
whether the same stop reason happens over and over
whether the line speed is being reduced to avoid jams
The lesson is simple: a line can appear busy and still lose a lot of effectiveness through small stops and slow cycles.
Example 2: A CNC Machine with Changeover Delays
Now consider a CNC machine in a job shop or mixed-product environment. The machine itself cuts accurately and runs well once production starts. But every time a new part is scheduled, setup takes longer than expected.
The shift includes:
fixture changes
tool changes
offset checks
first-piece inspection delays
waiting for program confirmation
Here, the main issue is not speed or scrap. The problem is that the machine spends too much planned production time not producing.
In this scenario:
Availability drops because changeover time reduces actual run time
Performance may be good once cutting begins
Quality may also be good if parts meet specification
This is a clear example of availability loss.
What should the team look at?
how long setup actually takes versus the standard
whether tools and fixtures are prepared in advance
whether schedules create too many product changes
whether first-piece approval delays are avoidable
Better planning can improve the number significantly. If jobs are sequenced more logically, setup materials are prepared ahead of time, and standard changeover steps are followed, the machine spends more time producing parts and less time waiting.
For beginners, this example shows that OEE is not only about breakdowns. Even planned activities like changeovers can reduce equipment effectiveness if they consume too much production time.
Example 3: A Molding Process with Scrap Problems
Now look at a molding process that runs steadily with few stops. Cycle time is close to target, and the machine stays in operation most of the shift. Yet the OEE result is still disappointing.
Why? Too many molded parts are rejected due to:
flash
short shots
warping
dimensional variation
startup instability after adjustments
In this case:
Availability may be strong
Performance may also be acceptable
Quality falls because too much output becomes scrap or rework
This example highlights the quality side of OEE. The machine may be busy, and output may look high, but if too many parts are bad, total effectiveness declines.
What should teams focus on?
process stability
material consistency
mold condition
setup control
first-off verification and parameter discipline
The key lesson is that stable processes produce better output. When variation is reduced, Quality improves, and OEE rises even if the machine speed stays the same.
How to Use OEE Without Misunderstanding the Number
OEE is powerful, but it is also easy to misuse. Beginners often focus too much on the final percentage and not enough on the meaning behind it.
Common Beginner Mistakes
Treating OEE as a target by itself instead of a starting point for improvement
One common mistake is chasing a number without understanding the losses inside it.
If a team is told to “hit 85% OEE” without support or context, they may focus on the score instead of the process. That can lead to bad habits like inconsistent downtime coding, missed defect reporting, or pressure to protect the metric rather than improve the work.
A better approach is to treat OEE as a starting point for questions:
What is hurting us most?
Where are we losing the most time?
Which loss is easiest to reduce first?
Comparing very different machines or lines without context
Another mistake is comparing OEE across very different assets as if the same standard should apply everywhere.
A high-volume packaging line, a low-volume CNC machine, and a molding press do not behave the same way. Product mix, changeover frequency, cycle variation, automation level, and quality risk all affect the result.
OEE works best when used with context:
compare the same machine over time
compare similar assets doing similar work
compare shifts on the same line
compare results only after standard definitions are aligned
Ignoring data accuracy when tracking downtime, speed, or defects
OEE is only as useful as the data behind it.
If short stops are missed, if ideal cycle time is set incorrectly, or if rework is not counted properly, the number becomes misleading.
Common data problems include:
downtime reasons entered inconsistently
cycle standards that are outdated
scrap not recorded in real time
manual logs that miss minor stops
operators and supervisors using different definitions
Before trying to improve OEE, make sure the measurement method is clear and consistent.
Practical Ways to Start Improving
Start with one machine or line before expanding plant-wide
For beginners, the smartest move is to start small.
Pick one machine or one line where the team can learn the process, test definitions, and build trust in the numbers. A focused pilot is usually better than rolling out OEE across the whole plant too fast.
This helps teams answer practical questions like:
What counts as planned production time?
What counts as downtime?
How will short stops be tracked?
How will rework be counted?
Once the method works in one area, it is much easier to expand.
Track the biggest losses first rather than trying to fix everything at once
OEE often reveals many issues at the same time. That can feel overwhelming.
Instead of chasing every loss, focus on the biggest one first.
For example:
if downtime is the main problem, attack the top stop reasons
if speed loss is the main problem, study minor stops and reduced cycles
if quality is the main issue, investigate the highest scrap causes
Improvement becomes more manageable when teams prioritize.
Review trends regularly with operators, maintenance, and production leaders
OEE works best when it becomes part of regular team discussion.
Reviewing daily or weekly trends with the people closest to the process creates better understanding and faster action. Operators see what happened in real time. Maintenance sees recurring equipment problems. Production leaders can remove scheduling or staffing barriers.
Useful review habits include:
looking at trends, not just single-shift results
separating Availability, Performance, and Quality losses
checking the top recurring causes
assigning actions with owners and deadlines
following up to confirm whether improvements worked
When OEE is reviewed this way, it becomes a shared language for improvement rather than just a management report.
Key Takeaways for Understanding OEE
OEE is a simple but powerful way to measure how effectively equipment is used during planned production time. It helps answer a practical shop floor question:
How much of our scheduled production time was truly productive?
It does this by combining three factors:
Availability: was the machine running when it should have been?
Performance: did it run at the expected speed?
Quality: did it produce good parts?
Together, these factors show whether losses came from:
downtime
slow running
defects and rework
Just as important, OEE does not tell you everything by itself. It does not replace process knowledge, operator experience, or root cause analysis. It is a guide, not the full answer.
For beginners, the best way to learn OEE is through simple examples on the shop floor. Start with one machine, understand the three parts, and use the numbers to spot the biggest losses first. As your team becomes more confident, OEE can grow from a basic metric into a practical tool for everyday manufacturing improvement.
FAQs
OEE stands for Overall Equipment Effectiveness. It measures how much planned production time is truly productive by combining availability, performance, and quality into one percentage.
First calculate Availability, Performance, and Quality as separate percentages. Then multiply those three values together to get the OEE score.
Low OEE usually comes from downtime, slow running, or defective parts. Common causes include breakdowns, changeovers, minor stops, reduced speed, scrap, and rework.
A good OEE score depends on the process, equipment, and maturity of the operation. Many teams use OEE mainly as a baseline to track improvement over time rather than chasing a single universal target.
OEE gives beginners a simple way to see where production time and output are being lost. It helps teams move beyond guesswork and focus on the biggest problems affecting equipment performance.
Product Trial
FineReport
Pixel-perfect reports · Interactive dashboards · Easy data entry · Digital twins