A daily report template in Excel is one of the fastest ways to track team progress, surface issues, and keep stakeholders aligned — without needing specialized software. Whether you manage sales, operations, customer service, or production, a well-structured Excel template gives you a repeatable format that anyone on the team can fill out in minutes.
This guide walks you through a free copy-ready template, the key fields to include, useful formulas, real-world examples by team, and the point at which manual Excel reporting becomes a bottleneck worth automating.
Free Daily Report Template Excel Format
You can copy this table directly into Excel and customize the columns for sales, operations, construction, finance, or customer service daily reports.
| Date | Team / Department | Task / Activity | Owner | Status | Target | Actual | Variance | Notes / Blockers |
|---|---|---|---|---|---|---|---|---|
| 2026-07-01 | Sales | Follow up with top 5 leads | J. Lee | Completed | 5 calls | 5 calls | 0 | Closed 2 deals |
| 2026-07-01 | Operations | Warehouse inventory count | M. Chen | In Progress | 100% | 78% | -22% | Delayed by shipment arrival |
| 2026-07-01 | Customer Service | Resolve open tickets | A. Patel | Not Started | 20 tickets | 0 | -20 | Waiting for product update |
To use this template:
- Copy the table above into cell A1 of a new Excel worksheet.
- Adjust column headers to match your team's metrics (e.g., replace "Target / Actual" with "Budget / Spend" for finance).
- Apply conditional formatting to the Status column: green for Completed, yellow for In Progress, red for Not Started.
- Save as
Daily_Report_Template.xlsxand share with your team.
This format works as a daily work report template, daily activity report template, or daily operations report — the structure stays consistent; only the metrics change.
What to Include in a Daily Report Template
The right fields depend on your team, but every effective daily report template in Excel should answer four questions: What happened? Who did it? How does it compare to target? What needs attention?
Core Fields
| Field | Purpose | Example Values |
|---|---|---|
| Date | Anchors each entry to a specific day | 2026-07-01 |
| Team / Department | Groups activities by function | Sales, Operations, Finance |
| Task / Activity | Describes what was done or planned | "Process refund requests" |
| Owner | Assigns accountability | Name or role |
| Status | Shows progress at a glance | Completed, In Progress, Not Started, Blocked |
| Target | Sets the expected outcome | 50 units, $10,000, 100% |
| Actual | Records what was achieved | 42 units, $8,700, 78% |
| Variance | Highlights gaps automatically (formula-driven) | -8 units, -$1,300, -22% |
| Notes / Blockers | Captures context, risks, dependencies | "Waiting for vendor confirmation" |
Optional Fields by Team
| Team | Additional Fields |
|---|---|
| Sales | Lead source, deal stage, revenue booked, pipeline value |
| Operations / Production | Units produced, defect rate, downtime hours, safety incidents |
| Customer Service | Tickets opened, tickets resolved, average resolution time, CSAT score |
| Finance | Budget line item, spend category, approval status, invoice number |
| Construction / Field Work | Weather conditions, equipment usage, labor hours, site photos |
Start with the core fields. Add optional fields only when they directly support a decision someone needs to make that day. Overloaded templates get abandoned.
How to Create a Daily Report Template in Excel
Step 1: Set Up Headers and Data Validation
Open a new workbook and enter your column headers in row 1. Make them bold and apply a background color so they stand out from data rows.
Add data validation to the Status column to enforce consistency:
- Select the Status data range (e.g., E2:E100).
- Go to Data > Data Validation.
- Under Allow, choose List.
- Enter:
Completed, In Progress, Not Started, Blocked. - Click OK.
This creates a dropdown menu that prevents typos and makes filtering reliable.
Step 2: Convert to an Excel Table
Select your entire data range (including headers), then go to Insert > Table. Check "My table has headers" and click OK.
Excel Tables give you automatic filtering, structured references for formulas, and alternating row colors for readability. New rows added below the table are automatically included in all formulas and formatting.
Step 3: Apply Conditional Formatting
Visual cues make daily reports scannable. Apply conditional formatting to key columns:
- Status: Green fill for "Completed," yellow for "In Progress," red for "Not Started," gray for "Blocked."
- Variance: Red font for negative values, green for positive or zero.
- Date: Highlight today's date to distinguish current entries from historical ones.
Go to Home > Conditional Formatting > New Rule for each condition. Use "Format only cells that contain" for text matches and "Use a formula" for numeric thresholds.
Step 4: Protect the Template Structure
To prevent accidental header deletion or formula overwrites:
- Select all data entry cells and unlock them (Format Cells > Protection > uncheck Locked).
- Go to Review > Protect Sheet and set a password.
- Users can now edit data cells but cannot modify headers, formulas, or formatting.
This step is especially important when multiple people share the same daily report template Excel file.
Useful Excel Formulas for Daily Reports
Formulas turn raw entries into actionable insights. These are the most practical formulas for a daily report template in Excel:
| Formula | Purpose | Example |
|---|---|---|
=SUMIF(range, criteria, sum_range) | Total actuals for a specific team or status | =SUMIF(B:B,"Sales",G:G) → total actuals for Sales |
=COUNTIF(range, criteria) | Count tasks by status | =COUNTIF(E:E,"Completed") → number of completed tasks |
=G2-F2 | Calculate variance between actual and target | Returns -8 if target is 50 and actual is 42 |
=IF(G2<F2,"Below Target","On Track") | Auto-label performance | Displays "Below Target" when actual < target |
=TODAY() | Insert current date dynamically | Updates each time the file opens |
=TEXT(A2,"dddd") | Show day of week from date | Returns "Wednesday" from 2026-07-01 |
=AVERAGEIFS(sum_range, criteria_range, criteria) | Average actuals by team | =AVERAGEIFS(G:G,B:B,"Operations") |
=IFERROR(formula, "") | Prevent error messages in blank rows | Wraps any formula to return blank instead of #DIV/0! |
Tip: Build a summary section above or beside your data table using these formulas. A small dashboard area showing "Tasks Completed Today," "Total Variance," and "Blockers Count" gives managers a one-glance overview without scrolling through rows.
Daily Report Examples by Team
The same template structure adapts to different functions by swapping metrics. Here are three ready-to-use variations:
Daily Sales Report Template
| Date | Rep | Leads Contacted | Meetings Booked | Deals Closed | Revenue | Pipeline Added | Notes |
|---|---|---|---|---|---|---|---|
| 2026-07-01 | J. Lee | 12 | 3 | 2 | $24,500 | $85,000 | Enterprise prospect moved to negotiation |
Key metrics: conversion rates (leads → meetings → deals), revenue vs. daily target, pipeline velocity.
Daily Operations / Production Report Template
| Date | Line | Units Planned | Units Produced | Defect Rate | Downtime (hrs) | Safety Incidents | Notes |
|---|---|---|---|---|---|---|---|
| 2026-07-01 | Line A | 5,000 | 4,780 | 1.2% | 0.5 | 0 | Motor bearing replaced during break |
Key metrics: plan attainment %, defect trend, unplanned downtime, safety compliance.
Daily Customer Service Report Template
| Date | Agent | Tickets Opened | Tickets Resolved | Avg Resolution Time | CSAT Score | Escalations | Notes |
|---|---|---|---|---|---|---|---|
| 2026-07-01 | A. Patel | 25 | 22 | 2.4 hrs | 4.6 | 1 | Product bug caused spike in billing tickets |
Key metrics: resolution rate, SLA adherence, satisfaction trend, escalation volume.
Each example uses the same structural logic: date, owner, target, actual, variance, notes. Customize the metric columns; keep the framework consistent.
Limitations of Excel Daily Report Templates
Excel is an excellent starting point, but manual daily reporting hits predictable ceilings as teams grow:
| Limitation | Impact |
|---|---|
| Manual data entry | Team members spend 15–30 minutes per day copying data from other systems into the spreadsheet |
| Version conflicts | Multiple users editing shared files leads to overwritten entries, lost updates, and "which version is latest?" confusion |
| No real-time data connection | Reports reflect what someone typed, not what actually happened in your CRM, ERP, or database |
| Limited access control | Anyone with the file can see all data; row-level or role-based permissions are not natively supported |
| Distribution overhead | Emailing daily reports or uploading to shared drives is repetitive and error-prone |
| No audit trail | Changes are not logged; you cannot trace who modified what and when |
| Scaling breaks down | Templates that work for 5 people become unmanageable at 50+ contributors across departments |
These limitations do not mean Excel is wrong for daily reports. They mean there is a threshold — typically when reporting involves multiple data sources, multiple contributors, or daily distribution to management — where automation delivers measurable time savings and data quality improvements.
When to Upgrade from Excel to FineReport
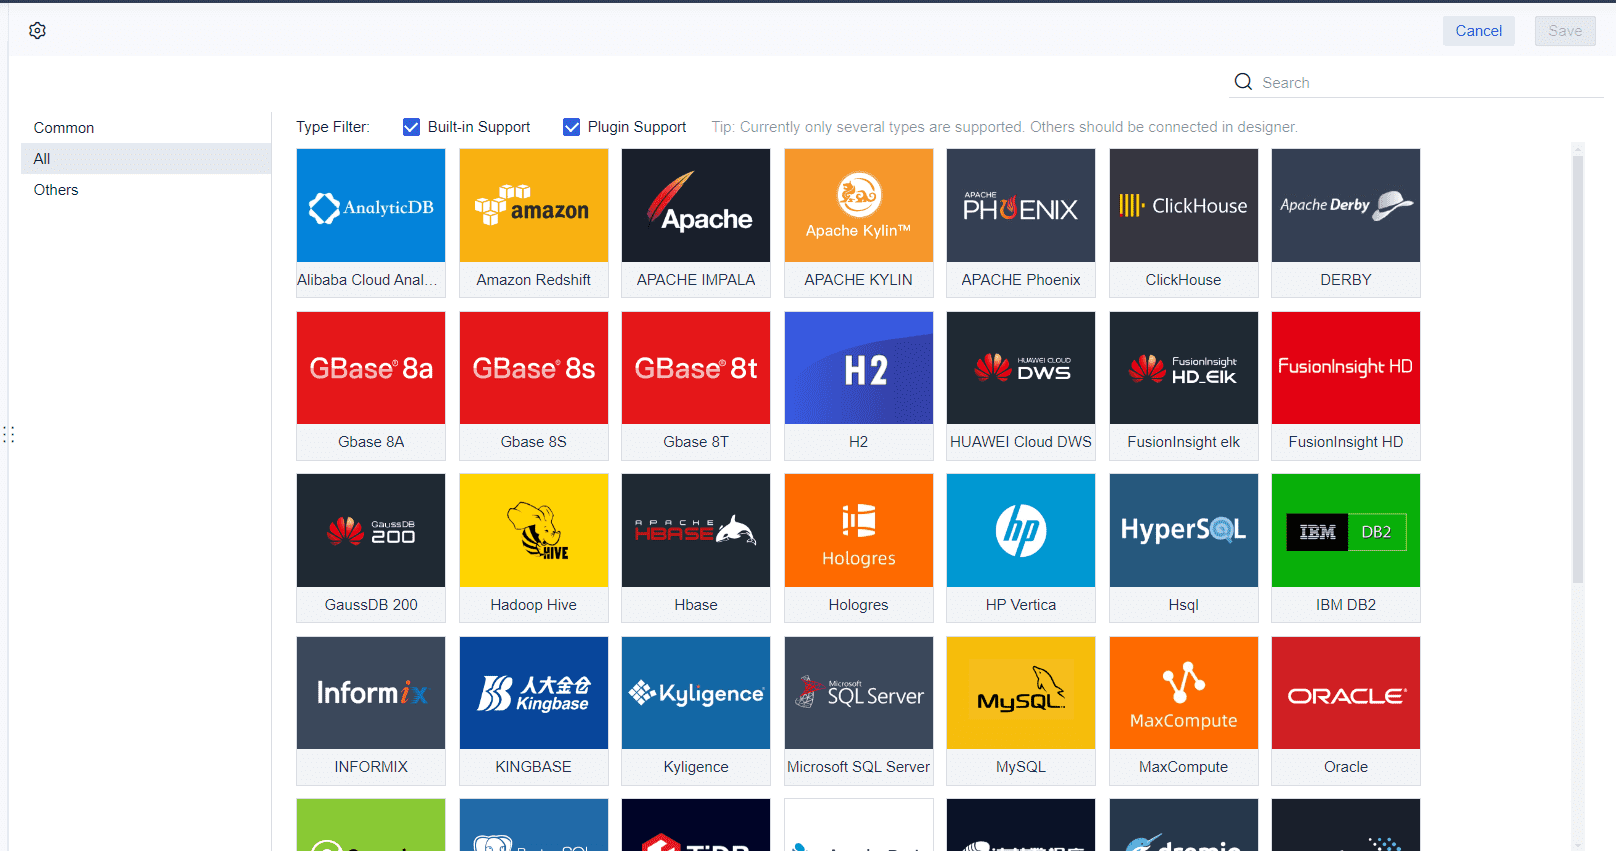
Excel is a good starting point for simple daily reports. But as reporting becomes more frequent, manual updates can create delays, version conflicts, and data quality problems. FineReport helps teams build automated daily reports, connect reports to business data sources, schedule report generation, control permissions, and share reports across desktop and mobile devices.
This makes FineReport more suitable for daily sales reports, production reports, financial reports, operation reports, and management dashboards that need to be updated and distributed regularly.
Excel vs. FineReport for Daily Reporting
| Capability | Excel Daily Report | FineReport Automated Report |
|---|---|---|
| Data source | Manual entry or copy-paste | Direct connection to databases, APIs, ERP, CRM |
| Update frequency | Manual, once per day (or less) | Scheduled auto-refresh, real-time or near-real-time |
| Distribution | Email attachment or shared drive | Auto-push via email, portal, mobile app, webhook |
| Access control | File-level sharing only | Role-based permissions, row-level data security |
| Multi-user collaboration | Version conflicts common | Centralized server, concurrent access, audit trail |
| Mobile access | Limited (file viewer apps) | Native mobile app with responsive report layouts |
| Template reuse | Copy and rename files | Parameterized templates, reusable components |
| Setup effort | Minutes | Hours (initial setup), then near-zero ongoing maintenance |
 FineReport's Data Connection
If your team currently spends significant time each day collecting, consolidating, and distributing daily reports — or if leadership frequently asks "is this the latest version?" — that is a strong signal to evaluate FineReport.
How Dora Can Turn Daily Reports into AI Briefings
After daily reports are standardized and automated, Dora can help business users read and act on them faster. Dora can summarize key changes, highlight anomalies, answer follow-up questions in natural language, and push daily or weekly briefings to the right people.
For example, instead of opening a 40-row daily operations report and scanning for issues, a manager can ask Dora: "What were the top 3 production line deviations yesterday?" or "Summarize this week's customer service trends compared to last week." Dora reads the governed report data and returns a concise, sourced answer — turning passive reporting into active insight delivery.
 Ask Dora in Natural Language
Dora works on top of FineReport and FineBI assets, so it inherits the same data governance and permission controls. Business users get AI-powered analysis without accessing raw data or bypassing security policies.
Frequently asked questions
The most effective format uses a consistent structure: date, team/owner, task/activity, status, target, actual, variance, and notes. Convert your data range to an Excel Table for automatic filtering and structured formulas. Keep the template focused — include only fields that directly support a daily decision.