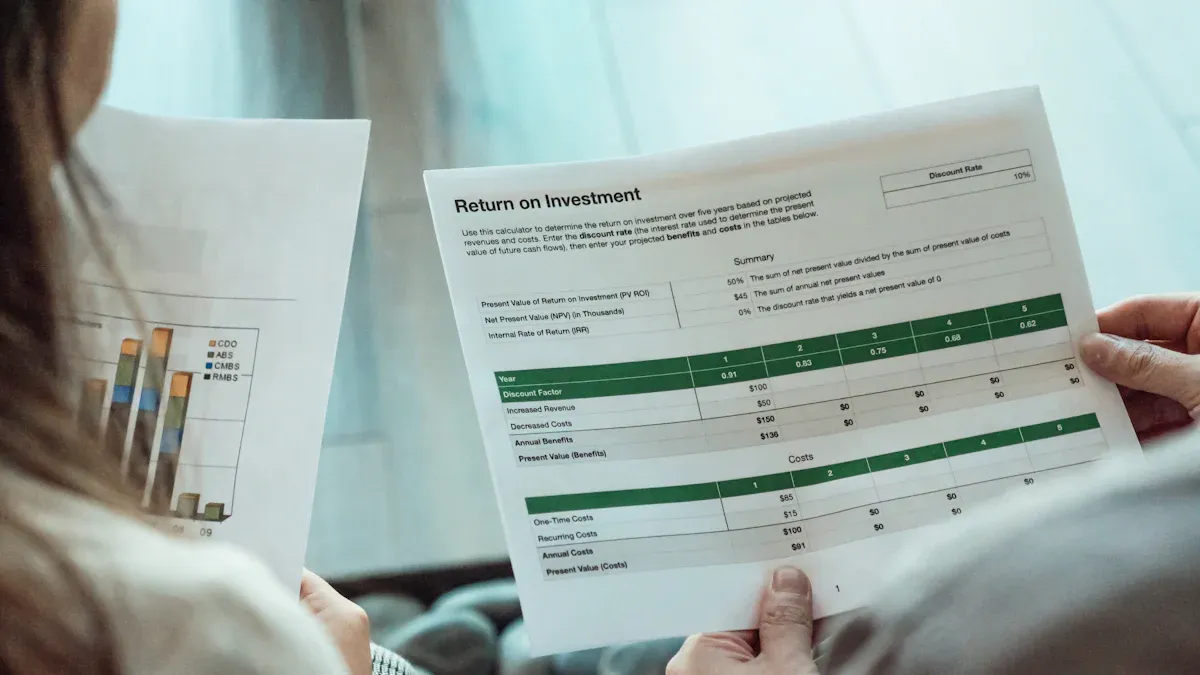
You want to make smarter choices with your investments. Analyst reports give you expert opinions and data on stocks, helping you understand market trends and company performance. Investment research from these reports helps you compare opportunities and reduce risk. Analyst reports matter because they provide insights that guide your decisions when investing.
Quick access to reliable analyst reports can improve your investment research and help you navigate the world of stocks with confidence.
Top Platforms and Databases for Analyst Reports
When you want to make informed investing decisions, you need access to reliable analyst reports. Several leading research platforms offer comprehensive analyst research reports, equity research reports, and other research reports that help you evaluate stocks and funds. Here are three of the most trusted stock research tools you can use.
Bloomberg
Bloomberg stands out as a global leader in financial data and analytics. You can use Bloomberg Terminal to access a vast library of analyst reports, market news, and real-time data. The platform covers equities, fixed income, commodities, and more. You get access to in-depth company profiles, financial statements, and analyst recommendations. Bloomberg’s interface allows you to search by ticker, sector, or region, making it easy to find the information you need.
Bloomberg also provides advanced charting tools and customizable dashboards. These features help you visualize trends and compare companies side by side. Many professional investors rely on Bloomberg for its speed, accuracy, and breadth of coverage. If you want to stay ahead in the market, Bloomberg gives you the tools to analyze data and make smarter choices.
S&P Capital IQ
S&P Capital IQ is a powerful research platform that offers extensive coverage of public and private companies. You can access detailed analyst research reports, financial models, and market data across all major sectors. The platform’s database includes key metrics such as market capitalization, revenue, EBITDA, and recent transactions. Here is a snapshot of the company and industry coverage you can expect:
You benefit from several advantages when using S&P Capital IQ:
The platform saves you time by streamlining your research process.
You can use the Excel plugin to pull data directly into your spreadsheets.
Modern presentation tools let you create up-to-date charts and graphs.
You get global coverage, including both public and private companies.
The platform is widely recognized and trusted in the industry.
You have access to comprehensive equity research reports for better decision-making.
S&P Capital IQ is heavily used for financial modeling and economic forecasts.
You can also find information on portfolio management, risk analytics, and credit analytics. The Excel plug-in boosts your productivity by letting you work with data in your preferred format. S&P Capital IQ is a top choice for professionals who need reliable and actionable insights.
Morningstar
Morningstar is well known for its independent research and ratings. You can use Morningstar to access research reports on stocks, mutual funds, and ETFs. The platform covers over 600,000 investment products, making it one of the most comprehensive sources for morningstar equity research. Over the years, Morningstar has expanded its managed investments written coverage from 4,000 to 40,000, a tenfold increase. This growth means you get both depth and breadth in your analysis.
Coverage Aspect
Morningstar Coverage
Total Investment Products Covered
Over 600,000
Managed Investments Written Coverage
Expanded from 4,000 to 40,000
Increase in Coverage
10x increase
Morningstar combines machine learning with human insight to deliver accurate ratings and recommendations. You can find detailed reports on the most frequently analyzed investment products:
Investment Product Type
Popularity Rank
Equity Manager Analysis Report
1
Holdings Comparison
2
Investment Detail Report
3
Morningstar’s tools help you compare holdings, analyze performance, and understand risk. You can use the platform to track your portfolio and receive alerts on changes that may affect your investments. Morningstar’s reputation for unbiased analysis makes it a trusted resource for both new and experienced investors.
LSEG Workspace
You can use LSEG Workspace as a powerful research platform for accessing analyst reports and research reports. The platform offers a wide array of tools and resources designed for analysts and portfolio managers. You gain access to extensive financial data, analytics, and exclusive news. These features help you make informed decisions when investing in global markets.
LSEG Workspace stands out because it integrates analyst reports with other financial data tools. You can work more efficiently by using its seamless interoperability with Microsoft applications. The platform uses OpenFin technology, which makes deployment and integration with desktop ecosystems easy. You can also use the Excel add-in to visualize and analyze data directly in Excel. This workflow enhancement lets you transition smoothly between Excel and Workspace content.
Tip: LSEG Workspace helps you combine the strengths of Excel and its own platform, making your research process faster and more flexible.
Here is a table that shows how LSEG Workspace integrates with other financial tools:
Feature
Description
Seamless Interoperability
Integrates with Microsoft applications like Teams and Excel, enhancing user experience.
OpenFin Technology
Powers the Workspace container for easy deployment and integration with native desktop ecosystems.
Excel Add-in
Simplifies access to LSEG data, allowing users to visualize and analyze data directly in Excel.
Workflow Enhancement
Users can transition from Excel to Workspace content, combining strengths of both platforms.
You can rely on LSEG Workspace for comprehensive coverage and efficient workflows. This research platform supports your need for timely and accurate analyst reports.
FactSet
FactSet is a leading research platform that gives you access to analyst reports for over 40,000 companies each year. You can find transcripts for about 10,000 companies, organized into various sectors. This broad coverage helps you analyze different industries and make better investing decisions.
FactSet covers over 40,000 companies each year.
It offers transcripts for approximately 10,000 companies.
The companies are categorized into various sectors.
FactSet makes searching and filtering analyst reports easy. You can use conversational search to input terms and receive consolidated results. The Draft Assistant helps you compile relevant research based on themes and identifiers. The Topic Assistant automatically tags research topics, improving searchability and standardizing findings. Theme Intelligence displays trending themes and insights from research, helping you spot opportunities.
Conversational search: Input search terms and get consolidated results.
Topic Assistant: Automatically tag research topics.
Theme Intelligence: See trending themes and insights.
You can follow these steps to customize and download your research reports:
Select criteria in the criteria pane.
View results in the results pane.
Customize reports by selecting data items.
Download or print results.
You can also start a new search from scratch using the Starter Screen or choose a pre-built report from the category Home page. FactSet gives you options to customize your reports, making it a flexible tool for your research needs.
Fidelity
Fidelity offers a reliable research platform for accessing analyst reports and research reports. You can find company research highlights reports that update frequently. Fidelity updates these reports once each business day and once over the weekend. This fast update speed ensures you always have the latest information for your investing decisions.
Report Type
Update Frequency
Company Research Highlights Report
Once each business day and once over the weekend
You can use Fidelity to track changes in company performance and market trends. The platform helps you stay informed and react quickly to new developments. Fidelity’s frequent updates make it a valuable resource for investors who want timely analyst reports.
PitchBook
PitchBook serves as a leading research platform for private market data. You can use PitchBook to access a wide range of analyst research reports that focus on private equity, venture capital, and other alternative investments. This platform provides you with deep insights into market trends, fund performance, and deal activity. When you explore PitchBook, you find research reports that cover many areas:
Private Equity and M&A Research
Venture Capital Research
Quantitative Research
Fundraising & Asset Allocations Research
Fund Performance Benchmarks
Leveraged Loans Research
Private Credit Research
Bonds Research
CLOs Research
Distressed Debt Research
PitchBook supports your investing decisions by offering detailed analysis and data. You can track where capital flows, analyze fund performance, and study market dynamics. The platform helps you understand how limited partners (LPs) commit capital and how deal multiples and valuations change over time. You also gain access to custom benchmarks and in-depth fund data.
Feature
Description
Investment Trends
Provides insights into where capital is being committed by LPs and tracks evolving trends in deal multiples, liquidity, and valuations.
Fund Performance
Offers in-depth fund data including IRR, cash flow multiples, and investments to create custom benchmarks for precise value illustration.
Market Analysis
Delivers detailed insights into a fund manager’s investment style, historical preferences, and potential style drift over time.
PitchBook gives you the tools to compare fund managers, evaluate investment opportunities, and monitor private market activity. You can use these research reports to make informed decisions and stay ahead in the competitive world of private market investing.
Hoovers
Hoovers stands out as a comprehensive research platform for company and industry analysis. You can use Hoovers to access a broad range of analyst reports, market research, and industry summaries. The platform covers thousands of companies and industries, giving you the information you need for competitive analysis and strategic planning.
Coverage Category
Details
Analyze Markets
Market Research Reports, Analysts’ Reports
Research Industries
Industry summary, News items, Peer Analysis, Industry activities, Analysts Reports, Market Research Reports, RMA Industry Norms
You can use Hoovers to analyze markets, study industry trends, and compare companies. The platform provides several types of reports that help you understand both the big picture and the details:
Type of Report
Purpose
Company Profiles
Provides detailed information about the company and its operations.
Industry Reports
Helps users understand market dynamics and trends.
Financial Information
Offers insights into the company's financial health and performance.
Analyst Reports
Delivers in-depth analysis from brokerage firms for competitive insights.
Analyst reports on Hoovers often come from reputable brokerage firms such as JP Morgan and Oppenheimer. These reports focus on factual analysis and help you identify competitive advantages. You can use Hoovers to benchmark companies, assess industry risks, and support your investing strategies with reliable data.
FineReport for Investment Analysts' Reports
FineReport offers a powerful solution for investment analysts who need to generate, visualize, and share research reports efficiently. You can use FineReportto create complex reports without coding, thanks to its visual report designer and Excel-like interface. The platform integrates seamlessly with SQL databases, Excel files, and cloud services, making it easy to gather and analyze data from multiple sources.
Feature
Description
Visual Report Designer
Drag-and-drop interface for creating complex reports without coding.
Dynamic dashboards with filters, drill-downs, and real-time updates.
Mobile Compatibility
Fully responsive reports and dashboards for mobile access.
Customizable Templates
Variety of pre-designed templates that can be customized.
Advanced Charting Options
Wide range of chart types for detailed data visualization.
Scheduled Reporting
Automates report generation and distribution at specified intervals.
Role-Based Access Control
Granular control over report access and editing.
Multi-Language Support
Supports multiple languages for global enterprises.
Data Entry Forms
Creation of forms for data collection and entry.
Excel-Like Interface
Mimics Excel functionalities for easier transition.
Real-Time Data Processing
Handles real-time data streams for up-to-date reporting.
API Integration
Robust APIs for integration with other enterprise systems.
Version Control
Tracks changes and maintains version history of reports.
Custom Scripting
Supports custom scripts for advanced data manipulation.
Embedded Analytics
Allows embedding of reports and dashboards into other applications.
Collaboration Tools
Features for sharing and commenting on reports.
Data Security Measures
Implements encryption and security protocols for sensitive information.
Scalability
Designed to handle large volumes of data and users.
Comprehensive Support
Extensive documentation, tutorials, and customer support available.
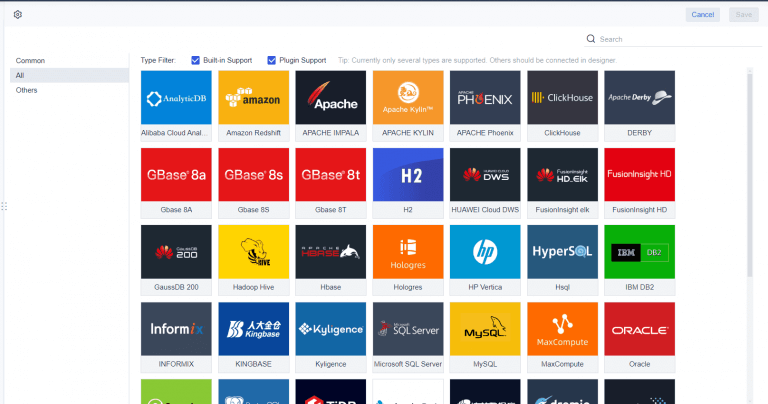
FineReport supports all mainstream databases and connects to different business systems. You can use over 60 types of HTML5 charts and dynamic effects to visualize your data. The drag-and-drop interface lets you combine data from multiple sources quickly. FineReportalso allows you to extract, write, and update data in your databases through reports.
You can automate scheduled reporting, control access based on user roles, and collaborate with your team using built-in tools. FineReport helps you create research reports that are visually appealing, interactive, and accessible on any device. This makes it an ideal research platform for investment analysts who want to streamline their workflow and enhance their investing decisions.
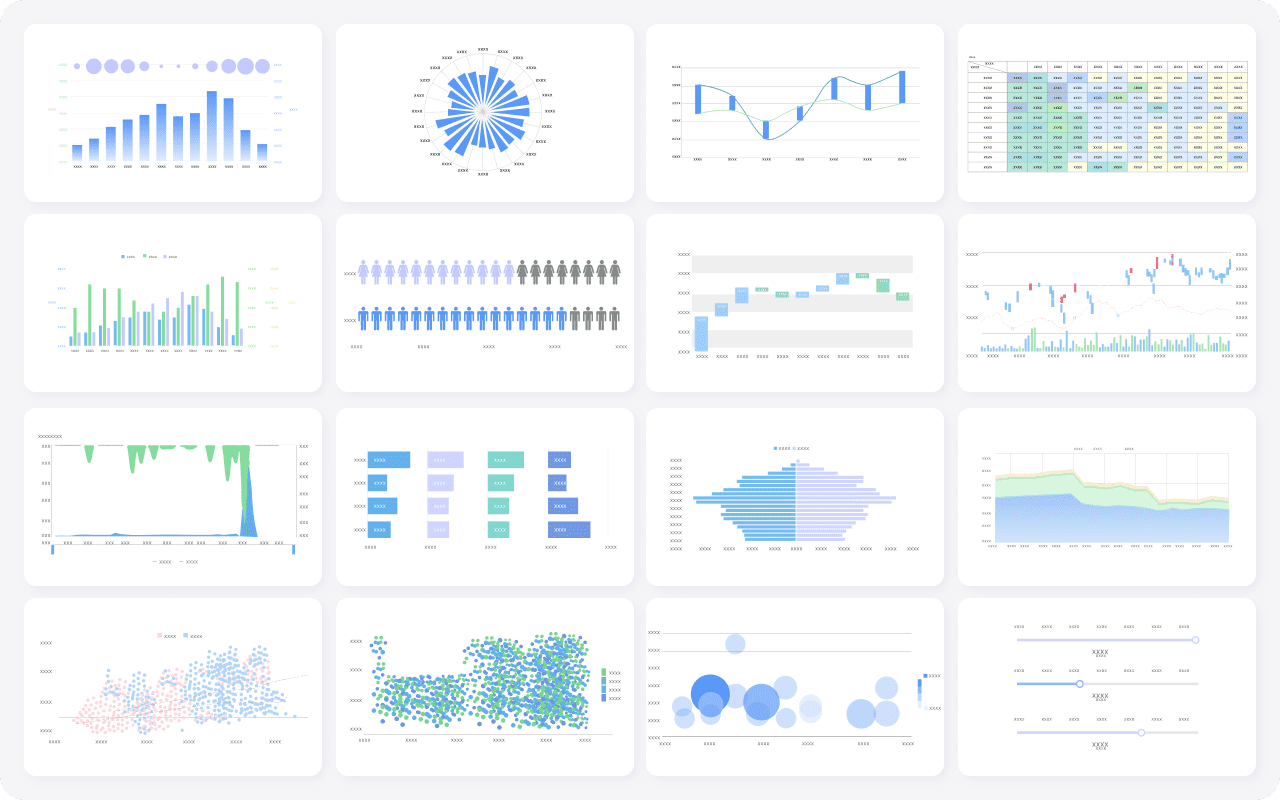
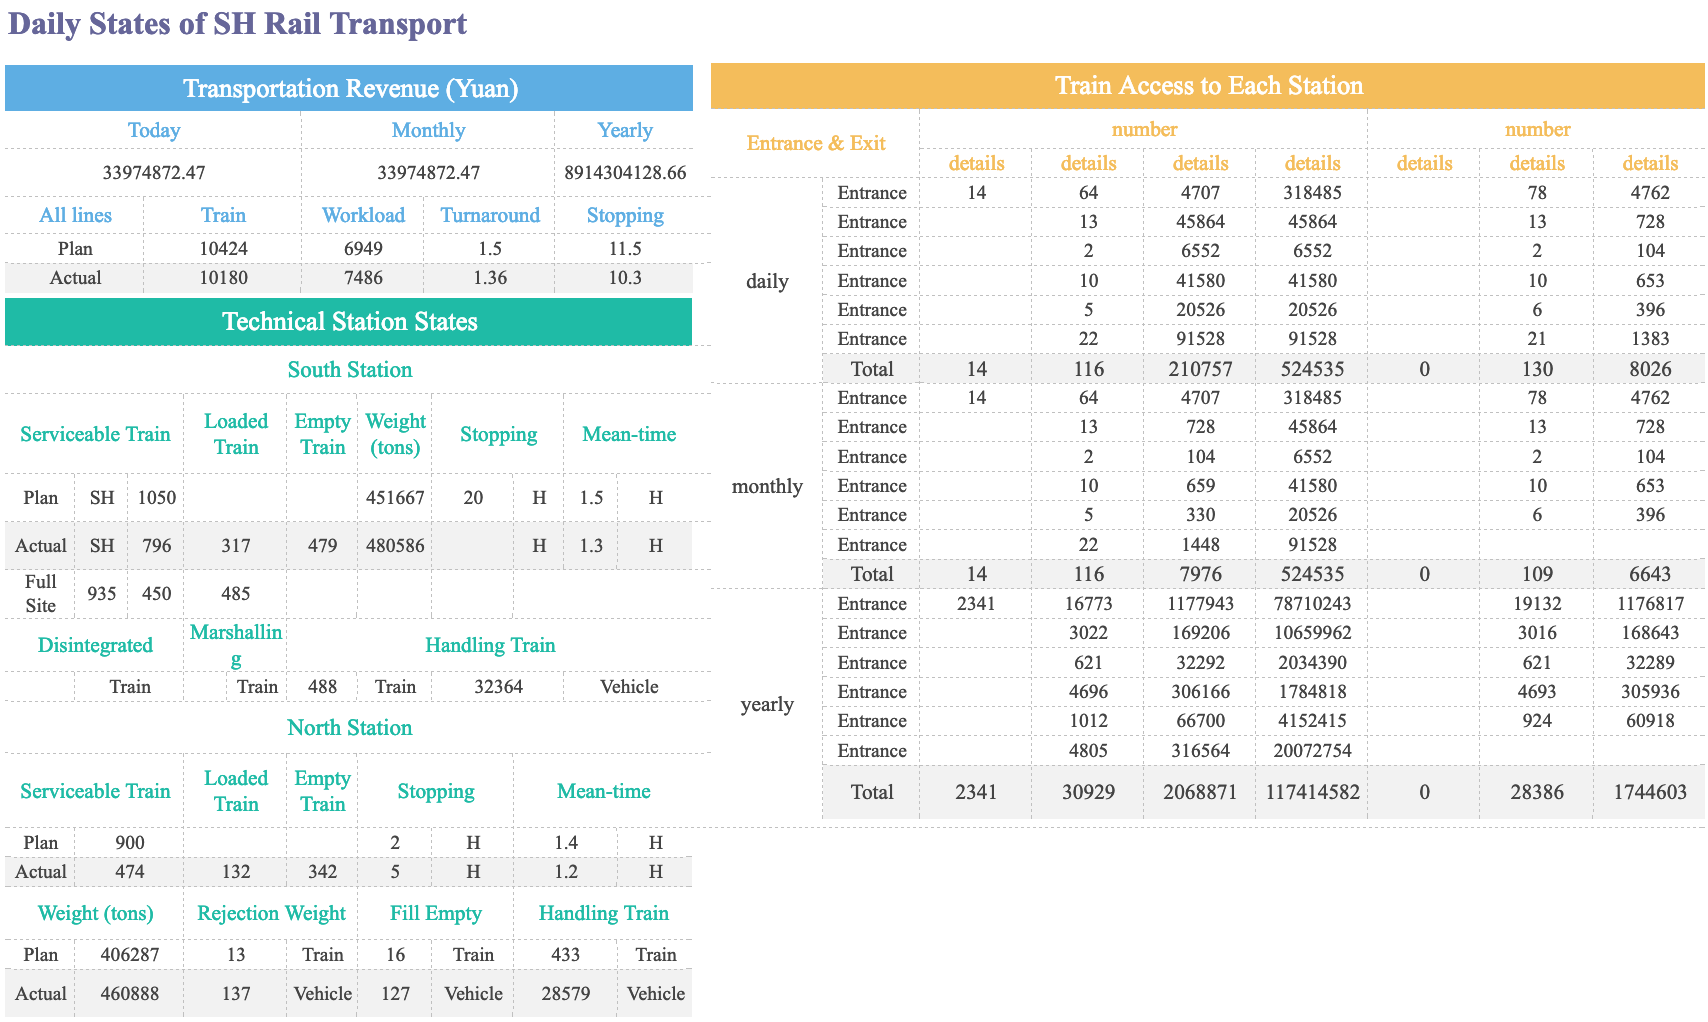
FineReport's Multiple Charts For Data Visualization
When you search for analyst reports, you will find several additional platforms that stand out in the financial industry. These platforms offer unique features and broad coverage, making them valuable tools for your research process. Many investors and professionals rely on these resources to gather insights and make informed decisions.
Thomson Reuters (Refinitiv Eikon) Refinitiv Eikon, formerly known as Thomson Reuters Eikon, is a leading research platform for financial professionals. You can access a wide range of analyst reports, real-time market data, and news. Eikon provides advanced analytics and visualization tools, helping you track market movements and company performance. The platform supports deep dives into equities, fixed income, commodities, and foreign exchange. You can customize dashboards and set alerts for specific events or price changes. Eikon also integrates with Microsoft Excel, allowing you to analyze data efficiently. Many users appreciate its global coverage and the ability to compare multiple companies or sectors at once.
Yahoo Finance Yahoo Finance is a popular choice for both new and experienced investors. You can access a variety of analyst reports, earnings summaries, and financial statements. The platform offers free tools for tracking stocks, building watchlists, and viewing historical data. Yahoo Finance aggregates analyst ratings and price targets from different sources, giving you a quick overview of market sentiment. You can also read news articles and expert commentary to stay updated on trends. The platform’s user-friendly interface makes it easy to search for companies by ticker or name. Many people use Yahoo Finance as a starting point for their investing research.
YCharts YCharts is another research platform that provides access to analyst reports, financial metrics, and visualization tools. You can compare stocks, ETFs, and mutual funds using interactive charts and tables. YCharts helps you analyze trends, screen for investment opportunities, and monitor portfolio performance. The platform offers customizable dashboards and data exports, making it suitable for both individual investors and professionals. YCharts stands out for its clean design and powerful analytics, which help you make sense of complex financial data.
Note: Many professionals use a combination of platforms to get a complete view of the market. Each research platform offers different strengths, so you may want to explore several options to find the best fit for your investing needs.
Here is a quick overview of the most frequently used platforms for accessing analyst reports:
Bloomberg Terminal
Refinitiv Eikon
FactSet
S&P Capital IQ
Morningstar Inc.
YCharts
You can use these platforms to gather analyst opinions, compare company fundamentals, and track market developments. Each one supports your research process in a different way. When you combine insights from multiple sources, you improve your ability to make smart investing decisions.
How to Access and Navigate Investment Bank Research For Analyst Reports
Accessing investment bank research can help you make smarter investing decisions. You need to know how to set up your account, find the right section, and download the investment bank reports you need. Here’s how you can get started.
Creating Accounts and Logging In
Most platforms require you to create an account before you can view investment bank research. You usually need to provide your email, set a password, and sometimes verify your identity. Some platforms, like AlphaSense, may ask for your professional details if you want access to premium research. After registration, log in with your credentials. Many platforms offer two-factor authentication for extra security. Always keep your login information safe.
Locating the Research or Reports Section
Once you log in, you need to find the section where investment bank reports are stored. Look for tabs labeled “Research,” “Reports,” or “Analysis.” Some platforms place these sections in the main navigation bar, while others use a sidebar. You may also see a search bar at the top of the page. Use this to search for specific companies, sectors, or report types. Understanding the types of reports available will help you navigate more efficiently.
Tip: Use search features and AI tools to quickly find the reports you need. This saves time and helps you avoid information overload.
Step-by-Step Guide to Downloading Analyst Reports
Follow these steps to download analyst reports:
Search for the company or topic using the platform’s search bar.
Filter results by report type, date, or analyst.
Select the report you want to view.
Look for a download or export button, often marked as “PDF” or “Download.”
Save the report to your device for future reference.
You may face some challenges, such as too much data, difficulty finding reliable sources, or the influence of advertising. Stay focused on your research goals and rely on trusted platforms. Avoid making decisions based only on common beliefs or assumptions. Careful research leads to better investing outcomes.
Understanding Access Levels (Free vs. Paid)
When you search for analyst reports, you will notice that platforms offer different access levels. Some reports are available for free, while others require a paid subscription. Understanding these access levels helps you make smarter investment choices and manage your research budget.
Free Access to Analyst Reports
Many platforms provide basic analyst reports at no cost. You can find free summaries, ratings, and highlights on sites like Yahoo Finance or Morningstar. These free reports often include:
Company overviews
Analyst ratings (buy, hold, sell)
Price targets
Key financial ratios
Free analyst reports give you a quick snapshot of a company or market. You can use them to start your research or compare several companies. However, free access usually comes with limitations. You may not get detailed analysis, historical data, or advanced charting tools.
Paid Access to Analyst Reports
Paid subscriptions unlock more comprehensive analyst reports. Platforms like Bloomberg, S&P Capital IQ, and FactSet offer in-depth research, including:
Full financial statements
Detailed industry analysis
Proprietary models and forecasts
Access to historical and real-time data
Customizable dashboards and export options
You gain deeper insights and more data for your investment decisions. Paid access often includes tools for filtering, sorting, and visualizing information. You can also download reports in various formats for further analysis.
Access Level
Features Included
Best For
Free
Basic summaries, ratings, limited data
Beginners, quick research
Paid
Full reports, advanced tools, all data
Professionals, deep dives
Note: Some platforms offer a mix of free and paid analyst reports. You can start with free resources and upgrade as your needs grow.
FineReportstands out as a flexible solution for managing both free and paid analyst reports. You can integrate data from multiple sources, visualize trends, and automate report distribution. FineReport helps you maximize the value of your research, whether you use free summaries or premium reports. This approach supports smarter investment choices and efficient research workflows.
When yousearch for analyst reports, you want to find information that matches your investing goals. Most platforms offer tools that help you narrow down results and focus on what matters. You can use tickers, company names, industry filters, and geographic sorting to make your research more effective. These methods save you time and help you discover insights that support smarter decisions.
Using Tickers and Company Names
You can start your search by entering a company’s ticker symbol or full name. Ticker symbols provide a quick way to locate specific stocks or funds. Most research platforms, such as Bloomberg and Morningstar, allow you to type the ticker into the search bar. You see a list of analyst reports related to that company. If you do not know the ticker, you can enter the company name. This method works well for both beginners and experienced investors. You avoid confusion and get direct access to relevant reports.
Tip: Always double-check the ticker symbol before searching. Some companies have similar names, but their tickers are unique.
Filtering by Industry or Sector
You can refine your search by selecting an industry or sector. Platforms like S&P Capital IQ and FactSet offer dropdown menus or checkboxes for this purpose. You choose the sector that interests you, such as technology, healthcare, or finance. This filter helps you compare companies within the same industry. You see trends, risks, and opportunities that affect your investing strategy. Filtering by sector also helps you avoid irrelevant reports and focus on what matters most.
Sector
Example Companies
Analyst Report Focus
Technology
Apple, Microsoft
Innovation, growth
Healthcare
Pfizer, Johnson & Johnson
Drug approvals, market share
Finance
JPMorgan, Goldman Sachs
Regulation, earnings
Sorting by Geography or Market
You can sort analyst reports by geography or market. Many platforms let you select a region, country, or market type. You might want to focus on companies in North America, Europe, or Asia. Sorting by geography helps you understand local market conditions and regulations. You see how global events impact companies in different regions. This approach supports a well-rounded investing strategy and helps you spot international opportunities.
FineReportenhances your search and filtering experience. You use its drag-and-drop designer to create custom queries based on tickers, sectors, or regions. FineReport connects to multiple data sources, so you can analyze global trends and compare companies across markets. The platform’s interactive dashboards and real-time updates make it easy tovisualize and filter analyst reports. You streamline your research and make smarter choices with FineReport’s flexible tools.
When you search for analyst reports, you want to find the most relevant and timely information. Applying date filters helps you focus on recent analyst reports that reflect current market conditions. Most research platforms provide options to select a specific date range or sort reports by publication date. You can choose to view only the latest analyst reports or compare historical reports to spot trends over time.
You also benefit from filtering by analyst. Many platforms allow you to select reports written by specific analysts or research teams. This feature helps you follow experts whose opinions you trust. You can compare how different analysts view the same company or sector. Some platforms display analyst ratings, performance history, and credibility scores, making it easier to evaluate the quality of each report.
Tip: Use both date and analyst filters together to narrow your search. You will see the most recent insights from analysts with proven track records.
Here is a table showing how you can use these filters on popular platforms:
Platform
Date Filter Options
Analyst Filter Options
Bloomberg
Custom date range, latest
Analyst name, team, rating
FactSet
Last week, month, year
Analyst profile, firm
Morningstar
Recent, historical
Analyst name, rating
FineReport supports advanced filtering for analyst reports. You can set custom date ranges and select specific analysts using its drag-and-drop designer. This flexibility helps you analyze trends and compare expert opinions efficiently.
Using Keywords for Specific Topics
You can refine your search for analyst reports by using keywords related to specific topics. Most platforms include a search bar where you enter terms such as "earnings," "dividends," "market outlook," or "risk management." This method helps you find analyst reports that address your exact interests or concerns.
Platforms like S&P Capital IQ and Yahoo Finance let you combine keywords with other filters. You can search for analyst reports on a company’s quarterly results or industry trends. Using keywords saves you time and ensures you get targeted information.
Note: Try different keywords to uncover a wider range of analyst reports. You may discover new insights by exploring related topics.
Here is a simple list of keyword strategies:
Enter financial terms like "EBITDA" or "cash flow."
Search for sector-specific topics such as "technology innovation" or "healthcare regulation."
Use event-driven keywords like "merger," "acquisition," or "IPO."
FineReportenhances keyword search for analyst reports. You can build custom queries and filter reports by any topic. The platform’s interactive dashboards and real-time updates help you visualize results and focus on the information that matters most for your investment decisions.
Evaluating and Using Investment Analyst Reports Effectively
Assessing Report Quality and Credibility
When you read analyst reports, you want totrust the information before making any investing decisions. Not all research analysts provide the same level of quality. You should check a few important criteria to judge the credibility of investment analysts' reports. The table below shows what to look for:
Criteria
Description
Analyst's Rating History
Review the historical ratings given by the analyst to gauge consistency and reliability.
Performance of Articles
Analyze how well the analyst's past articles have performed in terms of stock price changes.
Declared Positions on Stocks
Check the analyst's stated positions (e.g., Strong Buy, Buy, Hold, Sell) for transparency.
You can use these criteria to decide if an analyst’s insights are reliable. Consistent ratings and transparent positions help you trust the research. If an analyst’s past articles match real stock movements, you can feel more confident in their investment research.
Comparing Multiple Analyst Opinions
You should never rely on just one source for investment analysis. When you compare several analyst research reports, you get a broader view of the market. Different research analysts may have unique perspectives on the same stocks. Some may focus on short-term trends, while others look at long-term growth. By reading equity research reports from different sources, you can spot patterns and avoid bias.
Try to look for both agreements and disagreements among analysts. If most analysts agree on a stock’s outlook, you may find stronger support for your decision. If opinions differ, you should dig deeper to understand why. This approach helps you make smarter investments and reduces the risk of missing important details.
Integrating Insights into Investment Decisions
You can use the insights from analyst reports to guide your investing strategy. Start by summarizing the main points from each report. Look for trends, risks, and opportunities that match your goals. Combine these insights with your own research and knowledge of the market. This process helps you build a well-rounded view before you invest.
FineReport can help you organize and visualize the information you gather from analyst reports. You can create dashboards that track key metrics and compare analyst opinions. FineReport lets you automate the collection of investment research, making it easier to spot trends and act quickly. By using these tools, you can turn analyst insights into smarter investment choices.
Avoiding Common Pitfalls
When you use analyst reports for investment decisions, you must watch out for common mistakes. Many investors fall into traps that can lead to poor choices or missed opportunities. You can avoid these pitfalls by staying alert and using a careful approach.
Common Pitfalls When Using Analyst Reports:
Relying on a Single Source: You may trust one analyst report too much. This can limit your perspective. Alwayscompare multiple analyst reports to get a balanced view.
Ignoring Report Dates: Old analyst reports may not reflect current market conditions. Check the publication date before you act on any advice.
Overlooking Analyst Bias: Some analyst reports may show bias due to conflicts of interest. Look for transparency in the analyst’s position and review their rating history.
Misunderstanding Financial Terms: Analyst reports often use technical language. Make sure you understand key terms like EBITDA, cash flow, and price targets. If you do not, research these terms before making decisions.
Failing to Verify Data: You should confirm the data in analyst reports with other sources. Errors or outdated information can affect your investment choices.
Acting Without a Strategy: Do not make decisions based only on analyst reports. Use them as part of a broader investment strategy that matches your goals.
Tip: Always combine analyst reports with your own research and analysis. This helps you make smarter investment choices.
Pitfall
How to Avoid
Single Source Reliance
Compare multiple analyst reports
Outdated Information
Check report dates
Analyst Bias
Review rating history and transparency
Technical Jargon
Learn key financial terms
Unverified Data
Confirm with other sources
No Strategy
Build a personal investment plan
FineReport helps you avoid these pitfalls. You can use FineReportto organize analyst reports, track report dates, and compare multiple sources. The platform’s dashboards let you visualize trends and spot inconsistencies. FineReport supports your investment strategy by providing tools for data verification and analysis. You gain confidence in your decisions and reduce the risk of common mistakes.
You want to get the most out of analyst reports. Staying updated helps you react quickly to changes in the market. Here are some effective strategies you can use:
Interpret ratings with a critical eye. Always look at analyst ratings together with financial performance and market conditions.
Compare multiple perspectives. Check ratings from different firms to spot potential biases and get a complete view.
Embrace a broader context. Think about economic conditions and overall market sentiment when you review analyst ratings.
Conduct your research. Go beyond analyst opinions by reviewing financial statements and industry reports yourself.
Tip: Set up alerts or notifications on your favorite research platforms. This way, you never miss new insights on your investments.
Leveraging Summary and Key Takeaways
Analyst reports often include summaries and key takeaways. These sections help you save time and focus on what matters most. When you read a summary, you get a quick overview of the main points. Key takeaways highlight important trends, risks, and opportunities. Use these sections to guide your deeper research. If you see a trend that matches your investing goals, you can dig into the details. Summaries also help you compare different stocks quickly. You make better decisions when you focus on the most relevant insights.
Combining Analyst Reports with Other Research
You improve your investment outcomes when you combine analyst reports with other research sources. Analyst reports give you expert opinions, but other sources add context and depth. For example, you can review industry news, company filings, and economic data. This approach helps you see the bigger picture and avoid missing important details.
Evidence Description
Key Insights
Analysts' qualitative statements and long-term profitability
Qualitative insights from analysts often link to better long-term results.
Predictive power of qualitative statements
These statements can help you predict future performance more accurately.
Differentiation of favorable reports
Some favorable reports reflect true beliefs and lead to better investments.
FineReportcan help you organize and visualize all your research. You can combine analyst reports, financial data, and your own notes in one place. FineReport’s dashboards let you track trends and compare insights, making your investing process more efficient.
Building a Personal Investment Strategy
You want to make smart choices with your money. Building a personal investment strategy helps you reach your financial goals and manage risk. Start by setting clear objectives. Decide if you want to grow your wealth, save for retirement, or protect your assets. Write down your goals so you can track your progress.
Next, gather information from analyst reports. Use platforms like Bloomberg, Morningstar, and S&P Capital IQ to compare companies and industries. Look for trends, risks, and opportunities. Analyst reports give you expert opinions and data that support your decisions.
Create a checklist to guide your research:
Define your financial goals.
Choose your preferred sectors or industries.
Review analyst ratings and recommendations.
Compare company fundamentals.
Assess market trends and risks.
Decide on your investment time frame.
Tip: Always review multiple analyst reports before making a decision. This helps you avoid bias and see the bigger picture.
Diversify your portfolio. Spread your investments across different sectors and asset types. This reduces risk and increases your chances of steady returns. Monitor your investments regularly. Use dashboards and alerts to track performance and spot changes in the market.
FineReportcan help you organize your strategy. You can create custom dashboards to visualize analyst data, set up scheduled reports, and automate alerts for key metrics. FineReport’s drag-and-drop designer lets you build interactive reports without coding. You can integrate data from multiple sources and update your strategy as market conditions change.
A strong personal investment strategy combines clear goals, thorough research, and regular monitoring. Use analyst reports and tools like FineReport to make informed decisions and stay ahead in the market.
You now know how to find analyst reports using top research platforms and tools. These reports help you make smarter choices when investing in stocks. Analyst reports offer information that goes beyond basic numbers, giving you deeper insights. The table below shows how these reports support better decisions:
Key Findings
Description
Information Beyond Metrics
Analyst reports provide insights that go beyond standard financial metrics.
Investor Reactions
Investors react more strongly to negative text in reports.
Predictive Value
Analyst reports can predict future earnings growth.
Start exploring these resources today, including FineReport, to organize your research and track trends. Make analyst reports a regular part of your process to improve your investment results.
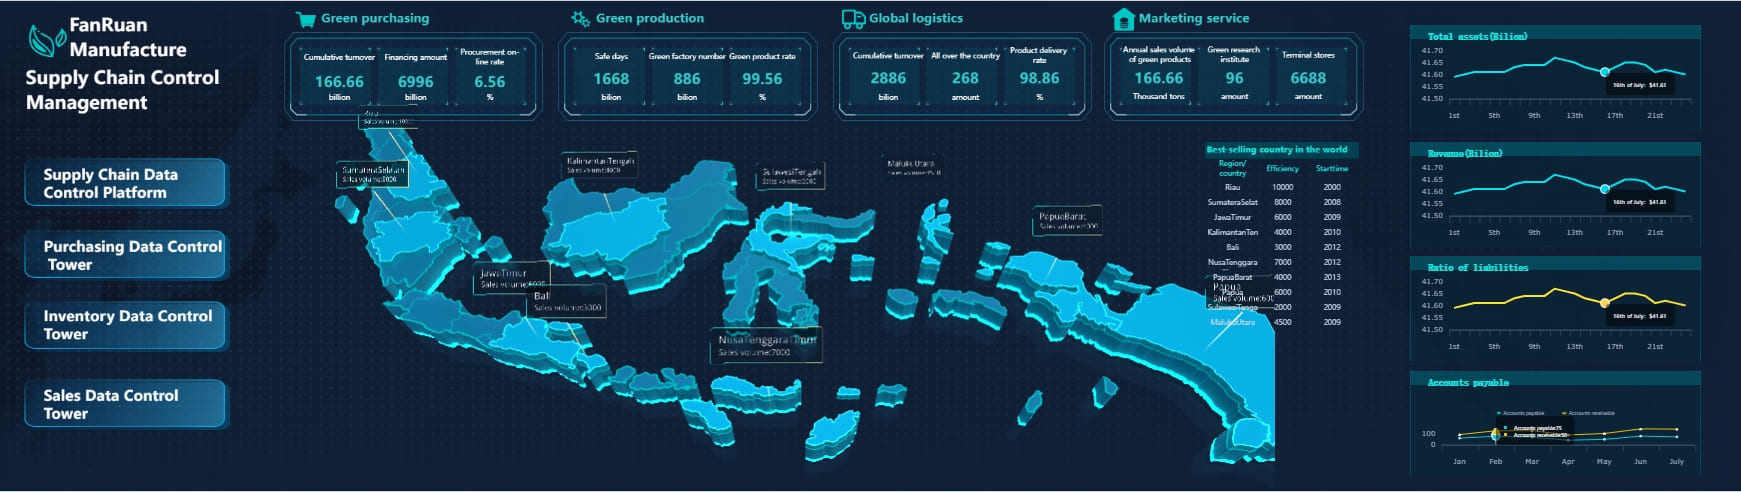
Real-time insights to optimize production, logistics, and decisions.
FAQ
What are analyst reports and why do they matter for investing?
Analyst reports give you expert opinions on stocks, companies, or industries. These reports help you understand market trends, company performance, and risks. You can use analyst reports to make smarter investment choices and avoid common mistakes.
How do you access analyst reports for free?
You can find free analyst reports on platforms like Yahoo Finance and Morningstar. These sites offer basic summaries, ratings, and price targets. For more detailed analyst reports, you may need to subscribe to paid services.
What should you look for in a good analyst report?
A good analyst report should include clear ratings, recent data, and transparent sources. You should check the analyst’s track record and see if the report explains risks and opportunities. Reliable analyst reports help you make informed decisions.
Can you use analyst reports with other research tools?
Yes, you can combine analyst reports with financial statements, news, and industry data. This approach gives you a complete view of your investments. FineReport lets you organize and visualize analyst reports alongside other research for better analysis.
How does FineReport help you work with analyst reports?
FineReport helps you collect, filter, and visualize analyst reports from different sources. You can create custom dashboards, automate report updates, and share insights with your team. FineReport makes it easier to use analyst reports for smarter investment decisions.