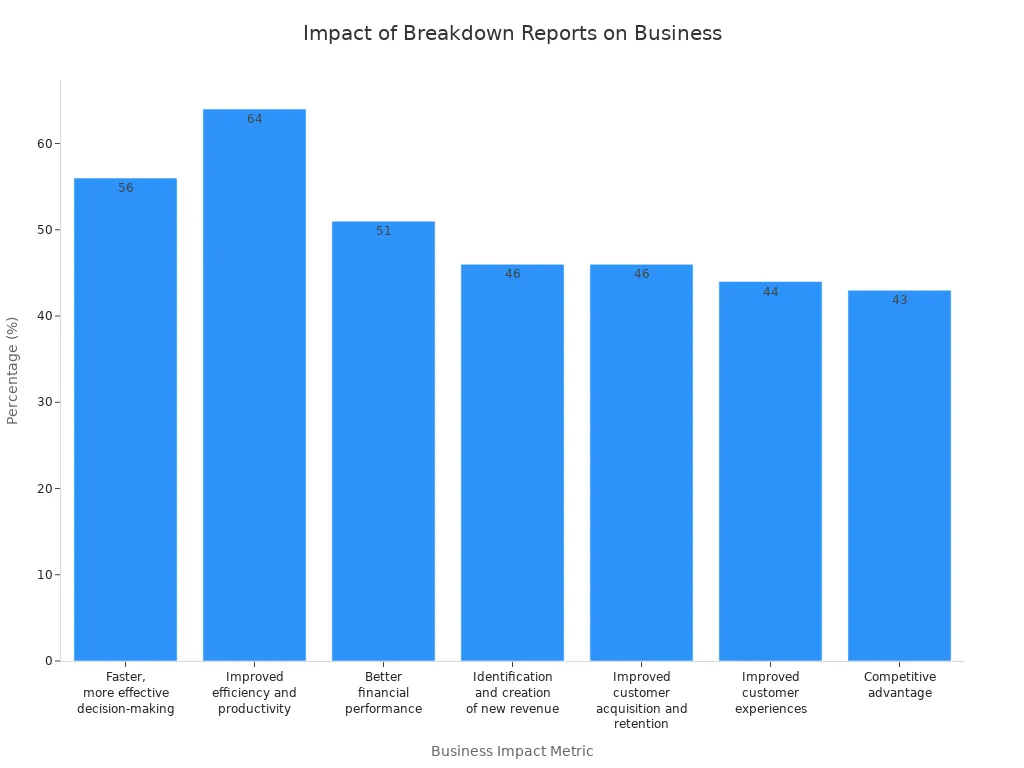
A breakdown report gives you a detailed account of issues, failures, or interruptions within a business process or system. You rely on these reports to spot problems quickly, boost efficiency, and support better decisions. Organizations that use breakdown reports see measurable improvements in productivity and financial results. For example, the table below shows how breakdown reports help drive business performance:
Metric
Percentage (%)
Faster, more effective decision-making
56
Improved efficiency and productivity
64
Better financial performance
51
Identification and creation of new revenue
46
Improved customer acquisition and retention
46
Improved customer experiences
44
Competitive advantage
43
You can use breakdown reports to reveal hidden inefficiencies and transform your organization’s operations.
Breakdown Report Overview
Definition
A breakdown report gives you a structured way to document and analyze failures or interruptions in a process, system, or piece of equipment. You use this report to record what happened, when it happened, and why it occurred. The breakdown report usually includes details such as the time of the incident, the affected area, the root cause, and the actions taken to resolve the issue. You rely on this report to create a clear record that helps you track patterns and prevent future problems.
A breakdown report is essential for organizations that want to maintain high standards of reliability and performance. You can use it to identify recurring issues and take corrective action quickly.
Purpose
You use a breakdown report to achieve several important objectives. First, you want to pinpoint the exact cause of a problem. Second, you need to communicate the issue to relevant teams or management. Third, you aim to support decision-making by providing accurate data about failures and their impact.
Here are some common scenarios where you might use a breakdown report:
Manufacturing: You track equipment failures, downtime, and maintenance activities. This helps you improve overall equipment effectiveness (OEE) and reduce production losses.
IT and Technology: You document system outages, software bugs, and network interruptions. This allows you to analyze incidents and strengthen system reliability.
Business Operations: You monitor process breakdowns in areas like finance, sales, or customer service. This supports continuous improvement and better resource allocation.
Industry
Typical Use of Breakdown Report
Manufacturing
Equipment failure analysis, OEE tracking
IT & Technology
Incident management, root cause analysis
Business
Process improvement, loss prevention
You benefit from using breakdown reports in any industry where reliability and efficiency matter. These reports help you reduce downtime, improve productivity, and make informed decisions based on real data.
When you create a breakdown report, you organize information into clear sections. This structure helps you analyze problems and track solutions. You usually start with a summary of the incident, followed by detailed records of what happened. The table below shows the main elements you include in a breakdown report:
Key Element
Description
Phases
Major stages of the process or project, grouping related activities and tasks.
Tasks
Specific activities within each phase that need attention.
Subtasks
Smaller actions that support the completion of larger tasks.
Deliverables
Results or outputs produced after resolving the breakdown.
Sub-deliverables
Smaller outputs that contribute to the main deliverables.
Work packages
Detailed groups of tasks with clear objectives and outcomes.
Dependencies
Links between tasks, showing which must be finished before others can start.
Estimates
Approximations of resources, time, or costs needed for resolution.
Milestones
Key points marking the completion of important phases or deliverables.
You also use lists to clarify the hierarchy and relationships in your breakdown report:
WBS Dictionary: Defines each element for clarity.
WBS Levels: Shows the structure, often with three levels.
Control Accounts: Groups work packages to monitor progress.
Project Deliverables: Lists the expected results.
Work Packages: Assigns small, related tasks to team members.
FineReportlets you customize breakdown report templates to match your business needs. You can add custom fields, automate formatting, and integrate data from multiple sources. This flexibility ensures your breakdown report fits your workflow and captures all necessary details.
You need to include specific data fields in every breakdown report to make your analysis effective. These fields help you measure performance, track progress, and identify areas for improvement. Common data fields in a breakdown report include:
Conversion rates
Lead generation
Return on investments (ROI)
Customer acquisition cost (CAC)
Production output
Sales figures
Customer satisfaction ratings
On-time delivery rates
Quality control metrics
Efficiency measures
FineReport supports the integration of these data fields from various databases and systems. You can use visualization tools, such as charts and tables, to present your breakdown report data in a clear and actionable format. You also benefit from mobile compatibility, which allows you to access and update breakdown reports on any device.
If you need to create a maintenance report, FineReportprovides templates that capture equipment status, downtime, and repair actions. You can automate formatting and include widgets or infographics to highlight trends and key metrics.
Tip: Customizing your breakdown report with FineReport helps you collect the right data, visualize results, and improve decision-making across your organization.
You rely on breakdown reports to keep your manufacturing operations running smoothly. When a breakdown occurs, you need to act fast to minimize downtime and prevent costly delays. You use breakdown maintenance strategies to track equipment failures, analyze root causes, and schedule repairs. This approach helps you identify patterns in breakdowns and optimize your maintenance routines.
In manufacturing, breakdown maintenance plays a critical role in improving overall equipment effectiveness (OEE). You monitor breakdowns to spot recurring issues and address them before they impact production. For example, you might use a breakdown report to record the time, location, and cause of a machine failure. You then analyze this data to determine whether preventive maintenance could reduce future breakdowns.
You also use breakdown reports to communicate with your maintenance team. By documenting each breakdown, you create a clear record that supports decision-making and continuous improvement. You can track the frequency of breakdowns, measure repair times, and evaluate the effectiveness of your breakdown maintenance plan.
Tip: Regularly reviewing breakdown reports helps you reduce downtime, increase productivity, and extend the lifespan of your equipment.
IT & Business
You use breakdown reports in IT and business environments to document and resolve incidents quickly. In IT, breakdown maintenance involves tracking system outages, software bugs, and network interruptions. You rely on breakdown reports to provide comprehensive documentation of each incident. This documentation helps you understand the nature and impact of breakdowns and guides your response.
Breakdown reports are essential for root cause analysis in IT. You record the details of each breakdown, including the steps taken to resolve it. This information supports future incident responses and promotes collaboration among teams. You can identify trends in breakdowns and implement solutions to prevent similar issues.
In business functions such as sales and finance, breakdown reports help you monitor performance and spot inefficiencies. You use breakdown maintenance to track process breakdowns, measure key metrics, and support strategic decisions. The table below shows how you apply breakdown reports in different business dashboards:
Track vital metrics like total revenue and gross profit margin, monitor month-to-month changes.
MRR Breakdown Dashboard
Analyze MRR data, discover trends, and conduct month-over-month comparisons.
Product Revenue Dashboard
Track product revenue, understand MRR trends, and conduct financial analysis related to product performance.
Daily Cashflow Forecast Dashboard
Build data-backed forecasts for daily, weekly, and yearly cashflow using historical data.
You benefit from using breakdown reports to improve transparency, support financial planning, and drive business growth. You can identify breakdowns in sales processes, monitor cash flow, and optimize resource allocation.
FineReport Use Cases
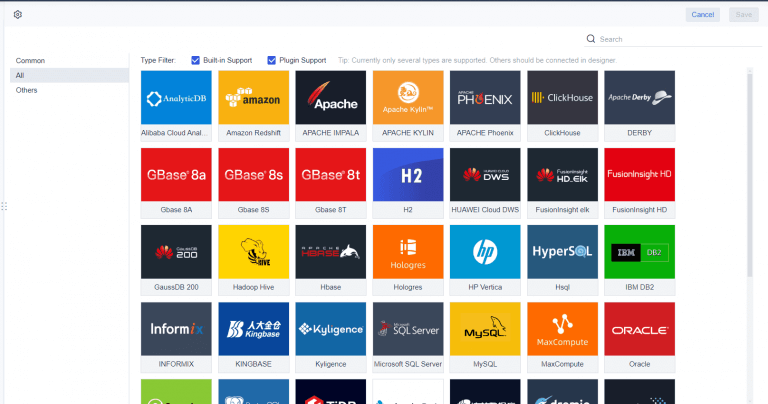
FineReport gives you powerful tools to manage breakdown reports across manufacturing, IT, and business functions. You can create customized breakdown maintenance dashboards that provide real-time monitoring and visualization of breakdown data. FineReport connects to various data sources, allowing you to integrate information from equipment sensors, IT systems, and business databases.
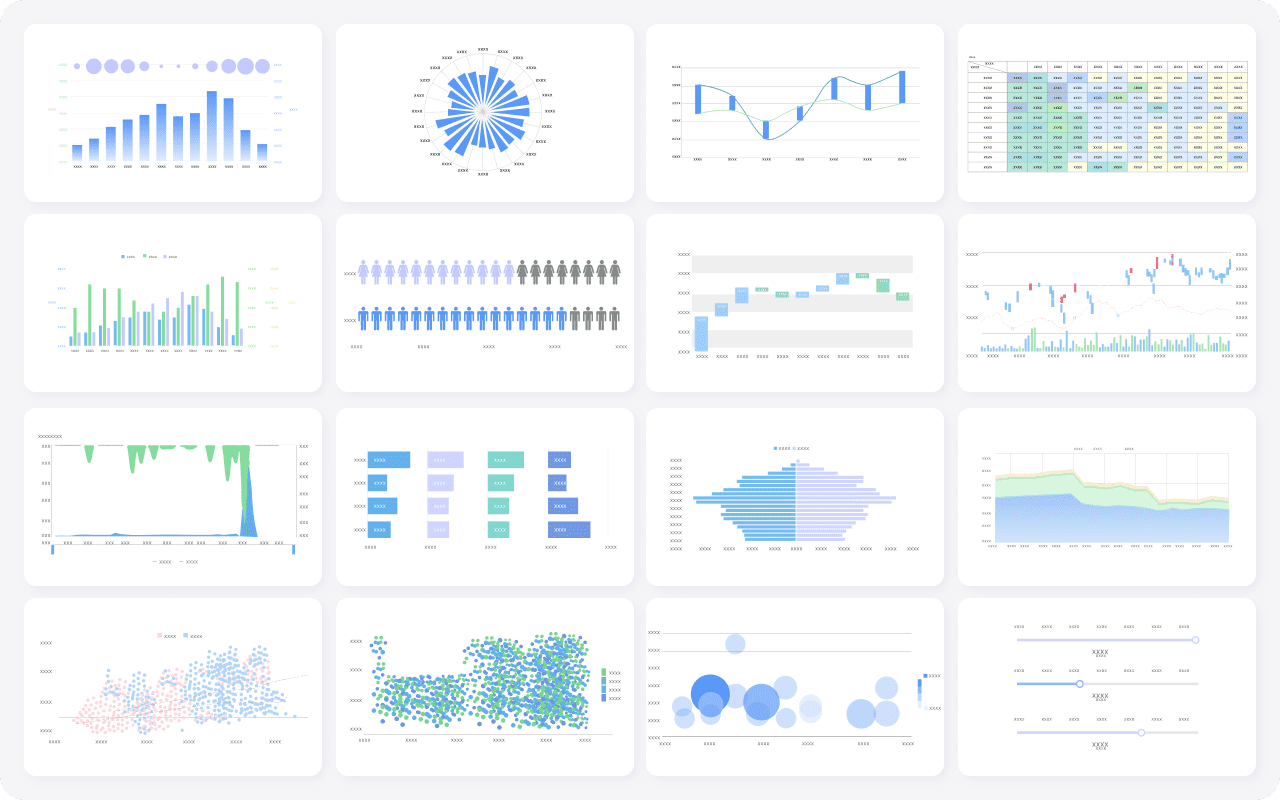
You use FineReport’s flexible report designer to tailor breakdown reports to your specific needs. You can choose from diverse visualization types, such as charts and tables, to represent breakdown data effectively. Mobile access lets you view and update breakdown maintenance reports anytime and anywhere, ensuring you stay informed and responsive.
Feature
Description
Flexible Report Designer
Enables you to create customized breakdown reports tailored to your specific needs.
Diverse Visualization Types
Offers various visualization options to represent breakdown data effectively.
Mobile Access
Allows you to access breakdown reports and dashboards on mobile devices for real-time insights.
You can connect FineReport to multiple data sources, create dynamic breakdown maintenance dashboards, and ensure insights are available whenever you need them. For example, in manufacturing, you use FineReport’s OEE solution to monitor equipment breakdowns, analyze downtime, and identify root causes. In IT, you track system breakdowns and visualize incident trends. In business, you build dashboards to monitor financial breakdowns and optimize performance.
Note: FineReportempowers you to streamline breakdown maintenance, improve decision-making, and enhance operational efficiency across your organization.
FineReport's Multiple Charts For Data Visualization
When you use a breakdown report in your workflow, you gain several important benefits. You improve decision-making by having clear data about every breakdown and its impact. You increase efficiency because breakdown maintenance helps you respond quickly to issues and minimize downtime. You also create greater transparency, which allows everyone to see what happened and how you resolved it.
Here is a table that summarizes the main advantages of using breakdown reports and breakdown maintenance:
Benefit
Description
Increased accountability
Ensures everyone knows their part in the workflow and the importance of completing their tasks.
Better productivity
Minimizes downtime by allowing teams to focus on high-value work instead of chasing updates.
Greater transparency
Facilitates support-seeking and query-raising among colleagues in different departments.
Eliminated redundancies
Highlights areas where multiple team members may be duplicating efforts.
Quick resolutions
Allows team leaders to easily adjust and optimize workflows when issues arise.
Enhanced compliance
Helps maintain adherence to legal and regulatory standards, reducing non-compliance risks.
Smoother communication
Reduces confusion and unnecessary back-and-forth, aiding collaboration across departments.
A breakdown report also helps you track your own progress and identify strengths and weaknesses. This open access to performance data fosters a culture of transparency and accountability. When you analyze breakdowns, you can communicate results clearly and measure progress toward business goals. You use breakdown maintenance to keep your team focused and aligned.
Limitations
You may encounter some challenges when you implement breakdown reports and breakdown maintenance in your organization. Data quality can impact the effectiveness of your maintenance report. If you have undetected breakdowns or delays in reporting, you risk making poor decisions. The table below shows how data downtime and business impact can affect your results:
Metric
Description
Data Downtime
Measures the number of data incidents multiplied by the average time to detection and resolution.
Business Impact
Highlights that undetected incidents for longer periods have a greater negative impact on decisions.
You also need to define key roles early in the process. Poor communication can slow down your breakdown maintenance program. You should use frameworks and guidelines to test your approach. Building a network of peers helps you learn best practices. You do not need a fully mature business process to start. Understanding your existing processes and data can speed up implementation.
Here are some common challenges you might face:
Determining the key people and their roles early in the process.
Knowing communication is key.
Utilizing frameworks and guidelines.
Building a network of peers.
Thinking you need a fully mature business process.
Understanding existing processes and data.
Starting at the desired end result.
Clearly communicating requirements.
Thinking of the big picture first.
Listening to advice and guidance.
To overcome these challenges, you should offer ongoing support and continuous learning. Institutionalize new processes and clearly explain the purpose of breakdown maintenance. Leadership support and early involvement of employees help build trust. Tailor communications and provide practical training. Share success stories and monitor adoption for continuous improvement. When you use a breakdown report and maintenance report effectively, you create a strong foundation for operational success.
A breakdown report gives you a clear record of failures and helps you turn raw data into actionable steps. You use visuals to simplify complex information, making it easier to spot trends and areas needing attention. FineReportstreamlines the process, letting you create customized breakdown reports and dashboards for any industry. When you implement breakdown reports, you build transparency, improve communication, and empower your team to make informed decisions.
Step
Description
1
Assign clear ownership to avoid confusion.
2
Communicate purpose to build understanding.
3
Maintain regular updates to keep momentum.
4
Use iterative phases for easier adoption.
5
Measure results for actionable insights.
6
Evaluate and refine your approach over time.
You can unlock greater value and drive operational improvements by adopting breakdown reports and leveraging tools like FineReportin your organization.
Real-time insights to optimize production, logistics, and decisions.
FAQ
What is a breakdown report and why do you need it?
A breakdown report gives you a structured way to record and analyze failures or interruptions. You use it to track issues, find root causes, and improve processes. This report helps you reduce downtime and make better decisions.
How does a breakdown report differ from a regular incident report?
A breakdown report focuses on analyzing the causes and effects of failures in detail. You use it to identify patterns and prevent future issues. An incident report usually records what happened without deep analysis.
What information should you include in a breakdown report?
You should include the time, location, cause, and impact of the breakdown. Add actions taken, responsible personnel, and any follow-up steps. This information helps you understand and resolve issues quickly.
How can FineReport help you create a breakdown report?
FineReport lets you design custom breakdown report templates. You can integrate data from multiple sources, use visual dashboards, and access reports on any device. This flexibility helps you monitor and analyze breakdowns in real time.
Why is real-time monitoring important in a breakdown report?
Real-time monitoring in a breakdown report lets you spot issues as they happen. You can respond faster, reduce downtime, and keep your operations running smoothly. This approach supports continuous improvement and better performance.