A project status dashboard gives you a clear view of your project’s progress. You see updates in real time, which helps you avoid schedule delays and miscommunication. With dashboards, your team can share insights and respond quickly when things change. The table below shows how dashboards boost collaboration and project visibility:
Metric
Impact on Collaboration
Engagement Increase
25% (via dashboards and charts)
Schedule Deviation Reduction
20% (real-time tracking tools)
Miscommunication in Projects
31% of failures attributed
You do not need advanced skills to start. Project management tools like FineReport make dashboard building simple and accessible for everyone.
Project Status Dashboard Basics
What Is a Project Status Dashboard?
A project status dashboard is a visual tool that displays real-time data about your project, showing key metrics like timelines, budgets, and task completion rates so you can monitor progress and make informed decisions.
You use a project management dashboard to track every stage of your project. It brings together important details, such as deadlines and budgets, in one place. You see updates instantly, which helps you respond quickly to changes. Many beginners start with dashboards that fit their needs. The table below shows common dashboard types and their uses:
Dashboard Type
Description
Strategic Dashboard
Used by upper management to monitor key performance metrics and make data-driven decisions.
Operational Dashboard
Monitors team efficiency and real-time performance, allowing for immediate action on abnormalities.
Tactical Dashboard
Bridges strategic and operational dashboards, used by middle managers to adjust plans based on performance.
Analytical Dashboard
Provides detailed insights for analysts to spot trends and make future projections.
Key Benefits for Beginners
When you use a project management dashboard, you gain several advantages:
Clear project visibility: You monitor project progress in real time, keeping everyone informed about task progress and deadlines.
Better team collaboration: The dashboard provides a shared space for project details, improving communication and alignment.
Faster problem-solving: You identify issues early and make adjustments before problems grow.
Tip: Dashboards increase transparency and accountability. You see project status, performance, and risks clearly. Real-time data helps you allocate resources wisely and track financial metrics, keeping your project on budget.
Evidence Description
Impact on Transparency and Accountability
Dashboards provide clear visibility into project progress, performance, and risks.
Enhances understanding of project status and potential issues.
Real-time data about budget and schedule improves resource allocation.
Prevents budget overruns and increases accountability among team members.
The table below lists features experts recommend for new users:
Feature
Description
Task and Timeline Tracking
Confirm projects are progressing as planned, viewing milestones and deadlines at a glance.
Resource Management
Monitor workloads and team member availability in real time, aiding in task distribution.
Real-Time Reporting and KPIs
Continuously monitor project progress, tracking budgets and performance metrics.
Collaboration and Communication
Integrate messaging and file sharing tools for team collaboration.
Customizable Views
Adapt layouts and data displays to match workflows, improving focus and reducing clutter.
You set up your dashboard with these features to make project management easier and more effective.
Planning Your Project Management Dashboard
Define Goals and Metrics
You start by setting clear goals for your project management dashboard. Decide what you want to achieve and how you will measure success. Project dashboards help you understand objectives, track progress, and spot challenges. They make it easier to create progress reports for managers and team leaders. You use dashboards to monitor performance and find areas to improve.
Here are common goals and metrics you might track:
Monitoring and reporting
Decision-making
Performance analysis
Risk mitigation
To choose the right metrics for your project, follow these steps:
Understand project objectives and goals. Define what success means for your project.
Consider project scope and complexity. Pick metrics that match your project's details.
Review industry standards and best practices. Use metrics that others in your field recognize.
Collaborate with your project team. Ask for input to make sure metrics fit real needs.
Focus on key areas for measurement. Track what matters most for project success.
Tip: When you set clear goals and metrics, you make tracking project progress easier and more accurate.
Identify Data Sources
You need reliable data sources for your project management dashboard. Good data ensures your dashboard shows accurate information. Most beginners use these sources:
CSV files
Excel spreadsheets
SQL databases
Cloud-based data repositories
Reliable data sources help you avoid mistakes. Poor data quality can lead to wrong conclusions. When you integrate data from different systems, you get better insights and more reliable results.
Data Source Type
Benefit
CSV/Excel
Easy to update and manage
SQL Database
Real-time tracking
Cloud Repository
Accessible from anywhere
Decide on Team Access
You control who can view and edit your project management dashboard. Limiting access rights keeps sensitive data secure. You assign roles like Admin, Member, Contributor, or Viewer. Each role has different permissions. This helps you protect data and lets your team work together safely.
Sharing dashboards across teams keeps everyone aligned. When you give access only to those who need it, you improve security and make collaboration easier. Your team works from the same data, which reduces confusion and supports better tracking.
Note: Controlled access is key for both security and teamwork. Set permissions carefully to keep your project safe and efficient.
Choosing Tools: FineReport and Alternatives
Why Choose FineReport for Dashboards
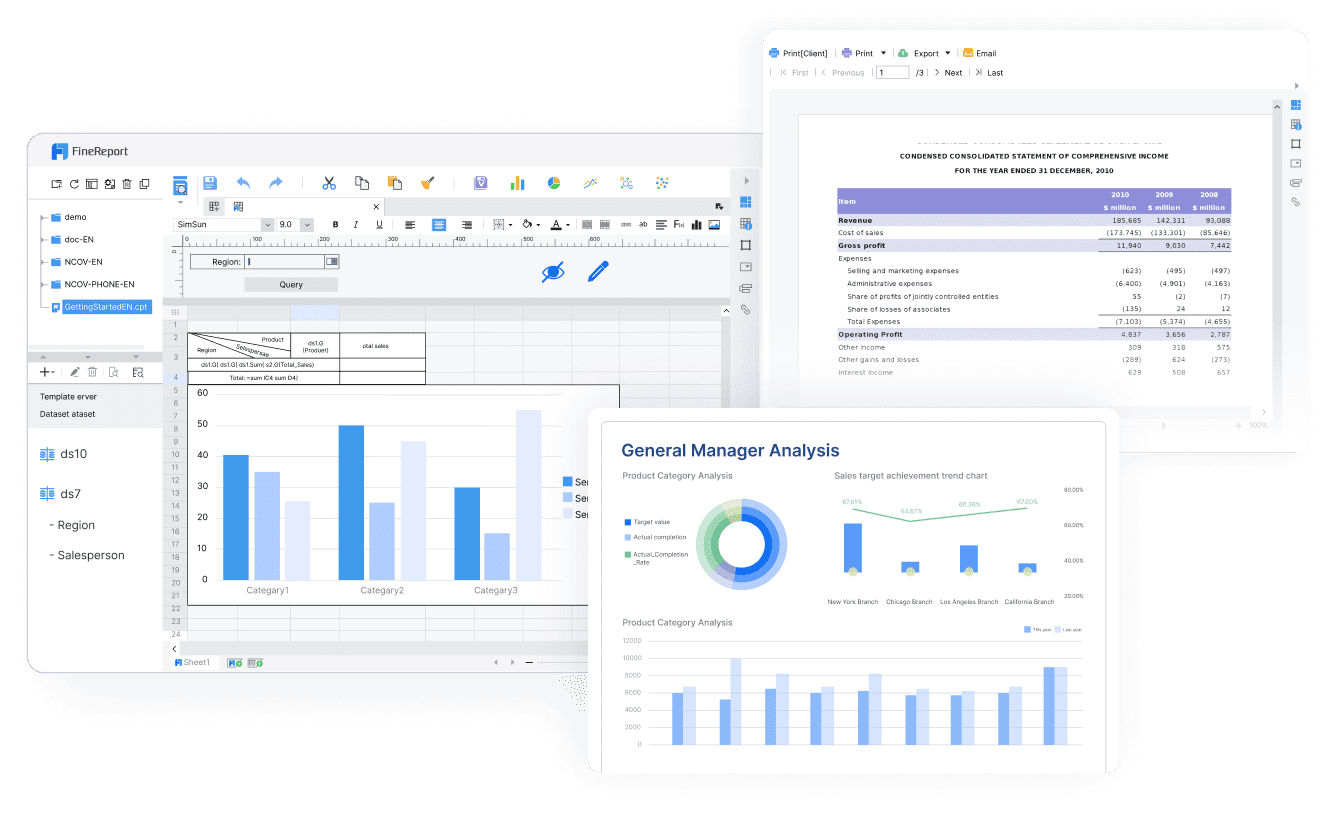
You want a tool that makes dashboard creation simple and effective. FineReport stands out as a user-friendly option for beginners. Its interface looks like Excel, so you feel comfortable right away. You do not need to write code. You can build a dashboard by dragging and dropping charts, tables, and other visuals. FineReport connects to many data sources, which means you always see real-time updates for tracking project progress.
Here is a quick look at features that make FineReport a great choice for your dashboard:
Feature
Description
User Interface
Familiar Excel-like design
No-Code Development
Drag-and-drop dashboard building
Free Personal Version
No cost for beginners
Data Source Connectivity
Real-time updates from databases
Charting Options
Over 50 chart styles with dynamic effects
You can access your dashboard on your phone or tablet. This helps you stay connected and monitor tracking wherever you are.
Comparing FineReport with Other Tools
You may wonder how FineReport compares to tools like Excel or Google Sheets. The table below shows the main differences:
Feature
FineReport
Excel/Google Sheets
User Interface
Drag-and-drop dashboard design
Spreadsheet interface
Data Integration
One-click database connections
Limited integration
Visualization Options
50+ HTML5 chart styles
Basic charts
Mobile Accessibility
Dedicated mobile app
Mobile-friendly
Target Users
Professionals in many sectors
General use
FineReport’s drag-and-drop dashboard interface is easy to use. Many users rate it highly for usability. Other tools, like Grafana, offer similar features but often require more training to master advanced dashboard options. FineReport also supports strong integration with data sources, making it a good fit for tracking and managing dashboards as your needs grow.
If you need help, you can find resources like the FVS Resource Center, training videos, learning paths, and certifications. Online support is also available during business hours. These resources help you learn how to build and manage dashboards for effective project tracking.
Build Your Project Status Dashboard
Creating your project status dashboard is a step-by-step process. You will design the layout, add visuals and widgets, integrate real-time data, and customize the dashboard for your team. FineReport provides practical solutions for both manufacturing and public sector projects, making it easier to track project progress and improve decision-making.
Design the Dashboard Layout
Start by thinking about who will use your dashboard and what decisions they need to make. Study how and where your team will access the dashboard. Place the most important metrics in the top left corner. Organize other details in the bottom right. Use a tight grid with minimal whitespace to keep everything clear. Avoid scrolling, as it makes comparisons harder. Test your dashboard with real users to see if it works well.
Follow these layout principles:
Define your dashboard’s purpose. Decide what you want to achieve.
Include only important information. Every element should support your goal.
Choose efficient visualizations. Make sure users understand data quickly.
Group related metrics together. Help users find what they need.
Use size and position to show which data matters most.
A well-organized dashboard layout highlights key performance indicators and essential metrics. This structure helps users grasp important information quickly. You save time and make better decisions when your dashboard communicates critical data on a single screen. Visual hierarchy lets important data stand out. Interactive elements, like filters, allow deeper exploration. Design your dashboard for your team’s workflow and follow accessibility standards so everyone can use it.
Add Visuals and Widgets
Visuals and widgets make your dashboard easy to understand. You can use charts, tables, and progress bars to show project status. Widgets help you track key metrics and display data in clear formats. The table below lists common widgets and their uses:
Widget Type
Description
Chart Widgets
Show data with bar, line, or pie charts.
Metric Widgets
Display KPIs for quick project status overview.
Table Widgets
Present detailed tabular data for specific fields.
Image Widgets
Add relevant images to support your data.
Progress Widgets
Indicate project or task progress with bars or percentages.
Calendar Widgets
Show important dates and deadlines.
Map Widgets
Visualize geographic data, such as project site locations.
Filter Widgets
Let users customize which data they see.
Notification Widgets
Alert users to important events or changes.
Interactive widgets enhance your dashboard. They present complex data clearly, helping teams spot priorities and bottlenecks. Widgets update automatically, so you always see the latest information. Visual representations improve communication and align team efforts. You can tailor widgets for different users, making sure everyone gets relevant information.
Integrate Real-Time Data
Real-time data integration is essential for effective project tracking. You get instant access to the latest information. This allows you to respond quickly to changes in your project. Real-time updates improve decision accuracy and reduce errors. You break down data silos, giving your team unified access to project information. Your dashboard operates with current data, so you can react instantly to critical events. You uncover trends that help drive strategic decisions.
FineReport makes real-time data integration simple. You connect to databases, Excel files, or cloud sources with one click. Your dashboard updates automatically, keeping your project management dashboard current. You can monitor project status and progress without manual updates.
Customize for Team Collaboration
Customizing your dashboard for team collaboration improves project management. You assign roles and permissions so each team member sees only what they need. This keeps sensitive data secure and supports teamwork. You can add messaging tools, file sharing, and comment sections to your dashboard. These features help your team communicate and solve problems faster.
FineReport supports customizable views and layouts. You adapt the dashboard to fit your team’s workflow. You can create dashboards for different departments, such as finance, operations, or HR. Scheduled reporting sends updates to managers automatically, keeping everyone informed.
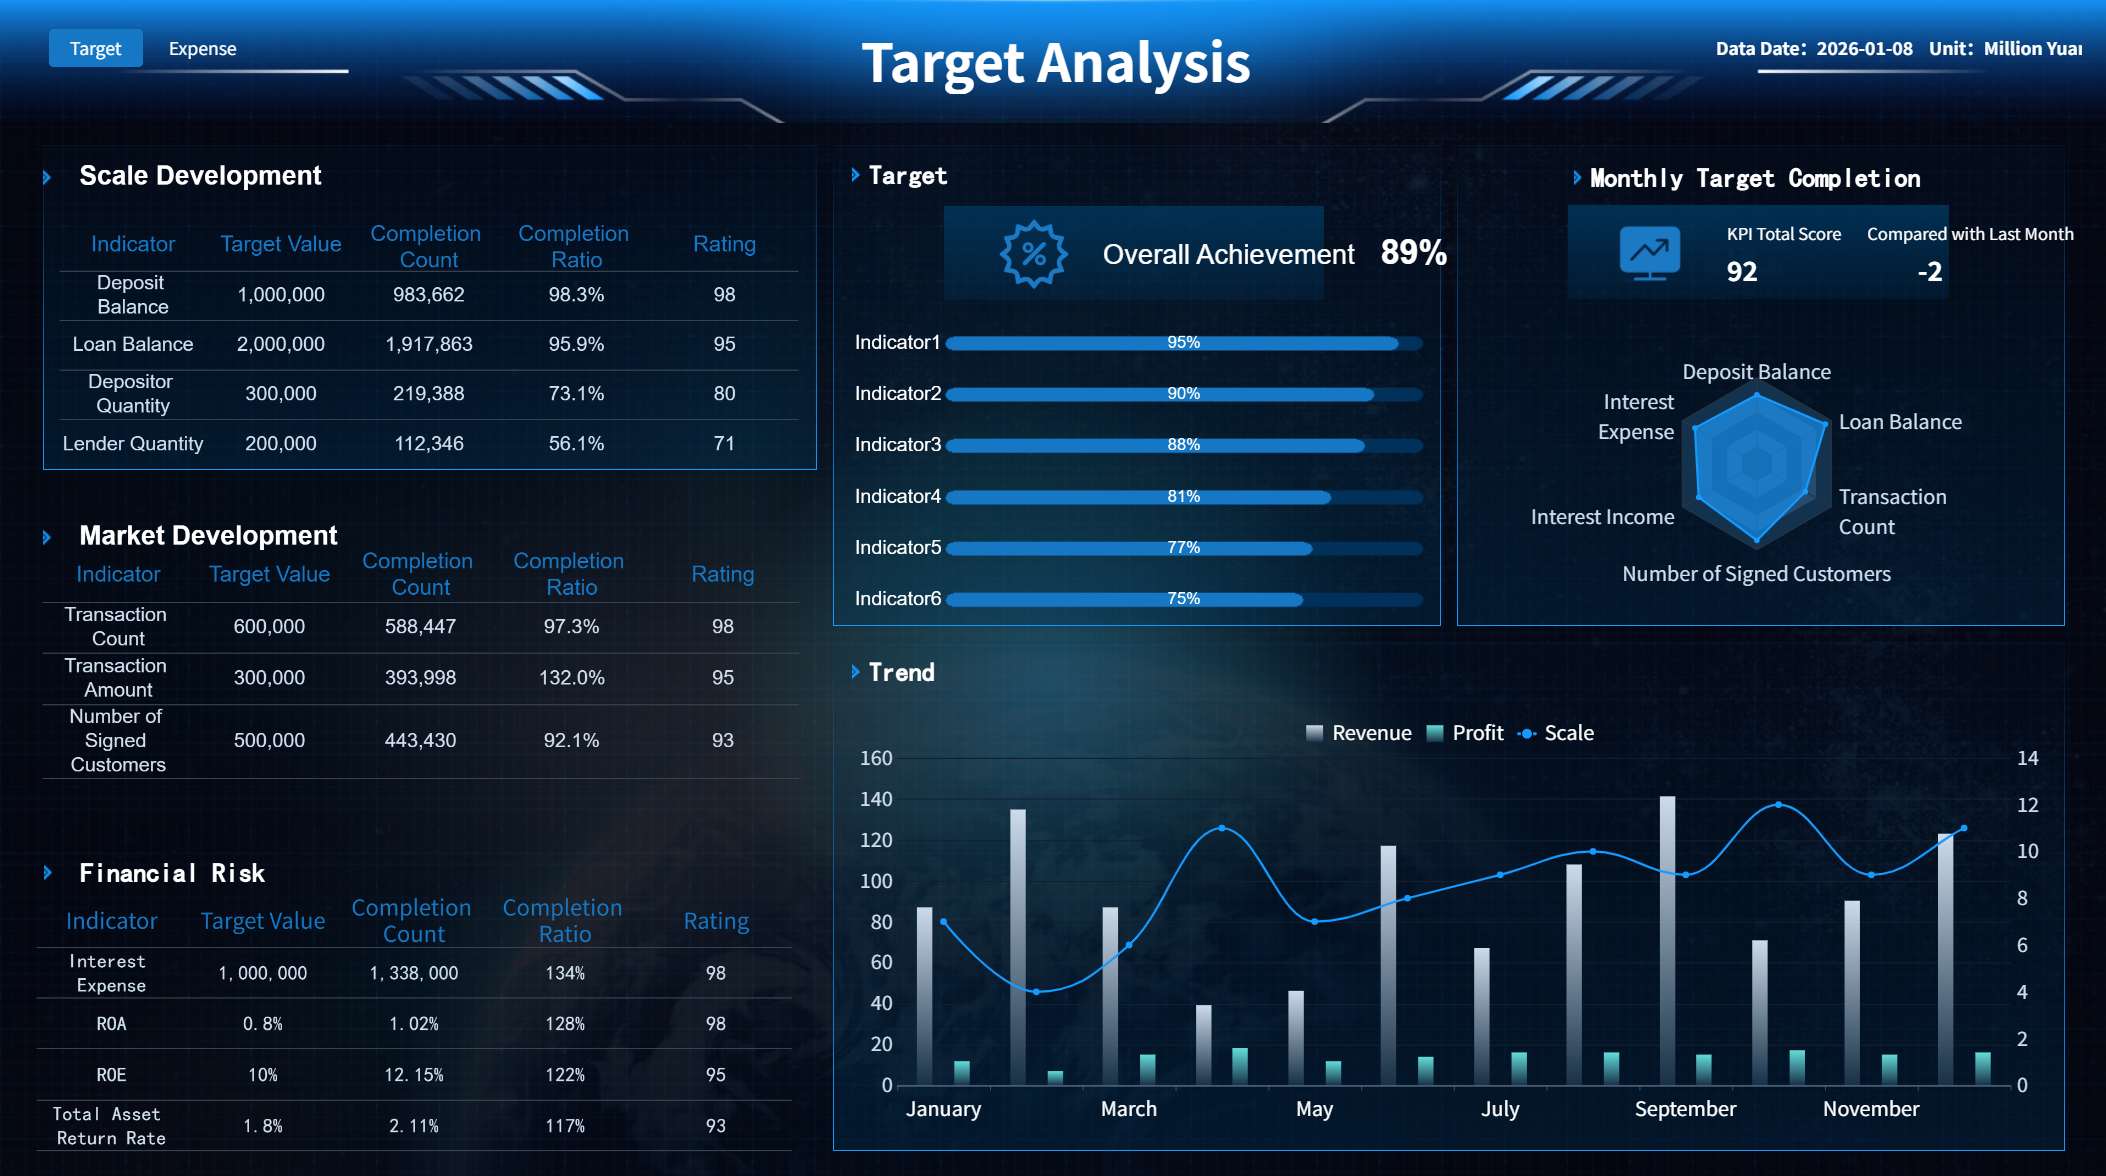
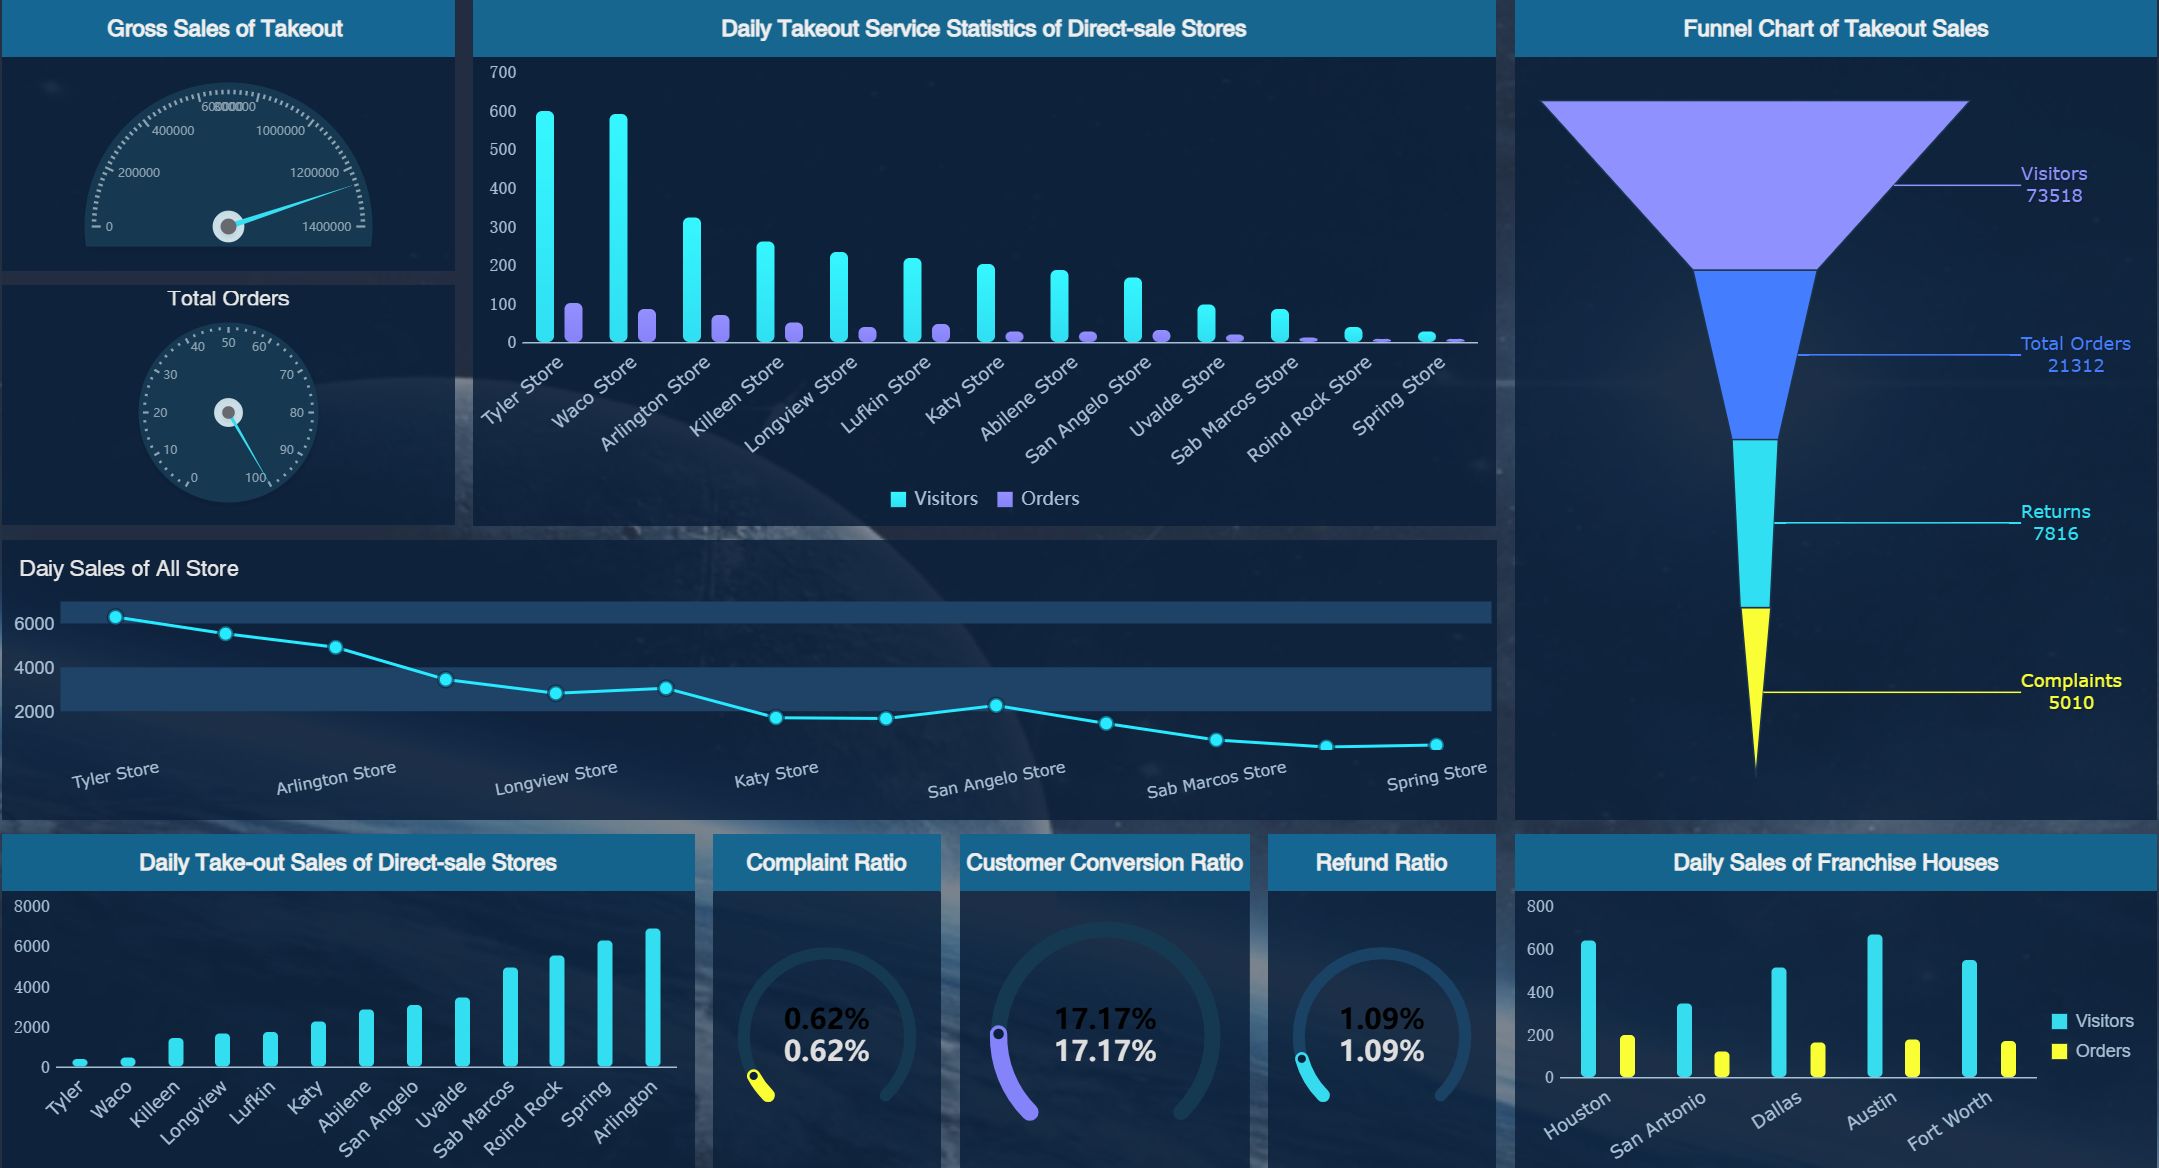
Operational Dashboard (Click to Engage)
Tip: Customization ensures your dashboard matches your team’s needs. You improve collaboration and make project tracking more efficient.
FineReport Use Cases: Manufacturing & Public Sector
FineReport offers powerful solutions for manufacturing and public sector projects. In manufacturing, you use dashboards to monitor quality control and agile production. You track qualification rates, defect rates, and scrap rates in real time. Visualizations help you spot trends and identify root causes of problems. You can compare performance across production lines and stages, making it easier to optimize processes.
For example, a manufacturer uses FineReport to display qualification rates with bar charts and analyze defect trends with line charts. Pie charts show the distribution of defect causes. Interactive features let you drill down into specific issues. You customize colors and styles to match your needs.
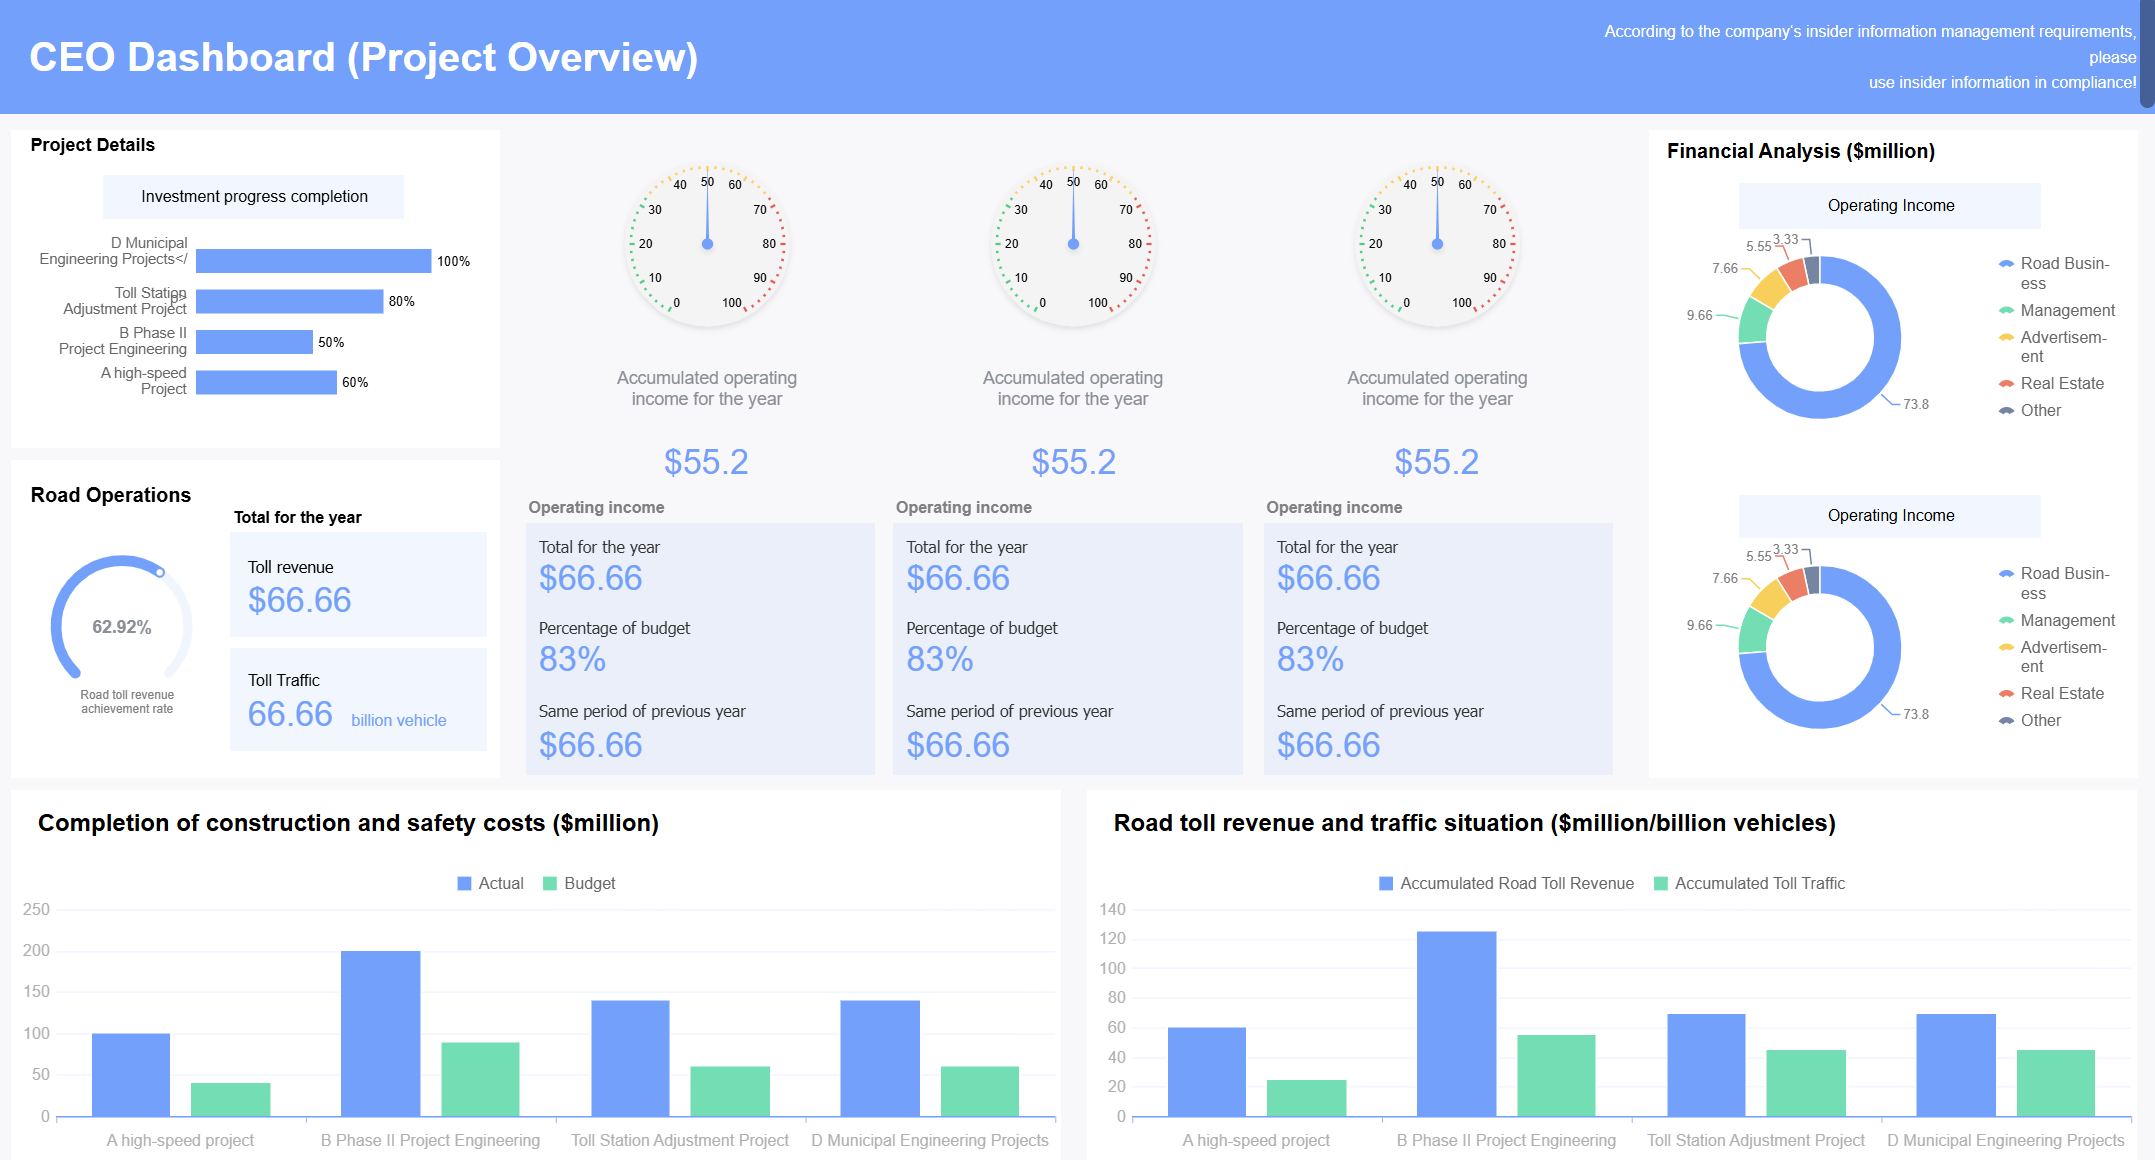
In the public sector, organizations like the Abu Dhabi Projects and Infrastructure Centre (ADPIC) use FineReport to manage large-scale infrastructure projects. ADPIC implemented a CXO dashboard to oversee project delivery, safety, and quality. Real-time insights help leaders make informed decisions and align projects with strategic goals. FineReport’s adaptability allows public sector teams to customize dashboards for their unique requirements.
These examples show how FineReport supports project status dashboard creation in different industries. You gain clear visibility, improve tracking, and make better decisions for your project.
Maintain and Optimize Your Project Status Dashboard
Keep Data Updated
You need to keep your project dashboard current to make smart decisions. Real-time data visualization transforms raw information into insights, helping you spot project status changes quickly. Automated reporting saves time and reduces errors by generating reports based on dashboard data. You can connect your dashboard to databases, spreadsheets, or cloud sources for instant updates. Customizable KPI tracking lets you focus on what matters most for your project, such as budget variance, schedule performance index, resource utilization, task completion rate, and quality metrics.
Feature
Benefit
Real-time data visualization
Quick identification of project status
Customizable KPI tracking
Relevant information is prioritized
Collaborative task management
Team updates and communication are streamlined
Resource allocation visibility
Prevents burnout and balances workloads
Automated reporting
Saves time and reduces errors
Tip: Set up automated notifications so your team receives updates when important project milestones change.
Gather Feedback and Improve
You should ask your team for feedback to improve your project dashboard. Comment threads on specific tasks or milestones help everyone share ideas. Task assignment and reassignment capabilities make it easy to adjust responsibilities. File sharing and version control keep documents organized. Real-time notifications alert you to updates and mentions, so you never miss important changes.
Collect feedback regularly from team members.
Review suggestions and identify areas for improvement.
Update dashboard features to match your project needs.
Encourage open communication to solve problems quickly.
Effective project management requires clear visibility into resource allocation and team workloads. Visual tools help you assign tasks to the right people and prevent burnout.
Avoid Common Mistakes
You can avoid common mistakes by following best practices. Do not overload your dashboard with too much information. Focus on key metrics that support your project goals. Test your dashboard with real users to make sure it is easy to use. Keep your data sources reliable and up to date. Assign clear roles and permissions to protect sensitive project data.
Automated reporting and analytics save time and reduce human error by generating reports based on dashboard data, allowing project managers to focus on strategic decision-making.
Regularly review your dashboard and make adjustments as your project evolves. Stay flexible and adapt to new challenges. Your dashboard will help you track progress, improve teamwork, and achieve project success.
You can start building your own project status dashboard today. FineReport gives you the tools to make this process simple and effective. Review and update your dashboard often to keep your project on track. Real-time tracking helps you make better decisions and work well with your team.
Remember: With practice and the right resources, you can master dashboard creation. Take the first step and see your project management skills grow!
Access a wealth of case studies, industry insights, and solution guides to accelerate digital transformation.
FAQ
How do you connect your data to FineReport?
You can connect FineReport to many data sources, such as Excel files, SQL databases, or cloud storage. Use the drag-and-drop interface to link your data quickly. FineReport updates your dashboard in real time.
Can you use FineReport on your phone or tablet?
Yes! FineReport dashboards work on smartphones and tablets. You can check project status, view charts, and get updates anywhere. The mobile app makes it easy to stay connected.
What types of charts can you add to your dashboard?
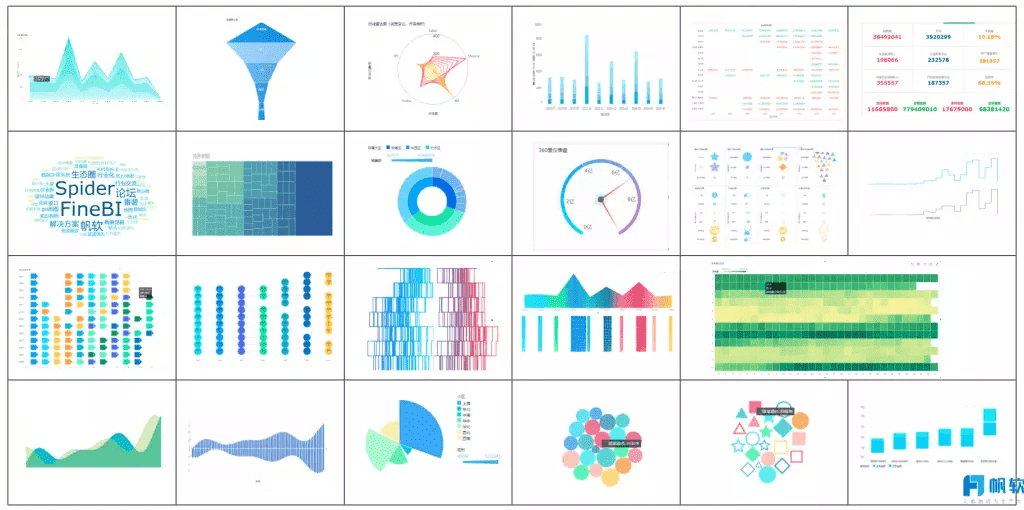
FineReport offers over 50 chart styles, including bar, line, pie, and 3D charts. You can choose the best chart for your data. Visuals help you understand project progress at a glance.
Is it possible to share dashboards with your team?
You can share dashboards with your team by setting permissions. Assign roles like Viewer or Editor. This keeps your data safe and lets everyone see the latest project updates.