What is a supply chain KPI dashboard? This tool displays key performance indicators for your supply chain in one place. You can track metrics like inventory levels, order fulfillment, and delivery times. A supply chain KPI dashboard helps you monitor performance, spot issues, and make better decisions quickly.
Many manufacturers struggle with supply chain visibility. About 69% of companies lack complete insight into their supply chains. Real-time analytics play a critical role in improving productivity and reducing business risks. By using integrated data and advanced analytics, you can enhance efficiency and respond faster to changes.
Understanding the Supply Chain KPI Dashboard
What Is a Supply Chain KPI Dashboard
A supply chain KPI dashboard gives you a real-time view of your supply chain’s most important performance indicators. You can see how each part of your supply chain connects and works together. This tool helps you set clear objectives for every component, such as procurement, inventory, and logistics. You identify the most informative and measurable metrics, then select a small set of essential kpi values for a complete assessment. You display these kpi values on the dashboard and group them for easy navigation.
A supply chain dashboard usually includes features like real-time metrics monitoring and automatic report generation for daily, weekly, or monthly periods. You can integrate it with supplier systems to track shipments and use simulation tools to predict business scenarios. These features help you respond quickly to changes and keep your supply chain running smoothly.
You may wonder how a dashboard differs from traditional reports. The table below highlights the main differences:
Feature
Dashboard
Report
Purpose
Focuses on a central topic or question
Covers multiple topics
Data Presentation
Shows current data only
Includes historical data
Length
One page long
Multiple pages
Metrics
Few high-priority KPIs
Many data points
Visual Elements
Visual, concise format
Narrative and visuals
Data Volatility
Latest information
Older data for trend analysis
User Understanding
Requires subject knowledge
Easier for general users
Why KPI Dashboards Matter in Supply Chain Management
You need a supply chainKPI dashboardto improve visibility and control. This tool gives you real-time access to supply chain performance, so you can track essential metrics that boost efficiency and reduce costs. When you monitor specific kpi values, you can spot problems early and take action before they grow.
A supply chain dashboard helps you predict inventory needs more accurately. You reduce the risk of carrying too much stock or running out of products. This leads to lower costs and better customer satisfaction. Real-time visibility also means you can adjust quickly when market conditions change.
You gain a clear overview of your supply chain, which supports faster and smarter decision-making. By focusing on the right metrics, you ensure your supply chain stays competitive and responsive.
Selecting Key Metrics for Your Supply Chain KPI Dashboard
Choosing the right metrics is the foundation of an effective supply chain KPI dashboard. You need to focus on the indicators that truly reflect your supply chain’s performance. When you select the right KPIs, you gain actionable insights that drive better decisions and improve yoursupply chain analytics.
Common Supply Chain KPIs
You can find many KPIs in supply chain management, but only a few stand out as essential for most organizations. These KPIs help you track performance, identify bottlenecks, and measure progress toward your goals. Here are some of the most common metrics used by leading manufacturers:
Cash-to-Cash Time Cycle
Customer Order Cycle Time
Stocking Cycle Time
Perfect Order Rate
Days Sales Outstanding (DSO)
Supply Chain Costs as a Percentage of Sales
On-Time Delivery Performance
Inventory Turnover Ratio
Inventory Accuracy
Order Cycle Time
Backorder Rate
Supplier Quality
Cost of Goods Sold
You can use these KPIs to monitor different stages of your supply chain. For example, the cash-to-cash cycle time measures how quickly you turn investments into cash flow. The perfect order rate shows how often you deliver orders without errors. Inventory turnover ratio tells you how efficiently you manage your stock.
You should also compare your performance to industry benchmarks. The table below shows typical ranges for two key metrics:
KPI
Benchmark Range
Performance Level
Order Fill Rate
85% - 95%
Typical
95%+
High-performing
On-Time Delivery
70% - 80%
Baseline
85% - 90%
Good
95%+
Excellent
Tracking these benchmarks helps you see where your supply chain dashboard stands compared to others in your industry.
Aligning KPIs with Business Goals
You should not select KPIs at random. Each metric must connect directly to your company’s objectives and supply chain processes. When you align KPIs with your business goals, you ensure that your dashboard supports your overall strategy.
Follow these steps to align your KPIs with your business goals:
Define clear business objectives that match your organization’s direction.
Assess your supply chain capabilities to find strengths and weaknesses.
Identify any gaps between your business objectives and your current supply chain performance.
Develop a shared vision for your supply chain’s future state.
Set specific, measurable, achievable, relevant, and time-bound (SMART) goals for your supply chain.
Foster collaboration across departments to keep everyone aligned.
Measure and monitor performance using your selected KPIs.
Engage in continuous improvement to adapt to changing needs.
You can also use proven frameworks to guide your selection process. The Strategy & Supply Chain Alignment framework helps you connect your corporate and supply chain strategies. The SCOR model breaks down your supply chain into five parts: Plan, Source, Make, Deliver, and Return. This model gives you techniques to measure success at each stage.
When you choose KPIs, think about your strategic priorities. For example, if your goal is cost reduction, you might track supply chain costs as a percentage of sales. If you want to improve customer satisfaction, focus on on-time delivery and perfect order rate. For inventory management, monitor inventory turnover and accuracy.
KPIs are more than just numbers. They give you insights into how well your supply chain is working. They help you manage inventory, meet customer demand, and control costs. By selecting the right metrics, you build a supply chain KPI dashboardthat supports your business and drives continuous improvement.
Calculating and Organizing Supply Chain KPI Dashboard
KPI Calculation Methods
You need to calculate your KPIs accurately to get reliable insights from your supply chain KPI dashboard. Each metric has a standard formula that helps you measure performance consistently. The table below shows how to calculate some of the most common supply chain KPIs:
KPI
Formula
Fill Rate
((Total Number of Items – Number of Shipped Items) / Total Number of Items) * 100
Inventory Days of Supply
Inventory on Hand / Average Daily Usage of Inventory
Freight Bill Accuracy
(Number of Correct Freight Bills / Total Freight Bills) * 100
Days Sales Outstanding
(Account Receivables / Sales) * Days in Period
Inventory Turnover
Cost of Goods Sold / {(Opening Stock – Closing Stock) / 2}
((Total Number of Orders – Number of Error Orders) / Total Number of Orders) * 100
Cash to Cash Cycle Time
Materials Payment Date – Customer Order Payment Date
Customer Order Cycle Time
Actual Delivery Date – Purchase Order Creation Date
You should define these formulas before you start reporting. Standardizing your metrics, such as on-time delivery rate and order accuracy, ensures that your supply chain dashboard provides consistent analytics.
Data Collection and Management
Accurate data collection is the foundation of effective supply chain analytics. You need to automate data gathering to reduce errors and improve quality. Real-time data integration keeps your dashboard current and relevant. Regular monitoring and evaluation help you spot issues early and take corrective action.
Follow these best practices for managing your supply chain KPI dashboard:
Integrate your dashboard with live data sources for up-to-date information.
Set clear data governance policies so everyone understands their role in data collection.
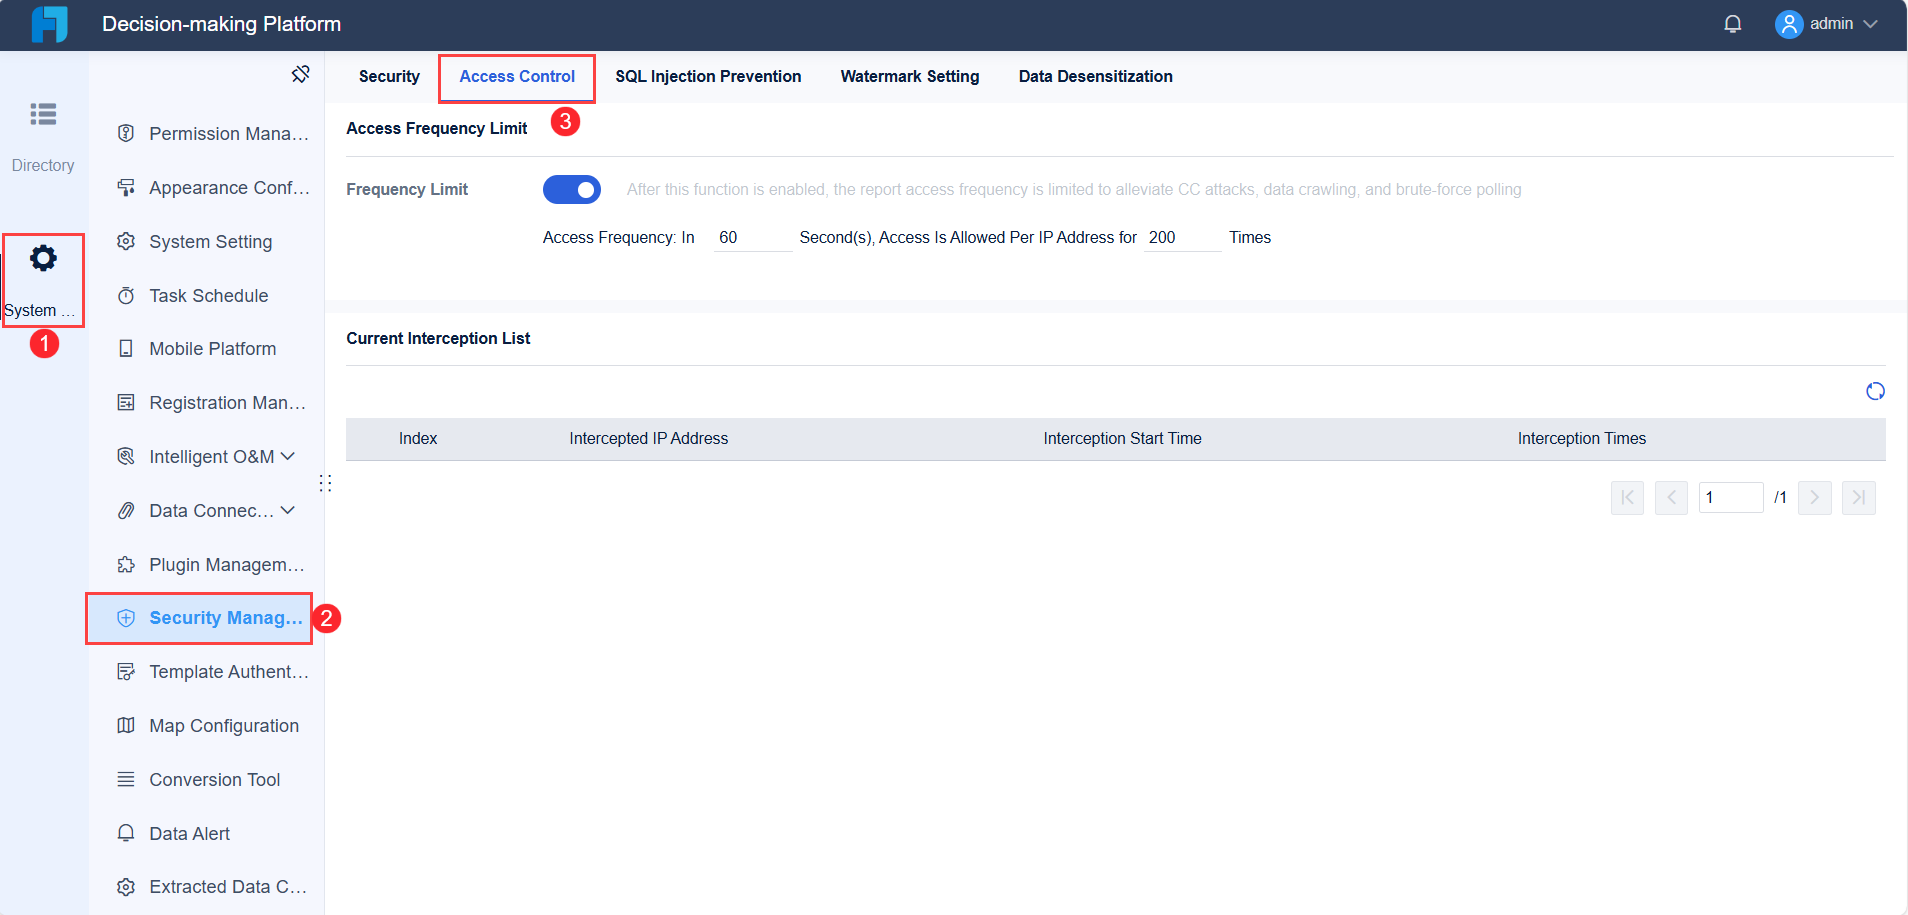
Use user-specific access controls to protect sensitive information and support collaboration.
Focus on the most relevant metrics for your business goals.
Enable intuitive drill-down features so you can explore details behind each KPI.
Companies often face challenges like the need for greater visibility and rising costs. You can address these by aligning your KPI strategy with cost management and transparency. By following these steps, you ensure your supply chain dashboard delivers actionable insights and supports continuous improvement.
Tools for Building a Supply Chain KPI Dashboard
Selecting the right tool is essential when you want to build a supply chain KPI dashboard that delivers real value. You need a platform that can handle complex data, visualize key metrics, and provide actionable insights for your supply chain dashboard. Many organizations struggle with fragmented systems and delayed information, which makes it hard to respond quickly to changes. A modern dashboard solutionshould bring all your data together, update in real time, and allow you to interact with your analytics.
Why Choose FineReport for Dashboards
FineReportstands out as a powerful tool for creating dashboards that support supply chain analytics. You can design a dashboard using a simple drag-and-drop interface, which makes it easy to arrange charts, tables, and visuals. FineReport updates your data in real time, so you always see the latest information. You can customize dashboards for different user roles, ensuring that each team member sees the metrics that matter most. Interactivity lets you drill down into details and set alerts for any kpi anomalies. You can also access your dashboard from any device, which keeps you connected to your supply chain operations at all times.
FineReport offers a range of features that make it effective for building supply chain dashboards:
Feature
Description
Drag-and-drop interface
Simplifies the arrangement of charts, tables, and visuals for professional-looking dashboards.
Real-time data
Allows immediate updates, enabling quick responses to production issues.
Customizability
Dashboards can be tailored to display metrics relevant to different user roles.
Interactivity
Users can engage with the dashboard, drill down into data, and set alerts for anomalies.
Mobile access
Provides real-time updates on key metrics from any device, ensuring connectivity to the factory.
You often face challenges when connecting different supply chain systems to your dashboard. Communication issues between TMS, carriers, and WMS can cause delays and errors. Security concerns may arise if systems do not trust each other, which can lead to data breaches. High integration costs can also make companies hesitate to invest in new solutions. FineReportaddresses these challenges by consolidating data from multiple sources and providing rich visualizations. Unlike specialized tools that focus only on tracking or planning, FineReport gives you a flexible business intelligence layer. This makes it ideal for organizations that want to improve visibility and gain deeper insights from their supply chain analytics.
Supply Chain KPI Dashboard Design and Visualization Best Practices
Dashboard Layout and Components
You need to design your dashboard with clarity and purpose. Start with simplicity. A minimalistic design keeps the focus on your most important numbers. Build a clear hierarchy by placing the most critical metrics at the top. Organize your content so users can follow the flow of information easily. Always provide context for your numbers. For example, compare current performance with past results to help users understand trends.
Consistency matters. Use the same colors, fonts, and graph styles throughout your dashboard. This approach avoids confusion and makes your dashboard look professional. Encourage collaboration by allowing team members to give feedback and update the dashboard in real time.
Here are the best practices for dashboard layout:
Simplicity: Keep the design minimal and focused.
Hierarchy: Highlight key metrics and organize content logically.
Context: Show comparisons to give meaning to numbers.
Consistency: Use uniform design elements.
Collaboration: Enable team feedback and real-time updates.
You can use summary cards for quick views of top metrics. Multi-report views help you display complex information side by side, making it easier to compare different areas of your supply chain.
Visualizing Logistics KPI Dashboard Data
You can turn complex logistics data into clear, actionable insights with the rightvisualization techniques. Use charts, graphs, and infographics to simplify information. Focus on clarity and simplicity to help users understand key metrics quickly. Consistent design elements make your logistics kpi dashboard easy to read and interpret. Storytelling with data helps you connect numbers to real-world actions.
Visualization Technique
Description
Data Visualization
Use charts and graphs to make complex data easy to understand.
Clarity and Simplicity
Choose simple visuals to highlight important metrics.
Consistency
Apply the same design style for all visuals.
Storytelling with Data
Present metrics as part of a narrative for better engagement.
When you visualize your kpi metrics, you improve decision-making and communication. You can spot trends and patterns that raw numbers might hide. Real-time visuals help you respond quickly to changes in your supply chain. Visual alerts and trend indicators also help you manage risks and improve efficiency.
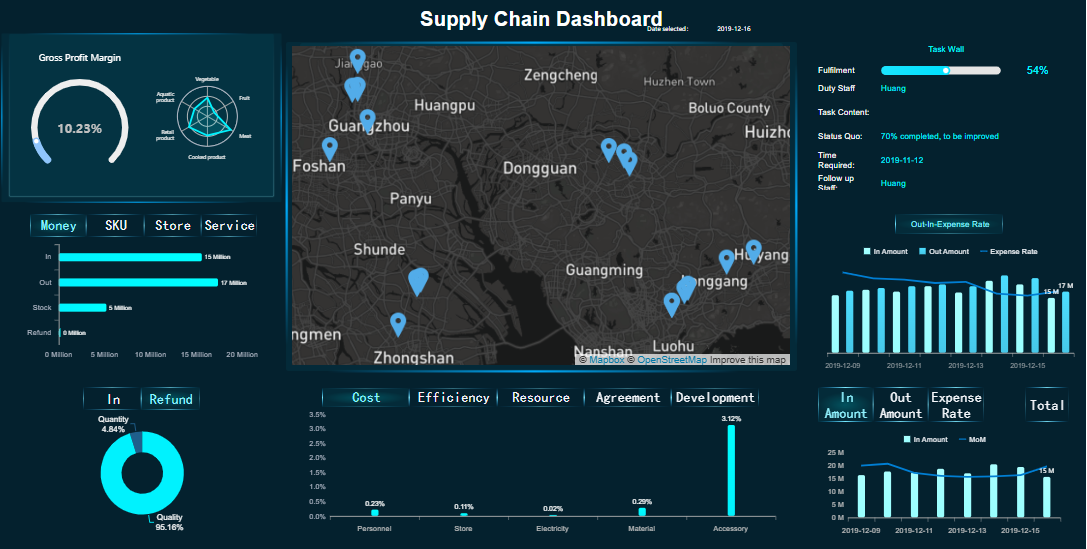
FineReport'sMultiple Built-in Charts For Visualization
Monitoring and Optimizing Your Supply Chain KPI Dashboard
Ongoing Dashboard Review
You need to review yoursupply chain KPI dashboardregularly to keep your analytics relevant and effective. Most organizations find that quarterly or semi-annual reviews work best. This schedule lets you adjust your targets as market conditions change, so your metrics stay aligned with your business goals. When you review your dashboard, you can spot trends, identify issues, and make informed decisions quickly.
To keep your dashboard effective, follow these steps:
Design intuitive and user-friendly interfaces. Make sure your dashboard is easy to navigate and understand.
Ensure real-time data updates and alerts. This keeps everyone informed about important changes.
Monitor and analyze performance. Regularly check your dashboard data to find areas for improvement.
You should also define clear goals, identify the right KPIs, and choose tools that fit your needs. These actions help you maintain a dashboard that supports your supply chain analytics and decision-making.
Improving Supply Chain Performance
You can use several strategies to boost your supply chain performance with your logistics kpi dashboard. The table below highlights proven methods:
Strategy
Description
Example
Ensure Data Accuracy
Use data validation and cleaning to keep information reliable.
Regular inventory audits prevent discrepancies.
Design for Clarity
Use clear labels and visuals for easy interpretation.
Color-coded heat maps show delivery delays quickly.
Incorporate Real-Time Data
Integrate real-time data for timely decisions.
Track shipping statuses and adjust schedules instantly.
Customize for Different Users
Tailor dashboards for each stakeholder’s needs.
Managers see daily operations; executives see strategic KPIs.
Analyze sales data to predict demand and manage inventory.
Regularly Review and Update
Update dashboards to reflect new business objectives.
Add new metrics as your company grows.
Provide Training and Support
Train users to get the most from the dashboard.
Offer workshops or tutorials for employees.
Measure Dashboard Effectiveness
Gather feedback to improve dashboard features.
Use surveys to find out what works and what needs change.
You should adapt your dashboard as your business evolves. Customization and integration help you keep up with new requirements. Real-time updates ensure your dashboard stays useful. Regular reviews and user training make sure everyone can use the dashboard effectively. By following these practices, you can optimize your KPIs and keep your supply chain analytics strong.
Real-World Success: FineReport in Supply Chain KPI Dashboard
Manufacturing Solution Overview
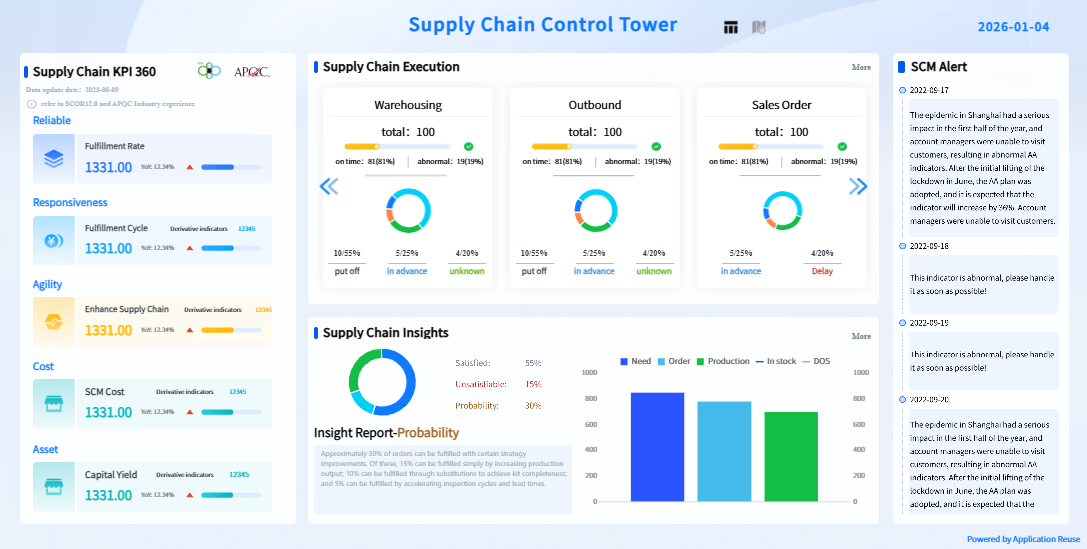
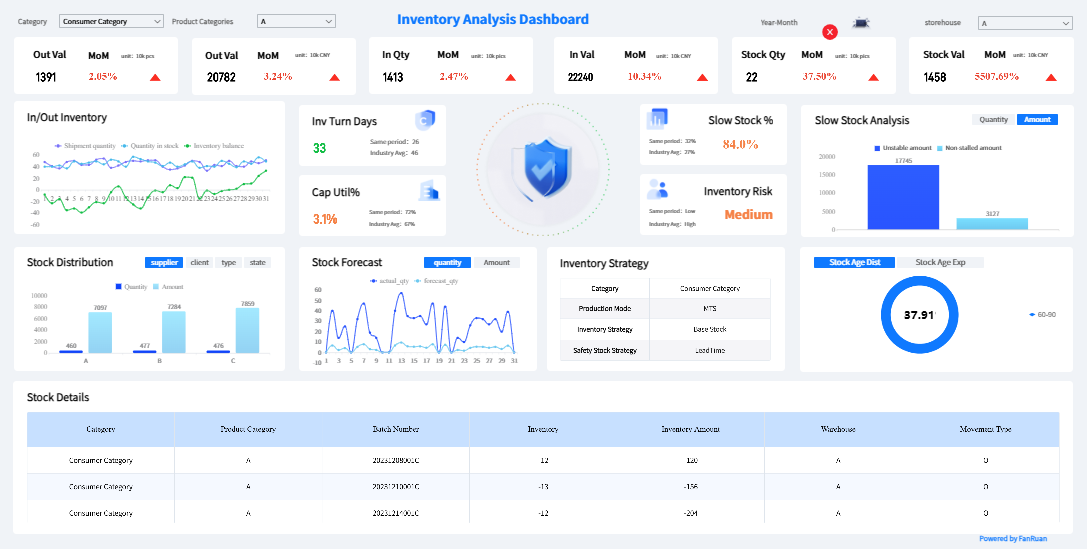
You can see how FineReport transforms supply chain management in manufacturing by providing a digital solution that connects every part of your process. FineReport helps you build a centralized control tower for your supply chain KPI dashboard. You gain real-time visibility into procurement, inventory, and sales. This integration allows you to analyze logistics, financial flows, and information streams all in one place.
FineReport supports your team with features that make collaboration secure and efficient. You can set advanced data permissions, so each user accesses only the information they need. The platform handles large datasets with ease, giving you fast and reliable analysis. Local support ensures you get help tailored to your specific needs. These capabilities help youoptimize your supply chain, reduce costs, and improve decision-making.
Tip: When you use FineReport, you can customize your logistics kpi dashboard to track shipments, monitor supplier performance, and manage inventory trends. This flexibility helps you respond quickly to changes and keep your operations running smoothly.
BOE Technology Group Co., Ltd. faced challenges with fragmented data and inconsistent metrics. You can learn from their experience as they used FineReport to build a unified supply chain KPI dashboard. BOE created a data warehouse to consolidate information from multiple sources. They standardized metric definitions and developed a comprehensive analysis framework.
With FineReport, BOE achieved measurable improvements:
Reduced inventory costs by 5%
Increased operational efficiency by 50%
Enabled real-time monitoring and cross-factory benchmarking
BOE’s dashboard allowed managers to track performance, identify risks early, and compare results across different factories. You can see how a well-designed dashboard supports digital transformation and drives better business outcomes. By following BOE’s example, you can use FineReport to enhance your own supply chain analytics and achieve similar results.
You have learned the essential steps to build a supply chain KPI dashboard. Start by identifying your performance metrics and aligning them with business goals. Use FineReportto integrate data and create a supply chain dashboard that delivers real-time visibility. Review your logistics KPI dashboard regularly to optimize insights and adapt to changes. Explore more resources or request a demo to see how FineReport can transform your dashboard.
Access a wealth of case studies, industry insights, and solution guides to accelerate digital transformation.
FAQ
What is a supply chain KPI dashboard?
You use a supply chain KPI dashboard to track important performance indicators in your supply chain. This tool helps you see real-time data, spot problems early, and make better decisions. You can monitor metrics like delivery times, inventory levels, and order accuracy.
How often should you update your supply chain KPI dashboard?
You should update your dashboard in real time if possible. Real-time updates help you respond quickly to changes. If real-time updates are not possible, you should update your dashboard at least daily to keep your information current.
Who should use a supply chain KPI dashboard?
Managers, analysts, and team leaders in supply chain, logistics, and operations should use this dashboard. You gain insights into performance, identify trends, and improve decision-making. Each team member can focus on the metrics that matter most to their role.
Can you customize the metrics on your supply chain KPI dashboard?
Yes, you can customize the metrics. You should select KPIs that match your business goals and supply chain processes. Customization helps you focus on the most relevant data for your organization.
What are the benefits of using a supply chain KPI dashboard?
You gain better visibility, faster decision-making, and improved efficiency. The dashboard helps you reduce costs, manage risks, and meet customer needs. You can track progress toward your goals and adjust your strategy as needed.