An executive summary dashboard is not a prettier report. It is a decision system for enterprise leaders who need immediate visibility into performance, risk, and strategic priorities without digging through department-level detail.
For CIOs, CFOs, COOs, business unit heads, and strategy leaders, the pain is familiar: data lives in too many systems, definitions vary by team, meetings are dominated by reconciling numbers, and dashboards look polished but fail to support real decisions. A strong executive summary dashboard fixes that. It compresses enterprise complexity into a trusted, high-signal view that helps leadership act faster on growth, efficiency, customer outcomes, and risk.
The key is not starting with charts. It is starting with decisions.
All dashboards in this article are created by FineBI
What an Executive Summary Dashboard Should Deliver for Enterprise Leaders
A high-performing executive summary dashboard should give leaders a fast read on what matters most right now: whether the business is on track, where risk is rising, and which priorities require intervention.
Unlike operational dashboards, which support daily execution, an executive summary dashboard is designed for cross-functional leadership review. It should answer questions such as:
Are we hitting growth and profitability targets?
Where are the biggest execution risks this quarter?
Which business units are outperforming or underperforming?
What requires escalation or reallocation of resources?
What changed since the last review, and why?
Executives use summaries differently from frontline teams. They do not want dozens of filters, transaction detail, or isolated departmental metrics with no context. They want a concise view that connects results to strategic objectives and clarifies where action is needed.
Before you choose metrics or visuals, define the decisions the dashboard must support. If the dashboard is meant for board preparation, the view will emphasize enterprise outcomes, trend direction, and risk exposure. If it is for the monthly executive operating review, it may also need alerting, owner commentary, and drill paths into business units or regions.
Step 1: Define the Business Questions and KPI Framework
Identify the strategic decisions leaders need to make
Every executive summary dashboard should begin with a short list of strategic decisions. This prevents the common enterprise failure mode: packing every available metric into one screen and calling it “executive visibility.”
Map the dashboard to the major outcomes leadership actually manages:
Risk and compliance: incident levels, audit issues, SLA breaches, control failures
You should also separate board-level questions from department-level reporting needs. Board-level views focus on trajectory, enterprise risk, and strategic execution. Department heads may need deeper explanations, but that depth should sit behind drill-downs, not clutter the summary layer.
Select a focused set of KPIs
An executive summary dashboard works best when it stays selective. Most enterprise teams overestimate how many KPIs executives can meaningfully absorb in a single review. In practice, fewer metrics create better conversations.
Choose a balanced mix of:
Leading indicators: metrics that signal future performance, such as pipeline coverage, backlog, employee attrition risk, or support ticket backlog
Lagging indicators: metrics that confirm outcomes, such as revenue, churn, profit margin, or customer satisfaction
Each KPI should have four foundations:
Definition: what exactly is measured
Owner: who is accountable for its integrity and interpretation
Target: what success or acceptable variance looks like
Cadence: how often it updates and how often leadership reviews it
A good rule: if a KPI cannot be explained in one sentence, it likely does not belong in the top layer of an executive summary dashboard.
Key Metrics (KPIs)
Below is a practical KPI structure enterprise leaders can use as a featured-snippet-ready framework:
Revenue Growth: Measures whether top-line performance is expanding versus target or prior period.
Operating Margin: Shows how efficiently the business turns revenue into operating profit.
A strong executive summary dashboard respects how leaders scan. They move top-left to top-right, then downward, looking first for variance, exceptions, and strategic signals.
That means the most critical information belongs above the fold, including:
Core KPI scorecards
Major red/yellow alerts
Trend direction versus target
Brief executive commentary
Below that, organize related measures into business-friendly sections such as:
Financial performance
Operational performance
Customer outcomes
Risk and compliance
This structure helps leaders process the dashboard in layers: overall status first, then domain-specific context.
Use visual hierarchy that supports quick interpretation
The best executive summary dashboard designs are visually disciplined. Their purpose is not to impress; it is to reduce interpretation time.
Use visual hierarchy intentionally:
Make key KPIs large and immediately readable
Use consistent color logic for status, such as green for on track, amber for watch, red for action required
Reserve bold colors for exceptions, not decoration
Favor familiar chart types like line charts, bar charts, bullet charts, and sparklines
Show targets and prior-period comparisons wherever possible
To reduce clutter:
Minimize filters on the summary page
Avoid 3D charts, gauges, and decorative icons
Limit the number of colors
Remove any widget that does not support a decision
A common executive design mistake is mixing too many visual conventions on one page. If one KPI uses year-over-year variance, another uses target gap, and a third uses raw totals only, leaders must mentally recalculate meaning. Standardization is a major speed advantage.
Review proven executive dashboard patterns
Different executive audiences benefit from different summary patterns:
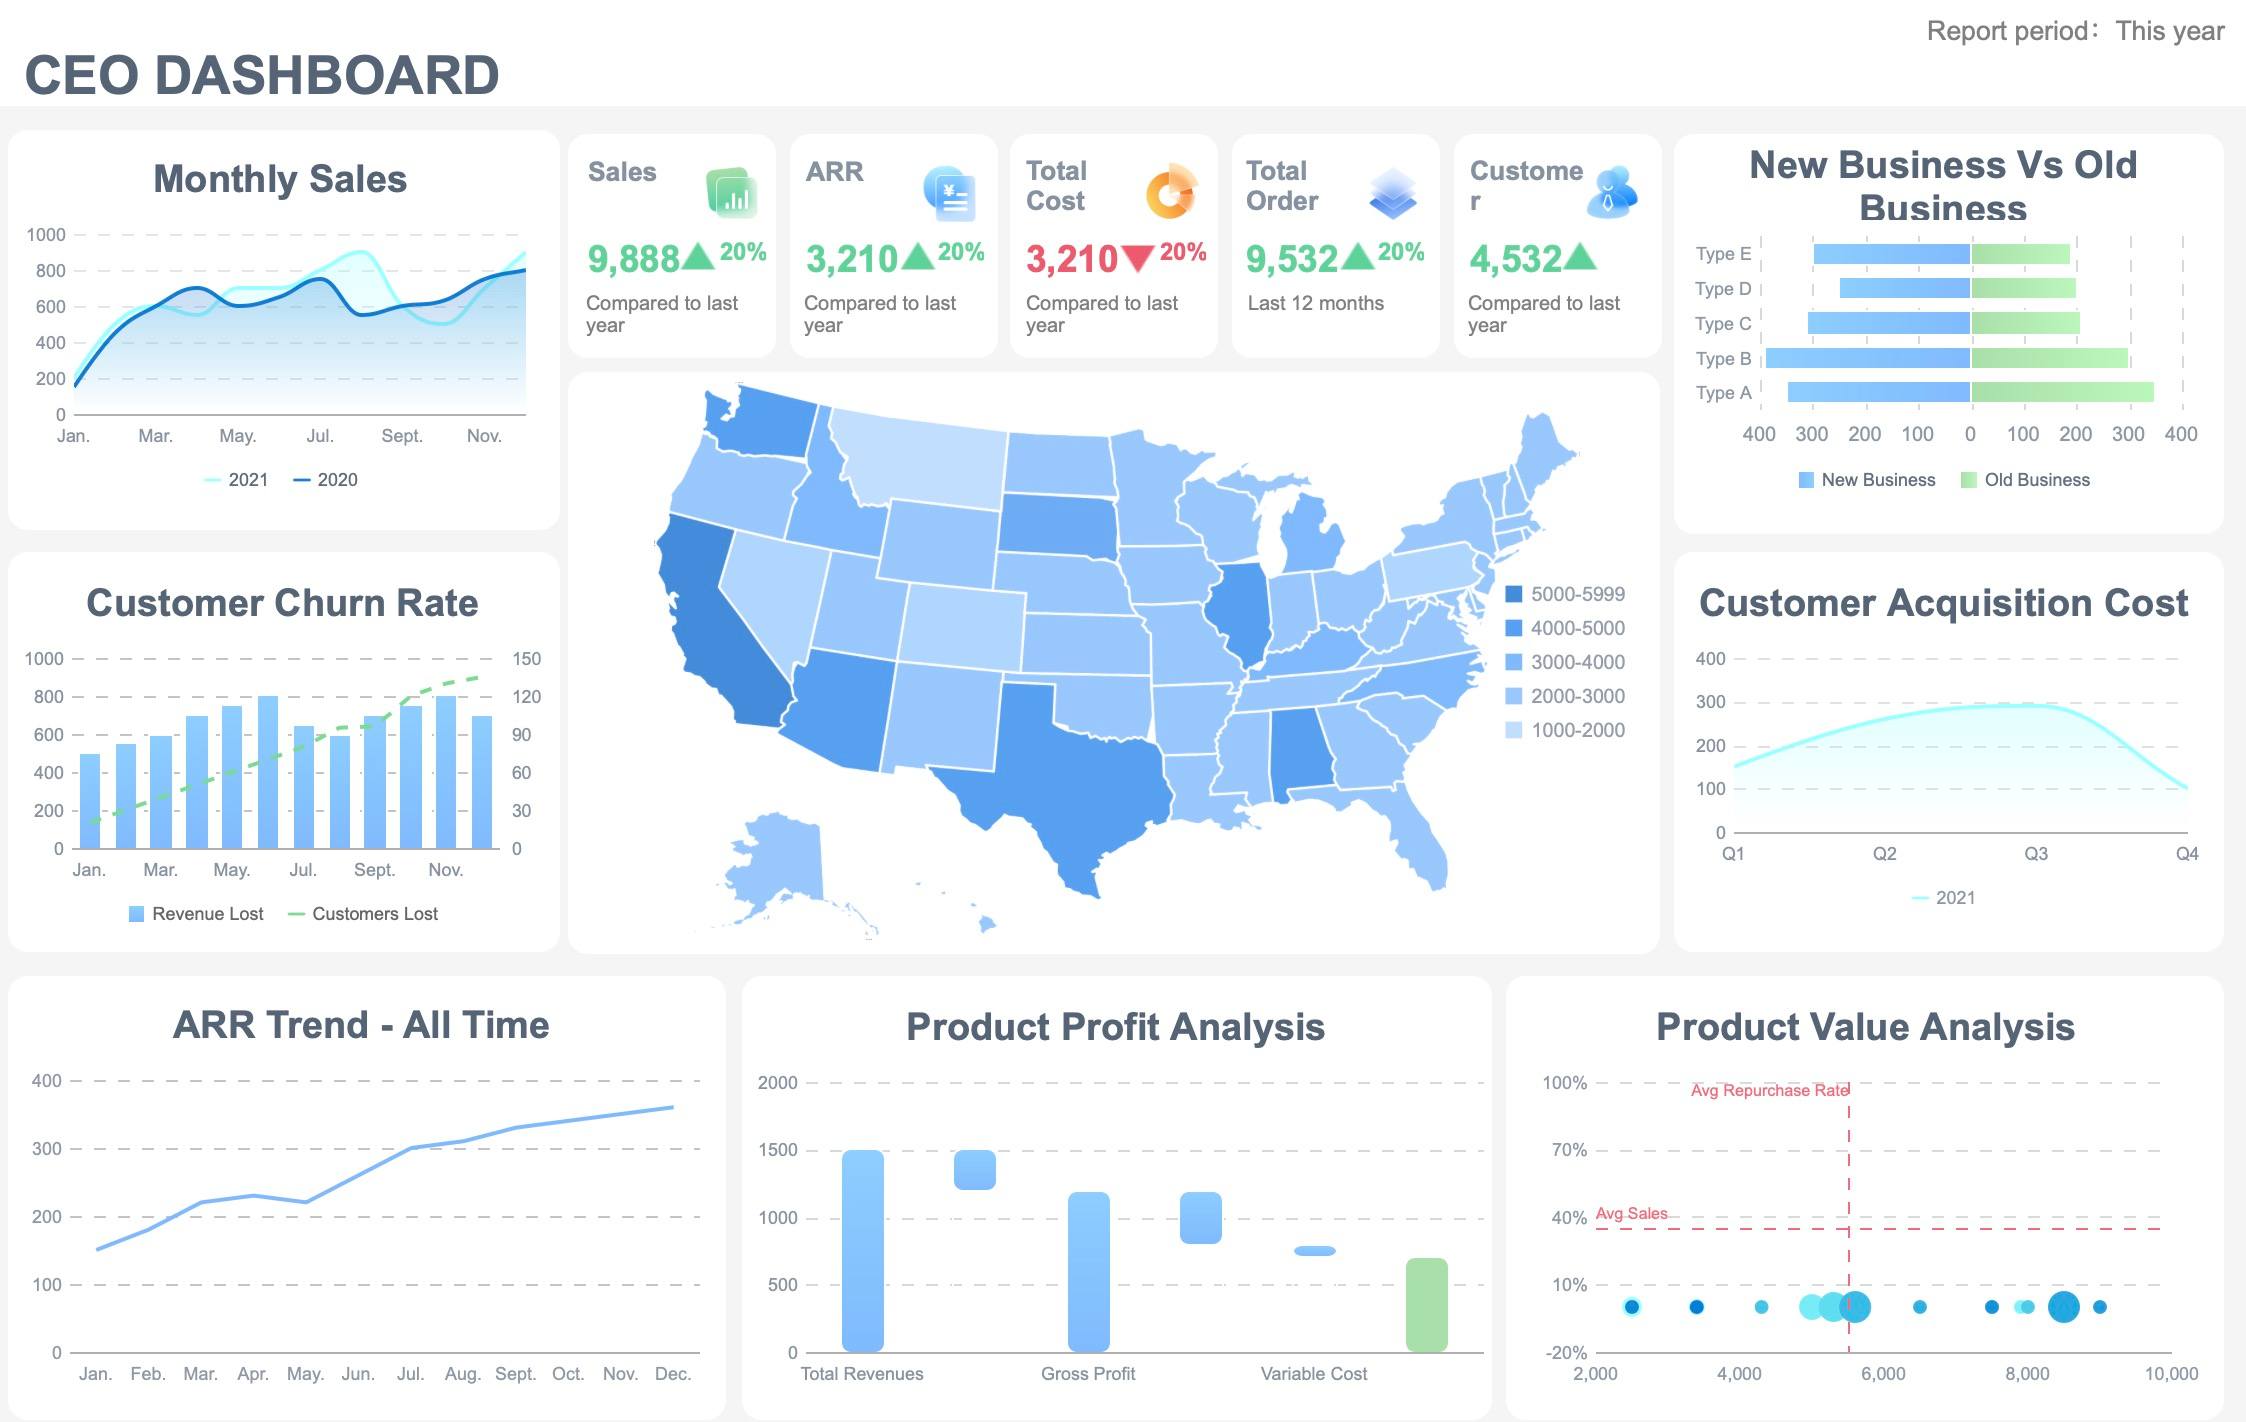
CEO dashboard: broad cross-functional view with emphasis on growth, profitability, execution risk, and strategic initiatives
CFO dashboard: stronger focus on margin, cash, forecast variance, and capital discipline
COO dashboard: concentration on throughput, service levels, cost efficiency, and bottlenecks
Board dashboard: fewer metrics, more trend framing, risk indicators, and narrative context
Industry also shapes layout. A SaaS company may prioritize ARR, churn, NRR, and product adoption. A manufacturer may emphasize plant performance, inventory turns, safety incidents, and order fulfillment. A bank may foreground liquidity, risk exposure, compliance status, and customer growth.
The design pattern should reflect decision context, not BI fashion.
Step 3: Build Trust with Data Quality and Governance
Standardize definitions and data sources
A dashboard without governance becomes a negotiation tool instead of a decision tool. If finance, operations, and sales calculate the same metric differently, leaders stop trusting the executive summary dashboard entirely.
Start by creating a shared metric dictionary that includes:
KPI name
Business definition
Formula
Inclusion and exclusion rules
Source system
Update frequency
Owner and approver
This creates one version of the truth. It also shortens meeting time because executives spend less energy debating definitions.
Documenting source systems matters just as much. Enterprise dashboards often pull from ERP, CRM, HRIS, data warehouses, spreadsheets, and third-party tools. If refresh schedules differ or logic changes without notice, trust erodes quickly.
Assign ownership and review workflows
Governance is operational, not theoretical. Every KPI on an executive summary dashboard should have named responsibility.
Metric owner: accountable for interpretation and business action
Dashboard owner: responsible for curation, usability, and change control
Executive sponsor: ensures adoption in leadership routines
Then define review workflows:
Who validates data before executive meetings
Who investigates anomalies
Who approves KPI definition changes
Who communicates known data issues
Who signs off on release updates
Without this workflow, dashboards drift. Teams add metrics, rename fields, and change calculations in ways that confuse leadership and weaken consistency over time.
Protect access and compliance
Executive summary dashboards often contain highly sensitive data: financial results, people metrics, strategic forecasts, customer performance, and incident data. Governance must therefore include access control and compliance design from the beginning.
Use:
Role-based permissions to restrict views by leadership role, region, or business unit
Row-level security where leaders should see only approved slices of data
Audit trails for access, edits, and definition changes
Change management controls for production updates
Compliance alignment with internal audit, security, privacy, and regulatory requirements
This is especially important in regulated sectors where dashboards can expose material, personal, or restricted data.
Step 4: Turn the Dashboard into an Executive Operating Tool
Add context, not just numbers
Executives do not need a wall of numbers. They need enough context to understand what changed, why it matters, and what should happen next.
That context can be lightweight but powerful:
Short commentary beside a KPI cluster
A note explaining a major variance
Root-cause summaries for negative trends
Recommended action or decision request
Benchmark or target comparisons
For example, “Retention declined 2.1 points due to two enterprise account renewals slipping into next month” is more useful than a red retention tile alone.
The best executive summary dashboard designs combine quantitative insight with concise narrative framing.
Create a decision and meeting rhythm
A dashboard only becomes valuable when it is embedded in how leadership operates. That means linking it to a recurring review cadence.
A practical rhythm looks like this:
Weekly: monitor fast-moving alerts, major risks, and operational exceptions
Monthly: review KPI trends, root causes, and corrective actions
Quarterly: evaluate strategic progress, investment shifts, and target resets
Use the executive summary dashboard as the agenda backbone for those meetings. Each KPI should answer one of three questions:
Are we on track?
If not, why not?
What decision or action is required?
To strengthen accountability, tie dashboard reviews to action management:
Assign owners to underperforming KPIs
capture decisions made in the review
track follow-up dates
revisit unresolved issues in the next cycle
That is when the dashboard stops being a report and starts functioning as an executive operating system.
Step 5: Improve with Feedback, Templates, and Real-World Examples
Test usability with executive stakeholders
No executive summary dashboard should be considered finished after first launch. Real usability appears only when senior leaders use it under time pressure.
Watch how executives actually engage with the dashboard:
What do they look at first?
Where do they hesitate?
Which labels confuse them?
Which visuals require explanation?
What do they ask for repeatedly?
This testing often reveals simple but high-impact improvements:
clearer KPI names
more intuitive section order
fewer summary tiles
stronger drill paths
better annotation of targets and benchmarks
If leaders need a presenter to decode the dashboard every time, the design is not yet doing its job.
Learn from templates and implementation examples
Templates accelerate design, especially for enterprise teams that need to align multiple stakeholders quickly. A good template gives you a proven structure for summary rows, domain sections, trend views, and commentary areas.
Templates are especially useful when comparing implementation approaches across BI environments, including Tableau and other enterprise analytics tools. However, teams should not copy layouts blindly. Evaluate each template against three realities:
the maturity of your KPI model and operating cadence
Use examples to shorten debate, not replace design thinking.
Build an iteration roadmap
A successful executive summary dashboard evolves in phases. Start with a narrow, trusted version and expand based on real usage.
A practical roadmap may include:
Launch the core executive layer with 8 to 12 enterprise KPIs.
Add commentary, benchmarks, and prior-period comparisons.
Introduce drill-down paths by region, business unit, or function.
Expand governance controls, ownership workflows, and auditability.
Integrate additional data domains and predictive signals over time.
This phased model reduces rollout risk and protects dashboard quality as adoption grows.
4 Actionable Best Practices for Implementing an Executive Summary Dashboard
Here is the practical consultant view: enterprise dashboard success depends less on tooling and more on disciplined implementation.
1. Start with decisions, not data
Interview executive stakeholders and identify the top 5 to 10 decisions the dashboard must support. Build the KPI framework around those decisions, not around what happens to be easiest to extract from source systems.
2. Limit the first release aggressively
Keep the first version of the executive summary dashboard focused and scannable. If everything is “important,” nothing is. Launch with the smallest set of metrics that can support the executive review rhythm.
3. Define governance before rollout
Do not wait until after launch to document metric definitions, owners, source systems, and refresh schedules. The earlier governance is formalized, the faster trust builds.
4. Design for meeting use, not solo browsing
A dashboard used in executive reviews needs clear sequencing, status logic, and action framing. Build each section to support the conversation leaders actually have in weekly, monthly, and quarterly forums.
Build Faster and Scale Smarter with FineBI
Designing an enterprise-grade executive summary dashboard manually is possible, but it is rarely efficient. You need KPI modeling, cross-source integration, visual consistency, permissions, governance, refresh management, and scalable templates. That complexity grows fast as stakeholders, business units, and data sources expand.
This is where FineBI becomes the practical answer.
Building this manually is complex; use FineBI to utilize ready-made templates and automate this entire workflow.FineBI helps enterprise teams accelerate executive dashboard delivery with reusable dashboard structures, governed data models, role-based access, and interactive analysis that supports both summary visibility and drill-down investigation.
For organizations that need to move from fragmented reporting to a trusted executive operating layer, FineBI enables you to:
control permissions for sensitive leadership views
automate refreshes and reduce manual reporting effort
support iterative expansion as governance matures
Utilize ready-made templates and automate this entire workflow with FineBI
If your current dashboard process depends on spreadsheets, slide decks, and manual metric reconciliation, the issue is not just inefficiency. It is decision friction. FineBI helps remove that friction by turning the executive summary dashboard into a scalable, governed, enterprise-ready system for leadership visibility.
An executive summary dashboard is a high-level decision view that brings together the most important enterprise KPIs, risks, and trends in one place. It helps senior leaders assess performance quickly without getting lost in operational detail.
It should include a focused set of company-level KPIs tied to strategic goals, such as revenue growth, margin, cash flow, customer retention, forecast accuracy, and risk indicators. Clear targets, trend context, and ownership should also be visible.
Most executive dashboards work best with a limited number of KPIs that leaders can review in a few minutes. A smaller set of well-defined metrics usually drives better decisions than a crowded screen.
An executive summary dashboard is designed for cross-functional leadership decisions and focuses on enterprise outcomes, exceptions, and strategic progress. An operational dashboard supports day-to-day execution and usually contains more granular metrics and workflow detail.
KPI governance ensures each metric has a clear definition, owner, data source, refresh schedule, and target. This improves trust in the numbers and reduces time wasted in meetings debating whose version is correct.
Product Trial
FineReport
Pixel-perfect reports · Interactive dashboards · Easy data entry · Digital twins

 Building this manually is complex; use


