An application monitoring dashboard is a single, actionable view of your app’s health, performance, availability, and user experience. For IT managers, operations leads, SREs, and developers, its business value is simple: it shortens the time between “something feels wrong” and “we know what to do next.” Instead of bouncing between logs, alerts, metrics tools, and support tickets, teams get one place to detect problems, validate severity, and prioritize response before customers feel the impact.
All dashboards in this article are built with FineBI.
An application monitoring dashboard brings together the most important telemetry from your application stack into a format people can read quickly and act on immediately. That includes backend performance, infrastructure conditions, dependency health, availability, and customer-facing indicators such as page speed or request success.
For beginners, this matters because raw monitoring data is rarely decision-ready. A thousand log lines may confirm that errors exist, but they do not instantly answer operational questions like:
A well-designed dashboard turns fragmented signals into operational clarity. It helps teams move from reactive firefighting to faster triage, cleaner handoffs, and more consistent reporting.
Raw monitoring data and a dashboard are not the same thing. Raw data is the input: logs, traces, metrics, events, and alerts. A dashboard is the layer that organizes that data around decisions. In practice, that means highlighting only the metrics and visualizations that answer urgent questions, rather than showing everything the monitoring stack can collect.
For enterprise teams, this distinction is critical. When incidents happen, people do not need more data—they need the right context, at the right level, in the right order.
The fastest way to understand an application monitoring dashboard is to know the core metrics it should contain. These KPIs tell you whether the app is fast, stable, available, and meeting user expectations.
The most common starting point for any application monitoring dashboard is performance and reliability.
These metrics show how quickly your app handles requests. Beginners often treat them as interchangeable, but they answer slightly different questions. Response time usually measures how long the app takes to serve a request. Latency often reflects broader delay across the transaction path, including network and dependency effects.
If response time rises, users notice slowness. If latency spikes across multiple services, the issue may be deeper than one endpoint.
Throughput tells you how much work the application is processing. This could be requests per second, transactions per minute, or jobs completed per hour. On its own, high throughput is not bad. But if throughput rises while latency and error rates worsen, the system may be under strain.
Error rate is one of the most important signals in an application monitoring dashboard. A spike in 5xx responses, failed API calls, or application exceptions usually means customers are already affected—or will be soon.
These metrics show whether the service is operational and reachable. They are essential for SLA and SLO tracking. An app can be technically “up” but still unusable due to slow responses or broken dependencies, which is why availability should be read alongside latency and error metrics.
Together, these metrics reveal both user-facing pain and backend instability. If p95 latency rises before the error rate climbs, your team may have a window to intervene before a full outage develops.
An application rarely fails in isolation. It depends on compute, storage, networks, databases, caches, queues, and external APIs. That is why an effective application monitoring dashboard must include infrastructure and dependency visibility.
These are foundational resource indicators:
A healthy application can still feel broken if infrastructure is constrained underneath it.
Databases are frequent performance bottlenecks. Slow queries, lock contention, connection pool exhaustion, or replication lag can degrade the entire application. Your dashboard should make database status visible, not buried in a separate admin console.
Modern apps depend heavily on external services for payments, identity, messaging, analytics, and content delivery. If one of those dependencies fails, your internal service may appear healthy while users still cannot complete key actions.
This is why dependencies matter so much: they can make an otherwise healthy app feel slow, partial, or completely broken. For enterprise environments, dependency monitoring is often the difference between guessing and proving root cause.
Technical monitoring is necessary, but not sufficient. Senior decision-makers also need to understand whether performance degradation is affecting customer experience and business outcomes.
Apdex translates technical response times into a simple user satisfaction score. It helps non-technical stakeholders quickly understand whether the experience is acceptable.
Page load speed matters for web applications because users judge your system by what they see, not by backend averages. A backend can look acceptable while frontend rendering remains slow.
This metric complements error rate by showing how often the system completes work successfully. It is especially useful for dashboards shared with support and business teams.
The most mature application monitoring dashboard connects performance to business signals:
You should connect technical signals to business outcomes when downtime, latency, or failed requests directly influence revenue, retention, or service commitments. This is especially important in e-commerce, SaaS, financial services, and customer support platforms.
Widgets determine whether a dashboard helps or hinders incident response. The same metric can be useful or useless depending on how it is visualized.
A practical application monitoring dashboard usually combines several widget formats, each serving a different diagnostic purpose.
Best for showing trends over time, such as latency, throughput, CPU, or error rate. They are ideal for spotting spikes, regressions, and release-related changes.
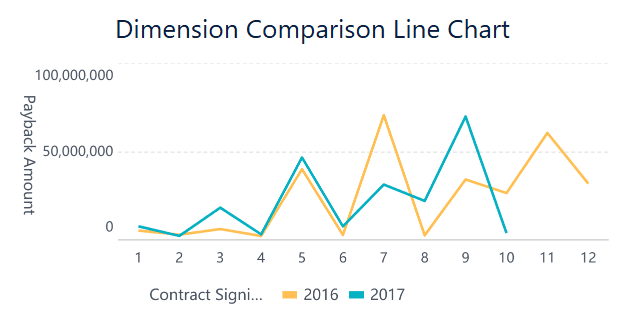 Line Chart built by FineBI
Useful for comparing categories, such as error counts by service, API endpoint, region, or environment.
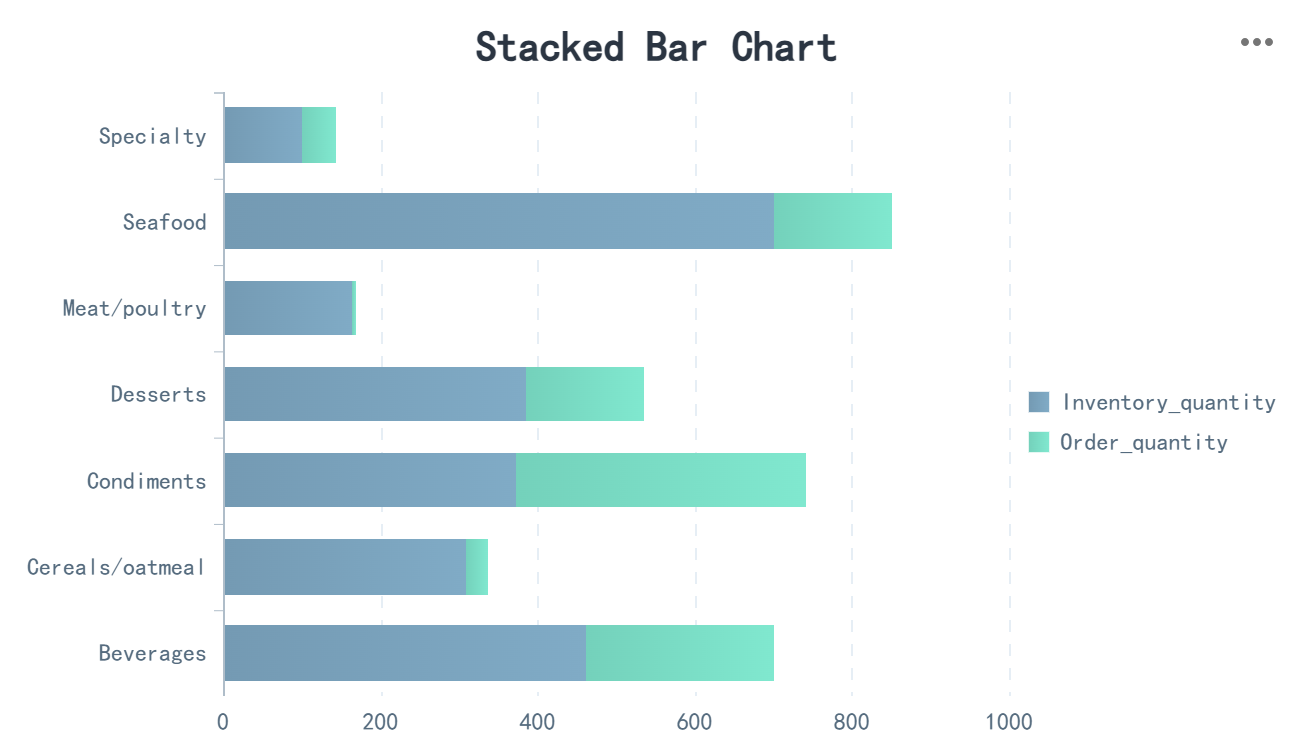 Bar Chart built by FineBI
Strong for visualizing density and variation, such as latency percentiles across endpoints or traffic by hour and geography. Beginners often underuse heatmaps even though they are excellent for pattern detection.
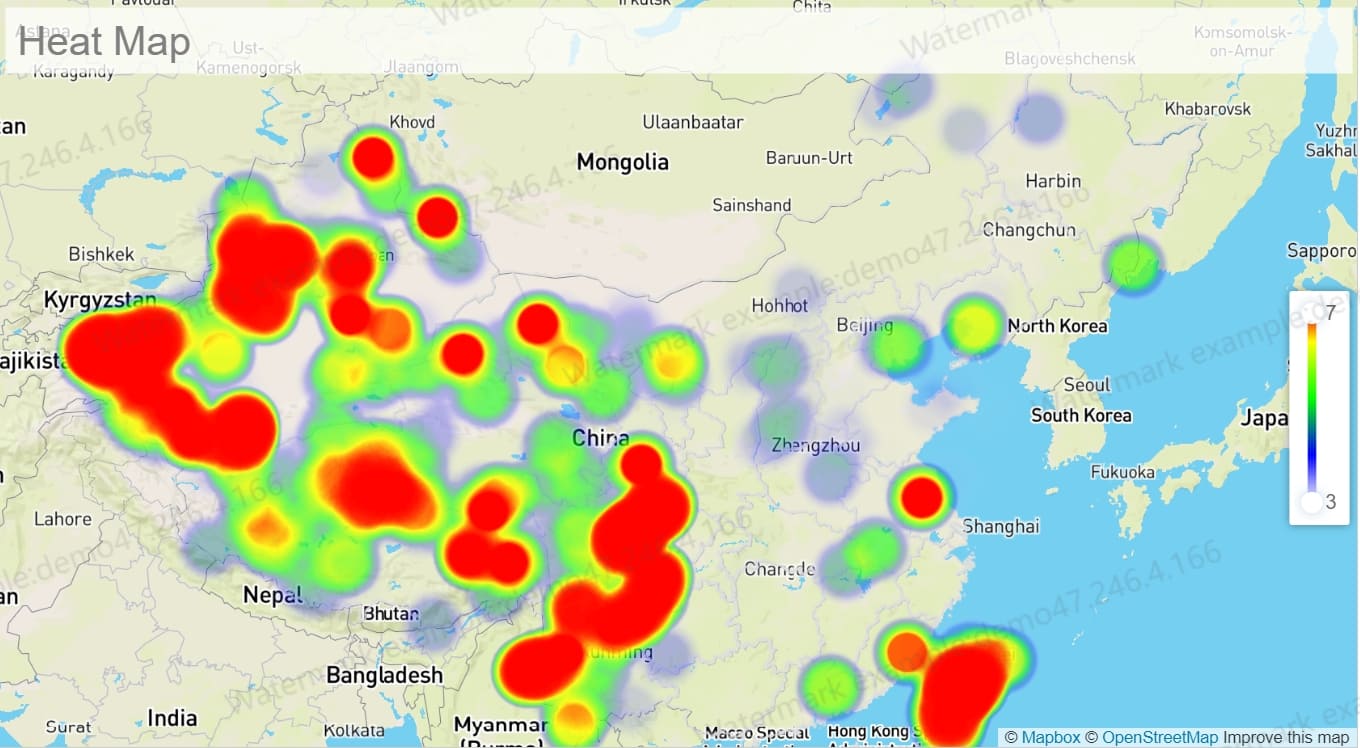 Line Chart built by FineBI
Tables work well for ranked operational views:
Gauges are helpful for single-threshold metrics like CPU usage or storage capacity, but they are often overused. They look intuitive, yet they show little historical context.
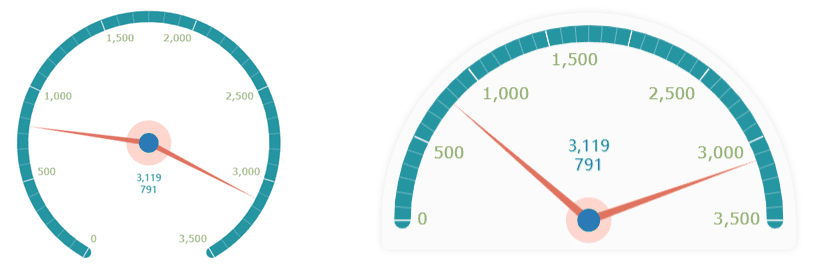 Gauge built by FineBI
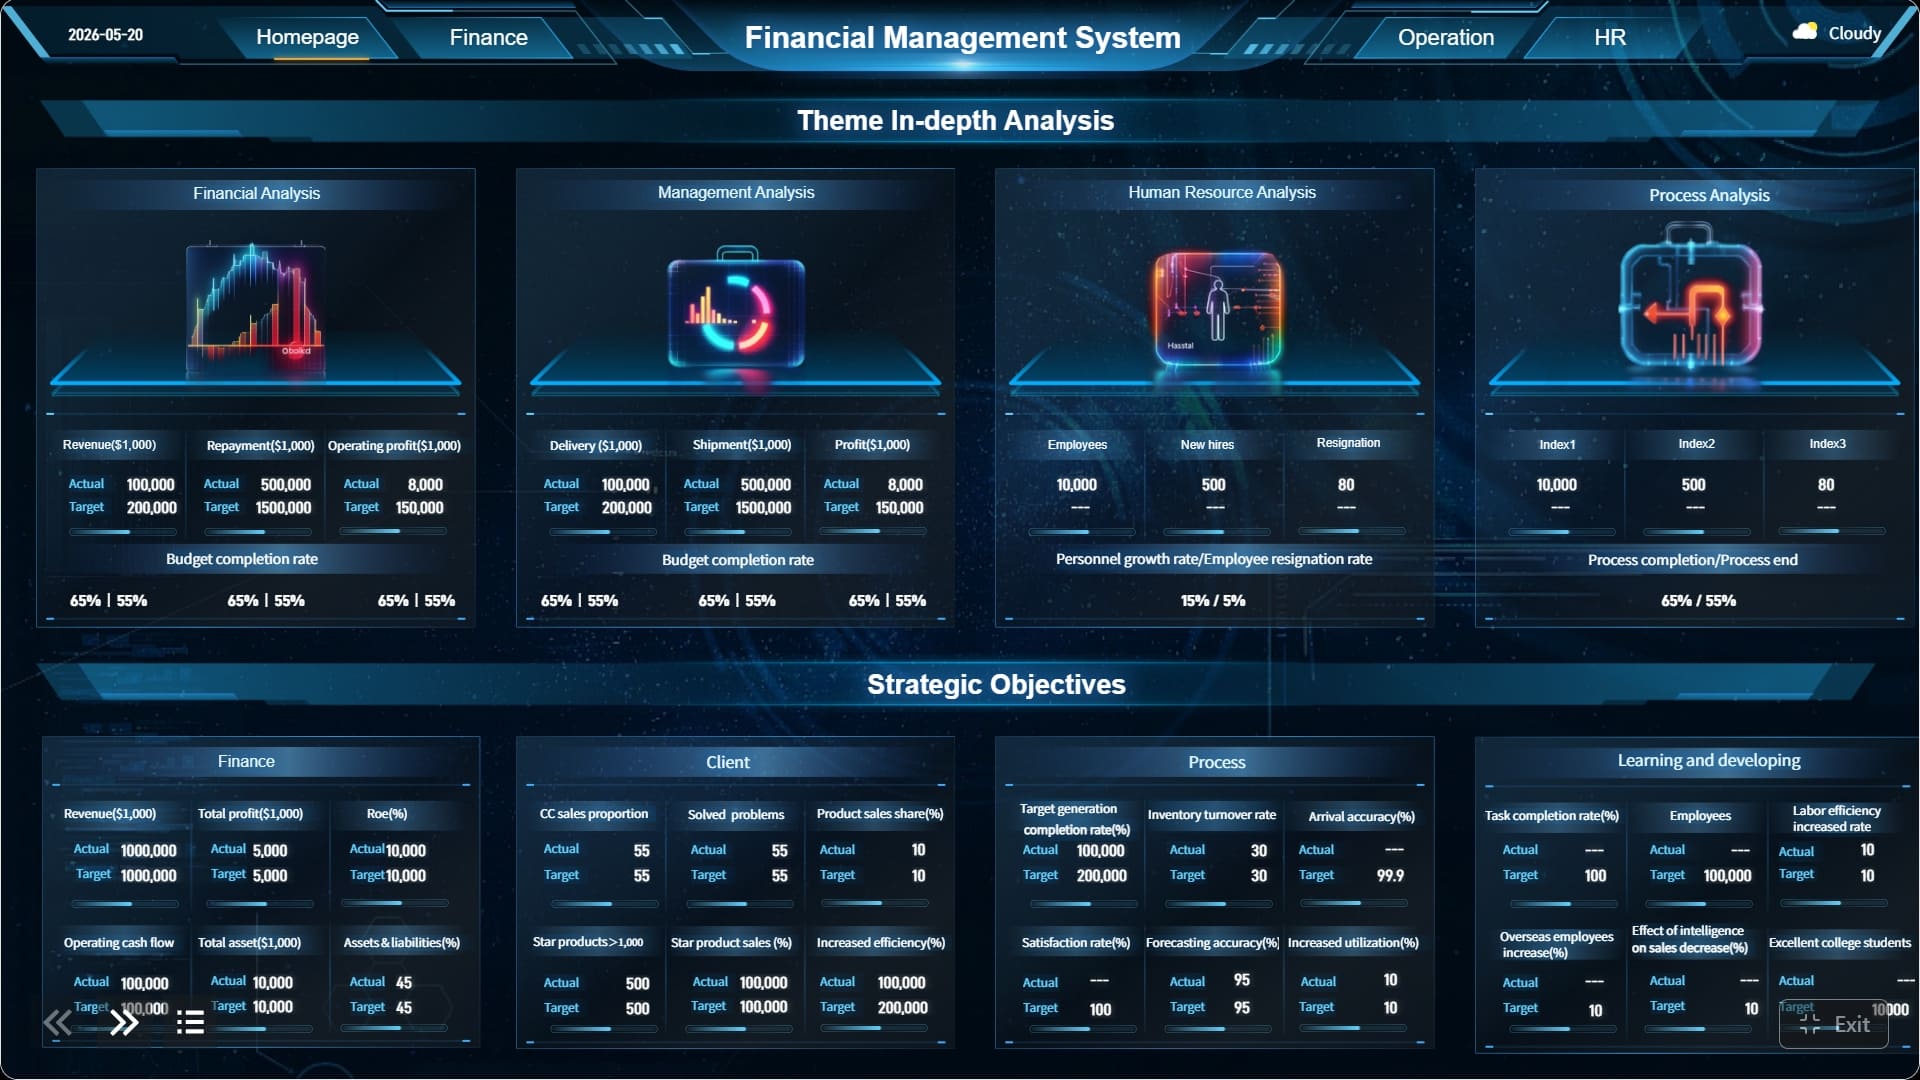
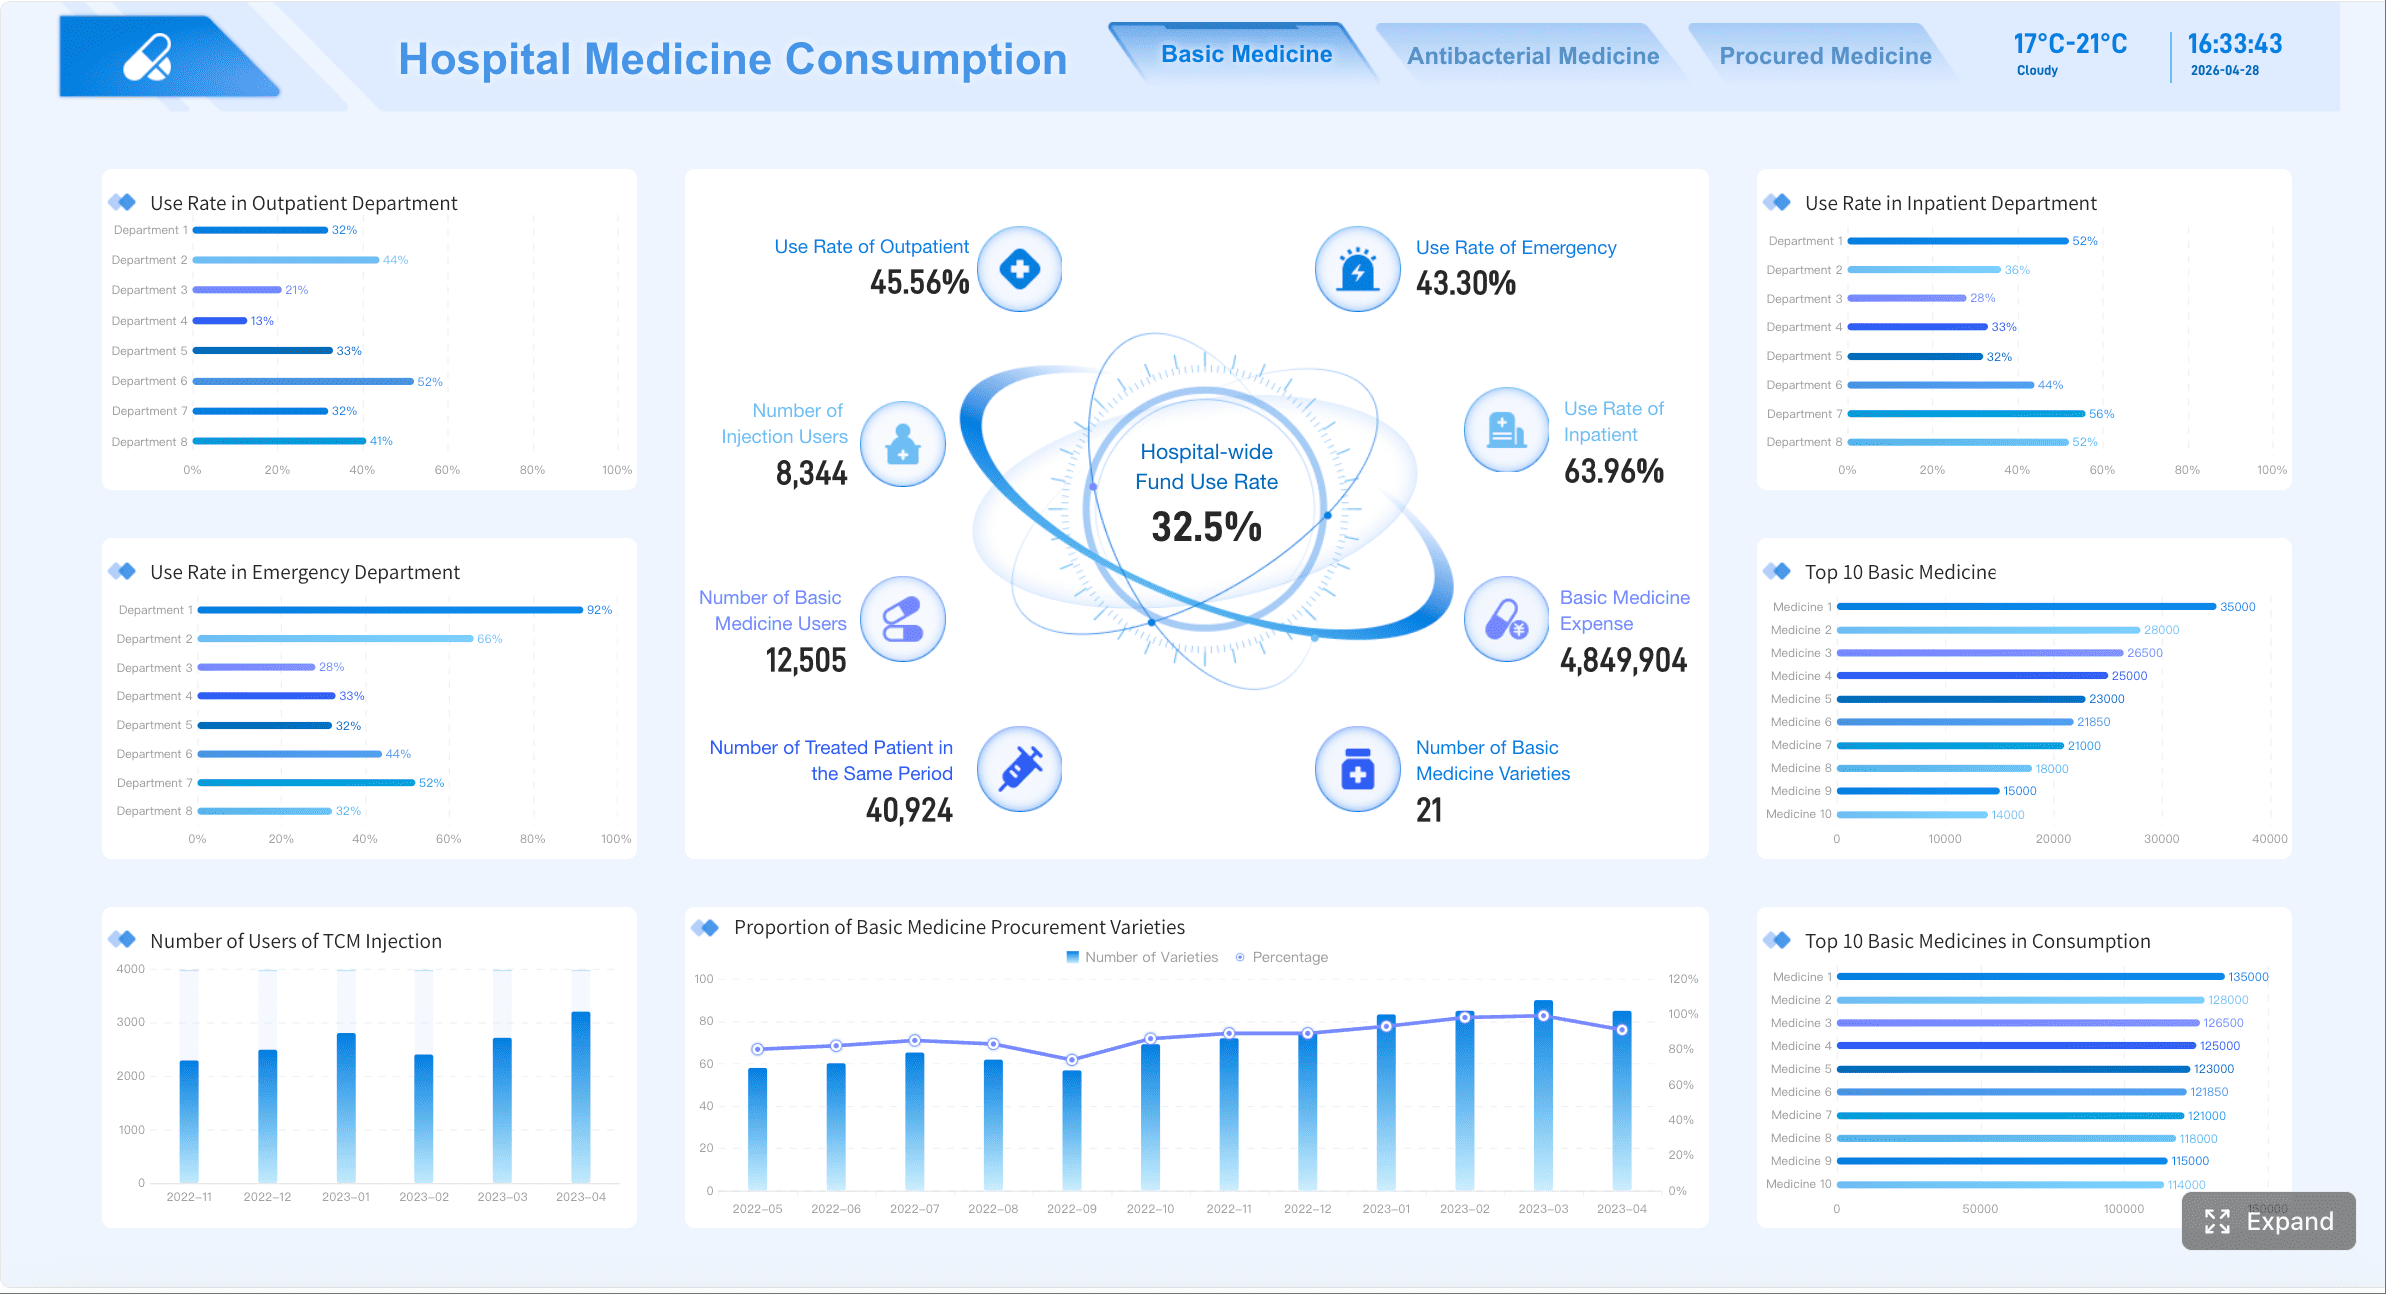
Status cards are excellent at the top of the dashboard. They show at-a-glance signals like service state, active incident count, request success rate, or current availability.
A dashboard does not replace log analysis, but embedding a focused logs panel can speed investigation by surfacing recent error messages tied to active issues.
These widgets help validate whether a dashboard trend is already triggering alert conditions and which systems are involved.
A common beginner mistake is using the wrong widget for the wrong job. For example:
Layout is not cosmetic. During an incident, layout determines whether teams diagnose quickly or waste time scanning noise.
A strong troubleshooting structure looks like this:
The top of the application monitoring dashboard should answer four questions instantly:
Good grouping options include:
A cluttered dashboard becomes useless during pressure. Remove duplicate charts, limit color overload, and avoid squeezing every metric onto one screen.
For enterprise teams managing many systems, role-based dashboard design is often more effective than one universal dashboard. Executives need service status and impact. SREs need incident context and dependencies. Developers need endpoint, trace, and query details.
An application monitoring dashboard is valuable because it supports real operational scenarios, not just passive visibility.
In daily operations, teams use the dashboard to spot anomalies before they become outages. Examples include:
During incident response, the dashboard helps confirm whether an alert is real, estimate blast radius, and narrow likely causes. Instead of debating whether the issue is frontend, backend, infrastructure, or a dependency, responders can check a unified operational view.
For outages and slowdowns, the dashboard often becomes the command center. It gives engineering, operations, and support a shared source of truth while responders investigate deeper in logs and traces.
A good application monitoring dashboard is not only for emergencies. It also supports planning.
Over time, trend data reveals:
Comparing environments and releases is especially useful. If staging behaves well but production latency rises after a release, the dashboard can expose scale-related or dependency-specific differences quickly.
One of the most overlooked benefits of an application monitoring dashboard) is communication. It creates a common operational language across technical and non-technical teams.
Examples of role-based views include:
| Audience | Dashboard Focus |
|---|---|
| Executives | Availability, SLA/SLO status, business impact, incident summary |
| SRE / Ops | Service health, alerts, dependencies, infrastructure saturation |
| Developers | Endpoint latency, error traces, deployment changes, query performance |
| Product Teams | User experience, page speed, conversion impact, usage patterns |
| Support Teams | Incident status, affected journeys, regional impact, request success rate |
When everyone looks at the same core picture, status updates become faster, escalations cleaner, and post-incident reviews more objective.
Different tools approach the application monitoring dashboard in different ways. Some emphasize APM and observability. Others focus on BI-style flexibility for cross-functional reporting.
Most modern application performance monitoring platforms include built-in support for:
These platforms usually provide default dashboard templates so teams can get started quickly. Their real advantage is correlation: they connect telemetry types so that a slow request, failing service, and affected dependency can be explored together.
Modern APM tools turn complex telemetry into action by surfacing patterns, thresholds, anomalies, and service relationships. That is what makes dashboards useful rather than decorative.
Cloud and enterprise platforms often provide prebuilt application monitoring dashboard templates for popular environments, including Azure and Oracle ecosystems.
For example, vendor dashboards may include:
These templates are valuable for speed, especially for beginners. But they should not be adopted blindly. Before relying on preconfigured dashboards, evaluate:
This is where FineBI can be a strong recommendation. While many monitoring platforms are good at collecting telemetry, teams often struggle to present that data in a flexible, role-based format for operations, management, and business stakeholders. FineBI helps organizations build highly customizable dashboards that combine technical and business indicators into one clean interface, making it easier to support both troubleshooting and executive reporting from the same data foundation.

The right tool depends on your maturity, architecture, and audience.
Key evaluation criteria include:
If your team mainly needs visibility, straightforward dashboarding and KPI reporting may be enough. If you run distributed systems with many services and dependencies, you may need deeper observability features as well.
Beginners often try to monitor everything at once. That usually leads to clutter, confusion, and poor incident usability. A better approach is to start with focused operational questions.
Begin with a few critical services and a limited metric set. Design each dashboard section around a question such as:
This keeps the dashboard relevant and easier to maintain.
Every major chart should help someone decide what to do next. Add:
If a widget cannot support an action, remove or redesign it.
Here are five practical steps to build a dashboard that works in production:
Define the top operational decisions first
Before choosing widgets, list the decisions the dashboard must support: incident validation, root-cause narrowing, release comparison, or executive reporting.
Select one service and one customer journey to pilot
Start with a high-value app or workflow such as login, checkout, or API gateway. This keeps the first version manageable.
Prioritize a small KPI set
Use response time, error rate, throughput, availability, dependency health, and one business-facing metric such as Apdex or request success rate.
Build the dashboard in diagnostic order
Put health summary and incident indicators first, then trends, then dependencies, then logs or drill-down tables.
Review monthly and refine aggressively
Remove widgets nobody uses. Add metrics that repeatedly come up in incidents. Update thresholds as traffic, architecture, and team responsibilities evolve.
These practices make the dashboard useful from day one and keep it aligned with operational reality.
Vanity metrics make dashboards look impressive but do not improve decisions. Examples might include total requests without context, average latency without percentiles, or oversized gauges that hide trend history.
Instead, favor metrics that answer real operational questions under pressure.
Your application monitoring dashboard should evolve with the system. As your architecture grows, you may need:
That evolution is normal. The goal is not to build the final dashboard on day one. The goal is to build a dashboard people actually use.
A strong application monitoring dashboard gives beginners and experienced teams the same advantage: faster, clearer decisions. It turns scattered telemetry into an operational command view that helps you detect issues early, troubleshoot efficiently, communicate status confidently, and connect technical health to business impact.
If you are just getting started, keep it simple. Start with core performance, reliability, infrastructure, and user experience metrics. Use clear widgets. Organize the dashboard for action, not decoration. Then expand as your team’s monitoring maturity grows.
For organizations that want flexible, enterprise-ready dashboarding with strong visual design and cross-functional reporting, FineBI is a practical option for building application monitoring views that both technical teams and business stakeholders can trust.
It shows the most important signals about app health in one place, such as response time, error rate, uptime, throughput, and dependency status. The goal is to help teams spot issues quickly and understand their impact.
Beginners should start with response time, latency, throughput, error rate, uptime, and availability. These metrics give a clear first view of performance, stability, and user impact.
Raw logs and metrics are the underlying data, while the dashboard organizes them into a decision-ready view. A good dashboard highlights what matters most so teams can triage faster instead of searching through scattered tools.
It speeds up detection and triage by showing current health, recent trends, and likely problem areas in a single view. This helps teams confirm severity, identify affected services, and act before users feel a bigger impact.
Yes, FineBI can be used to create application monitoring dashboards that combine key KPIs, trend charts, and operational views. It is useful for turning monitoring data into a shared, readable dashboard for technical and business teams.

The Author
Yida Yin
FanRuan Industry Solutions Expert
Related Articles

Dashboard Local Beginner Guide: CRM Features, Follow-Up Automation, and Real Use Cases
If you are exploring $1 for the first time, the main value is simple: it helps you stop losing track of people after meetings, referrals, networking events, and early sales conversations. For solo operators, small teams,
Yida Yin
May 25, 2026

React Dashboard Tutorial: Build a Real-Time KPI Workspace from a UI Template
A $1 is most valuable when it becomes a working command center, not just a pretty admin screen. In this tutorial, the scenario is straightforward: you need to deliver a real time KPI workspace for operators, managers, or
Yida Yin
May 21, 2026

What Is a Benchmark Dashboard? Practical Guide to Compare Teams, Sites, and Time Periods
A benchmark dashboard is a decision making tool that helps operations leaders compare performance across teams, locations, and time periods in one place. Its business value is simple: it turns scattered KPIs into a fair,
Yida Yin
May 21, 2026


