You can help your federal agency meet decarbonization goals with an energy dashboard. With real-time data, you can see and control energy use right away. This method gives you a clear look at how much energy you use. It also helps you find ways to save energy. Advanced solutions like FineReport make it easier to find places to improve and make reports faster. Agencies have seen up to a 35% drop in energy use and better results on sustainability audits. When you use these tools, you work more efficiently and make real progress in cutting emissions.
The role of energy dashboards in decarbonization
Real-time energy tracking
An energy dashboard lets you see your agency’s energy use right now. These dashboards gather information from smart meters, sensors, and energy management systems. This helps you see all your energy use in every building. FineReport connects to many data sources and shows the data in simple charts and graphs.
Here is how energy dashboards help federal agencies:
Key Aspect
Description
Data Aggregation
Energy dashboards bring together energy data from many places for easy study.
Real-time Processing
IoT devices and sensors send energy data right away for quick choices.
Scalability
You can watch hundreds of sites in one dashboard for better control.
When you track energy as it happens, you can see big changes. Some federal buildings have used less than half the energy they did before. They also cut over 3,000 tons of CO₂. These results show that watching energy in real time helps with decarbonization.
Data-driven decision support
An energy dashboard gives you facts to help you make good choices. You can compare energy use in different buildings, look at patterns, and set new goals. FineReport turns hard data into easy dashboards. You can see which steps save the most energy and what needs more work.
You can use data to find the best ways to use less energy.
You can check how changes affect your energy use.
You can share results with your team so everyone stays focused.
Federal agencies use dashboards to plan upgrades and see savings. For example, General Motors uses a dashboard to check energy, water, and emissions at over 100 places. This helps them find where they can save the most and reach their decarbonization goals faster.
Accountability and transparency
An energy dashboard lets you show your progress to everyone. These dashboards make it simple to share data with leaders, workers, and the public. When you show your energy use and savings, you build trust and prove you are meeting your goals.
Here are some common data sources federal agencies use in dashboards:
Data Source
Contribution to Decarbonization
State Level Data Hub
Gives one place for energy data and helps measure success.
Regional Energy Efficiency Database
Shows how well energy programs work in different areas.
Building Energy Benchmarking
Shares important data to help make better energy rules.
FineReport helps by making it easy to connect to many data sources and show results in a way everyone can understand. You can set up dashboards that update by themselves, so your data is always up to date. This makes it easier to stay open and honest as you work toward decarbonization.
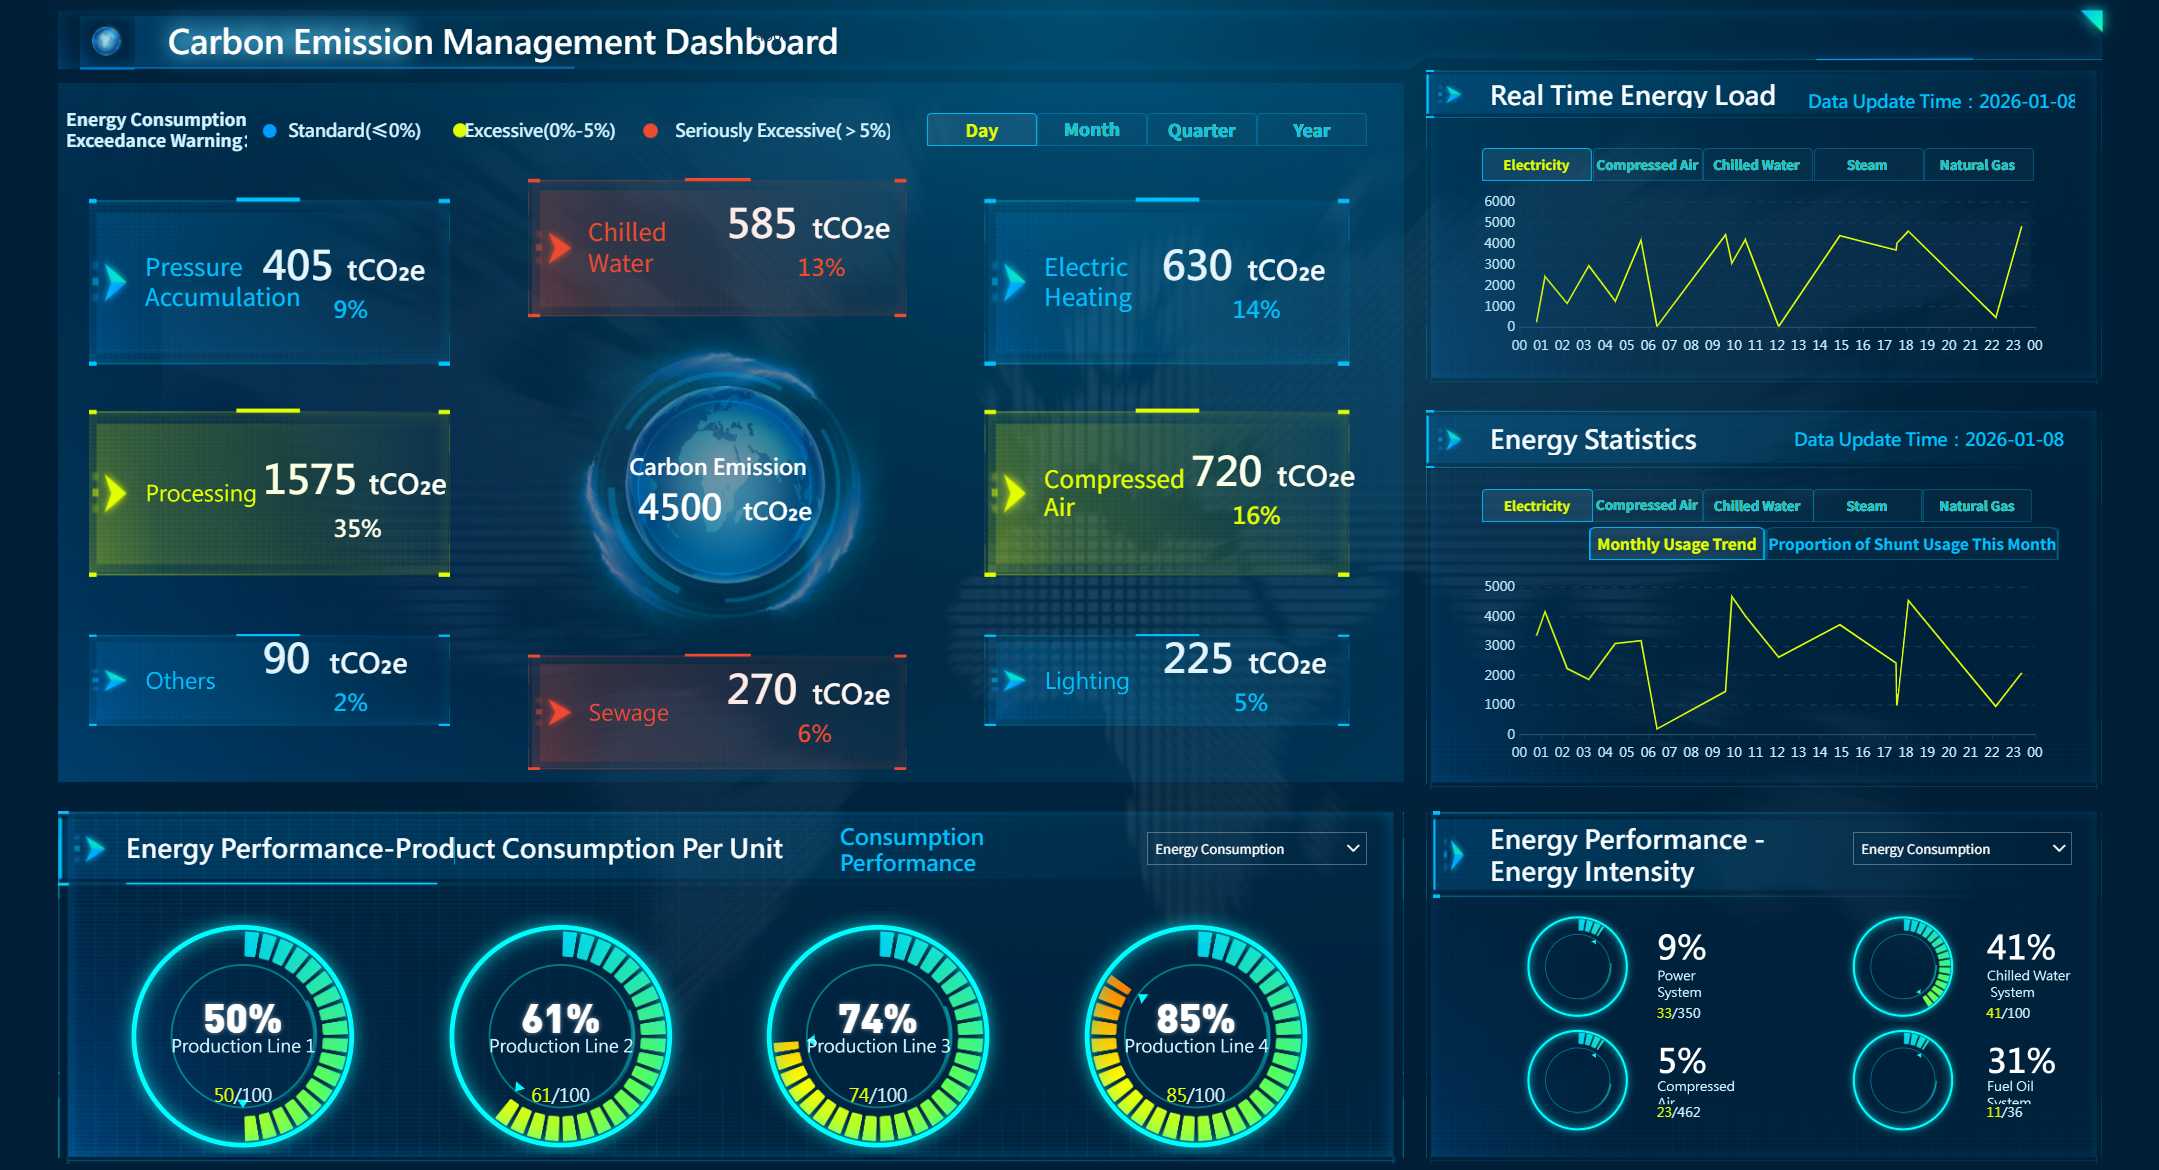
carbon emission management dashboard - click to engage
Why energy dashboards matter for federal agencies
Key features and compliance
Federal agencies must follow strict rules for energy use. Many government buildings need to use 30-50% less energy. This is because of executive orders and state laws. An energy dashboard helps you see how much energy you use. It also helps you report your results. You can find problems and fix them fast.
Here are some key policies and how dashboards help:
Evidence Type
Description
Federal and State Mandates
Government buildings are required to reduce energy consumption by 30-50% as per executive orders and state mandates.
Energy Dashboards Usage
The use of energy dashboards is implied for compliance and reporting in the context of energy management.
Dashboards let you collect data from many places. This makes it easier to follow the rules and avoid mistakes. You can see how changes in your building change energy use and emissions. This helps you reach your goals and show your results to others.
Some important features include:
Easy-to-read charts and graphs for energy data
Tools to set baselines and measure progress
Automatic tracking to reduce reporting errors
Visual tools to show cost savings and program success
Supporting sustainability mandates
Federal agencies must support big goals like net-zero and using less fossil fuel. An energy dashboard gives you real-time data about energy use. You can make smart choices that match these goals. When you watch energy use, you can change your plan and stay on track.
FanRuan-en’s ESG solutions and FineReport give extra help. You can link HR, financial, and ESG data for one report. The system tracks carbon emissions by itself and supports big reporting rules. You can connect to ERP and IT systems for smooth data flow.
Feature
Description
Data Integration
Links HR, financial, and ESG data to create unified reports, avoiding data silos.
Automated Tracking
Tracks carbon emissions (Scope 1, 2, and 3) automatically.
Framework Support
Supports CSRD, GRI, and TCFD frameworks.
ERP Integration
Integrates with common ERP and IT systems for seamless data flow.
FineReport makes it simple to show data with dashboards and reports. You can put all your data in one place and make reports automatically. This helps you make choices based on facts, not guesses. You can show your progress and prove your agency cares about the environment.
Benefits of energy dashboards
Monitoring and alerts
Energy dashboards let you watch your agency’s energy use live. When you set alerts, staff get messages about power problems early. If a building uses more energy all of a sudden, the dashboard sends an alarm. This warning helps you act fast and stop waste. It also saves money. Event reports give clear records with times for each issue. This makes it easier to spot patterns and fix things quickly. Data trends and analytics show how energy use changes over time. These tools help you manage energy before problems happen. Monitoring solutions like these help federal agencies control energy use and work better.
Cost and efficiency gains
Energy dashboards can help you save a lot of money. When you track energy closely, you find places where energy is wasted. It is easier to start energy-saving actions because you see what works best. Some agencies have cut their energy costs by more than 20% after using dashboards. Dashboards show how much energy you save as time goes on. This data helps you make good choices and proves upgrades are worth it. When you focus on saving energy, you spend less and help the planet. Seeing cost savings on dashboards encourages teams to keep saving energy.
Progress tracking
Dashboards help you check how close you are to decarbonization goals. You can see if your agency is meeting targets for 2030 or other climate plans. For example, policies want to lower emissions and energy use, and dashboards make tracking easy. You can compare today’s emissions to what you need to reach your goals. Tracking progress keeps everyone focused and responsible. It also lets you change your plan if needed. Agencies using dashboards match their sustainability goals better. They can show their success clearly and build trust with others.
Many federal agencies have seen big results from these benefits. Some have cut energy use by more than 35%, saving millions each year. Dashboards help agencies work better and lower emissions. This makes energy and cost-saving efforts stronger.
Implementing energy dashboards
Needs assessment and platform selection
First, you need to know what your agency wants from an energy dashboard. Make a list of your main goals. Do you want to use less energy, watch how much you use, or follow new rules? Check your current energy systems to see what works and what does not. Pick a platform that fits your needs and can grow with you. FineReport lets you build dashboards by dragging and dropping, so you do not need to code. You can also check your data on your phone from anywhere. Many federal agencies use Energy Management Information Systems to watch and study energy use. FEMP has guides and resources to help you with your project.
Data integration and customization
You need to bring together data from many places. This can be hard because different teams want different things. Some people want simple charts, but others need detailed reports. You have to share information but also keep it safe. Data silos can slow you down, so connect all your systems for a full view. FineReport lets you link many data sources and make dashboards for each group. You can use the platform to show energy use for each building or for the whole agency. If staff are unsure about new tools, include them early and show how dashboards help their work.
Give each group their own custom view.
Keep important data safe but still share what you can.
Connect all your data for a complete look at energy.
Training and adoption
Training helps everyone learn to use the new dashboard. There are many resources to help you learn best practices. For example, GSA has tools and training for green buildings. You can find online lessons about saving energy and managing buildings for a long time. Some programs teach you how to track energy savings and use performance contracts. Here is a table of helpful training options:
Training Resource
Description
GSA's Federal Agency Sustainable Building Tools and Training
Gives policies, strategies, case studies, and tools for green building practices.
Improving Process and Building Heating through Innovation and Energy Efficiency
Online, on-demand training about making buildings use less energy.
Long-Term Management Of Measurement And Verification (M&V) In Performance Contracts
Training on how to check energy savings during performance contracts.
eProject Builder (ePB) Demonstration
A web system for tracking energy savings contract data.
ESPC Comprehensive Trainings, Parts 1-3
Overview of energy savings contracts and how to use them.
You should ask your team to join these trainings. When everyone knows how to use the dashboard, your agency will get better results and reach energy goals faster.
You can help your agency reach decarbonization goals by using energy dashboards. These dashboards give you real-time data and helpful information. You do not have to wait for slow, manual reports anymore. Now, you get fast updates that happen automatically. This means your data is better and you can make quick decisions. Dashboards change simple numbers into progress you can see all the time. If you pick advanced tools like FineReport, you can meet your sustainability goals and show real results.
Product Trial
FineReport
Pixel-perfect reports · Interactive dashboards · Easy data entry · Digital twins
Access a wealth of case studies, industry insights, and solution guides to accelerate digital transformation.
FAQ
What is an energy dashboard?
An energy dashboard is a tool that shows you real-time data about your energy use. You can see charts, graphs, and alerts. This helps you track, manage, and save energy in your buildings.
How does FineReport help with decarbonization?
FineReport lets you connect many data sources and create easy-to-read dashboards. You can track energy use, spot problems, and share results. This helps you lower emissions and meet your agency’s goals.
Can I use energy dashboards on my phone?
Yes! You can check your energy dashboards on your phone or tablet. FineReport supports mobile access, so you can see updates and alerts anywhere.
Do I need coding skills to use FineReport?
No coding skills are needed. You can build dashboards with drag-and-drop tools. This makes it easy for anyone on your team to use and customize reports.