Looking for the best way to manage your home server services in 2026? You have more choices than ever. Top picks like Homarr, Dashy, and FineBI each bring something special. Homarr offers a modern interface. Dashy gives you full customization. FineBI stands out with powerful analytics for business and advanced users.
Think about what you need—do you want something simple for your family, or do you need advanced features for work? Your answer will help you pick the right dashboard.
Top Server Dashboards for 2026
Leading Home Server Dashboards Overview
You want a web server dashboard that is easy to use. In 2026, there are more choices than before. Some dashboards are made to be simple. Others have extra tools for business or analytics.
When you pick a server dashboard, think about what you need most. Do you want a simple dashboard for your family? Or do you need one that works with lots of data and many services? The best dashboards can do both.
Experts say you should look for these things in a web server dashboard:
Data integrations and connectors for all your devices
AI features that help you spot trends fast
Pricing that fits your budget, from free simple web server dashboard options to advanced paid plans
Real-time updates so you always see the latest info
Easy access for everyone, even if you’re not a tech expert
Customizable templates and layouts
A strong integration ecosystem for smart home or business tools
A simple web server dashboard should give alerts, track what users do, and let you change how it looks. Security is very important. You want your dashboard to keep your data safe and grow with you if you need more.
Quick Comparison Table
Let’s look at some top web server dashboards side by side. This table shows what makes each simple web server dashboard special.
A simple web server dashboard helps you manage your network and watch your devices. It keeps everything working well. If you want more features, a web server dashboard like FineBI gives you analytics and business tools. Choose the dashboard that fits your needs and enjoy a smarter home or office.
What Is a Server Dashboard?
Core Functions and Benefits
A server dashboard is your control center for everything on your network. You get one place to see all your devices, apps, and services. This makes life easier and helps you keep things running smoothly.
Here’s what you can expect from a good server dashboard:
You control everything from one spot. No more jumping between different tools.
You see user insights with heatmaps and real-time tracking.
You get smart resource management. The dashboard can shift power to where it’s needed most.
You can set up custom workflows. This means you can automate boring tasks.
You stay safe with strong security features like geo-restriction and AI that watches for strange activity.
You enjoy dynamic graphs and interactive charts. These help you tell stories with your data.
You track energy use and find ways to save power.
You can add more devices or services without making things complicated.
A server dashboard helps you spot problems before they get big. Many IT pros say alerts from their dashboards stop major outages. Real-time analytics let you act fast and keep everything working.
Why Home and Business Users Need Dashboards
You might wonder why you need a dashboard at home or work. The answer is simple. It saves you time and stress.
Check out how a server dashboard helps different users:
Feature
Benefit
Customizable monitoring
You see how your network is doing right now.
Zero-touch provisioning
You set up new devices fast, without lots of steps.
Automated device discovery
The dashboard finds new devices and helps you fix problems quickly.
Detailed lifecycle information
You know when to update or replace devices.
Single interface for configuration
You set up everything in one place, which makes your life easier.
If you’re a home user, you get peace of mind. You know your smart devices and network are safe. If you run a business, you make decisions faster. Real-time dashboards show live data, so you can spot issues before they become big problems.
A server dashboard gives you the power to manage your network with less effort. You spend less time fixing things and more time enjoying your tech.
Server Dashboard Reviews and Comparisons
Homepage – Minimal and Efficient
Homepage is a simple web server dashboard. It loads fast and looks clean. You can set it up with YAML files. Or let it find your services with Docker labels. Homepage works on AMD64 and ARM64. This means it fits most home servers.
Here’s why Homepage is special:
Feature
Description
Customization Options
You can change themes and add your own CSS or JS. You can also adjust layouts easily.
Integrations
It connects with over 100 services. These include popular apps and self-hosted tools.
Performance
Homepage loads very fast. It is statically generated.
Docker Support
It finds and manages services using Docker labels.
Multi-language Support
You can use Homepage in over 40 languages.
Utility Widgets
You can add weather, time, date, and search widgets for extra help.
Security
Homepage keeps API keys hidden. It uses security features checked by the community.
You get a web server dashboard that is secure and quick. Homepage is great if you want to see resource usage fast. It does not have lots of extra features. It is a top pick for people who like a simple look and strong performance.
Setup Tips:
Use Docker to find services easily.
Edit YAML files to make your dashboard your own.
Homepage works well on most server hardware.
Best for: You, if you want a simple web server dashboard that just works and keeps your network neat.
Homarr – Feature-Rich and Modern
Homarr is a modern web server dashboard. It has a sleek look. You get a drag-and-drop interface. You can move things around and make it your own. Homarr is easy to set up. Even beginners can use it.
Key Features:
Modern design with smooth animations.
Tracks resource usage in real time.
Works with many popular apps and services.
Supports user accounts and permissions.
Mobile-friendly layout.
Homarr is simple but powerful. You can watch your network and check performance. You can manage your services in one place. The dashboard updates in real time. You always know what is happening.
Setup Tips:
Install with Docker for a fast setup.
Use the web UI to add and organize services.
Set up user accounts for family or team members.
Best for: You, if you want a web server dashboard that looks good and has many features but is still easy to use.
Dashy – Customizable and Flexible
Dashy lets you control almost everything. You can change layouts and widgets. If you like to tinker, Dashy is a great choice. It fits your style.
User Scenario
Benefit
Web server management
Puts all your self-hosted web service links in one spot.
Bookmark management
Lets you quickly access and edit your favorite websites.
Client project organization
Keeps all app and admin page URLs for clients organized.
Dashy is great for organizing lots of links and services. You can add widgets for resource usage, weather, or news. The dashboard supports themes. You can match it to your taste.
Setup Tips:
Use the built-in editor to change your dashboard.
Add widgets for resource usage and performance tracking.
Organize your links by category for easy access.
Best for: You, if you want a web server dashboard you can shape for home, work, or client projects.
Monitorr – Comprehensive Monitoring
Monitorr helps you see your network’s health. You get real-time stats on resource usage, uptime, and service status. The dashboard is simple but powerful. It makes it easy to spot problems early.
Key Features:
Real-time monitoring of CPU, memory, and network.
Custom alerts for downtime or high resource usage.
Clean interface with easy-to-read charts.
Works with many different services.
Monitorr is great if you care about performance. It helps keep your network running well. You can set up alerts. You will know right away if something is wrong.
Setup Tips:
Install with Docker or directly on your server.
Add your services for instant monitoring.
Set up email alerts for important events.
Best for: You, if you want a simple web server dashboard focused on monitoring tools and resource usage.
Glance – Unified Feeds
Glance puts all your feeds in one web server dashboard. You can see news, weather, and service status at once. The dashboard is easy to use. It helps you stay updated without switching tabs.
Key Features:
Unified view of news, weather, and server status.
Customizable layout for your favorite feeds.
Real-time updates for resource usage and performance.
Simple setup with Docker or manual install.
Glance is perfect if you want to see everything in one place. You can add widgets for resource usage. You always know how your network is doing.
Setup Tips:
Pick your favorite feeds and add them to your dashboard.
Use widgets to track performance and resource usage.
Change the layout to fit your screen.
Best for: You, if you want a web server dashboard that keeps you informed and organized.
Ultimate Homelab Dashboard – Advanced Management
Ultimate Homelab Dashboard is for power users. You get advanced management tools and detailed resource usage stats. It supports multiple servers. The dashboard is highly customizable and can grow with you.
Key Features:
Supports many servers for big home labs.
Tracks resource usage and analytics in detail.
Customizable widgets and layouts.
Real-time performance monitoring.
Works with smart home devices.
This web server dashboard is great if you run lots of services. You can manage a complex network. Track performance across all your servers. Spot issues fast.
Setup Tips:
Use Docker for easy deployment.
Add all your servers for a unified view.
Customize widgets for the data you care about.
Best for: You, if you want a web server dashboard that grows with your needs and offers advanced analytics.
Flame – Simple Start Page
Flame is the easiest way to start with a web server dashboard. You get a clean start page with your favorite links. You also see basic resource usage info. Flame is lightweight and quick to set up.
Key Features:
Simple web server dashboard with bookmarks.
Quick view of resource usage and uptime.
Easy setup with Docker or manual install.
Clean, distraction-free interface.
Flame is perfect if you want a simple web server dashboard. It shows your links and basic stats. You do not get many extra features. But you get speed and simplicity.
Setup Tips:
Add your favorite links to the dashboard.
Use the resource usage widget to watch your server.
Keep it simple for the fastest performance.
Best for: You, if you want a simple web server dashboard that is fast and easy to use.
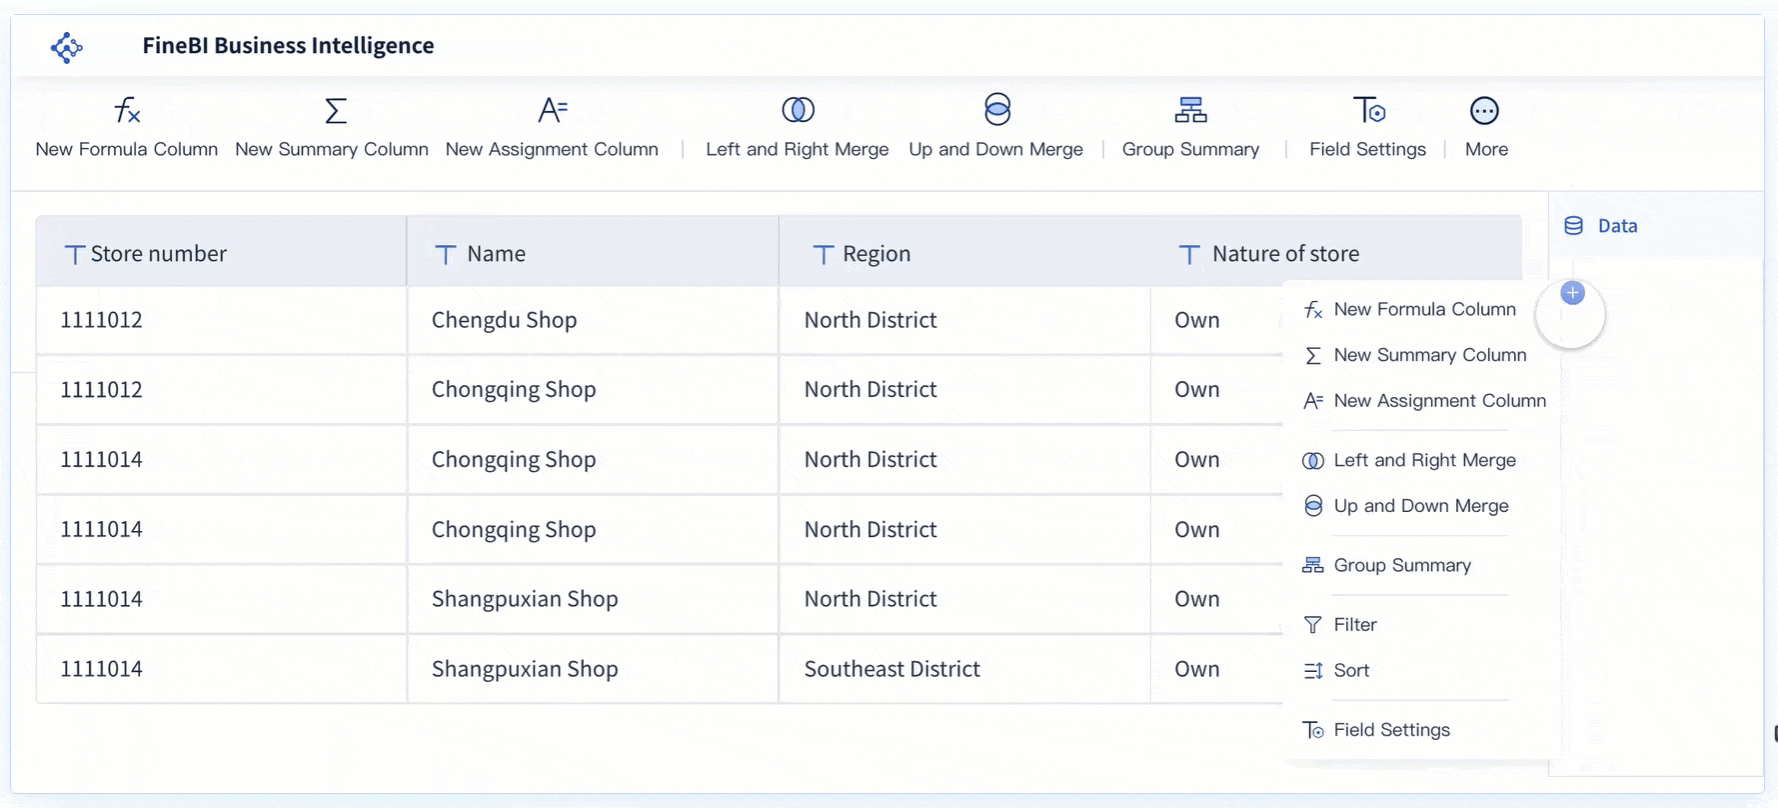
FineBI – Enterprise-Grade Analytics
FineBI takes your web server dashboard to a new level. It is not just for home users. It is built for business and advanced users. FineBI gives you a strong platform to connect, analyze, and see data from many sources.
Feature
Description
Self-service query platform
Lets you access real-time data from databases or local environments.
Data processing capability
Handles billions of records with high performance and scalability.
B/S feature
Lets you create charts and dashboards with drag-and-drop tools.
Dashboard
Shows key indicators and metrics on one page for better decision-making.
Mobile data viewing
Lets you view and share analytics on your phone or tablet.
You get a web server dashboard that does more than show resource usage. FineBI helps you track performance and spot trends. You can make smart decisions. Build dashboards with drag-and-drop tools. Set up real-time alerts. Share insights with your team.
FineBI is known for its scalability. You can start small and grow as you need. The platform supports advanced analytics. You can dig deep into your data. FineBI keeps your data safe with strong security and access controls.
Real-World Example: The Abu Dhabi Projects and Infrastructure Centre (ADPIC) used FineBI’s sister product, FineReport, to manage big government projects. They built a custom dashboard for leaders. It helped them track safety, quality, and project progress in real time. This shows how a strong server dashboard can change how you manage complex operations.
Setup Tips:
Connect to your databases, cloud platforms, or APIs.
Use drag-and-drop tools to build your dashboards.
Set up mobile access for insights on the go.
Best for: You, if you need a web server dashboard with enterprise-grade analytics, advanced resource usage tracking, and top performance. FineBI is great for business users, IT teams, and anyone who wants to turn data into action.
Essential Features for 2026 Server Dashboards
Security and Privacy
You want your web server dashboard to keep your data safe. Security is even more important in 2026. The best dashboards show what is happening right now. They use runtime visibility and behavioral analysis to find real risks. You can see the whole attack chain with full-stack attack correlation. This helps you act quickly. Risk prioritization with runtime context lets you focus on the biggest threats first. Here are the top security features you should look for:
Security Feature
What It Does
Runtime Visibility and Behavioral Analysis
Shows real-time container behavior and actual risks.
Full-Stack Attack Correlation
Connects events across layers for a complete attack view.
Risk Prioritization with Runtime Context
Focuses on exploitable vulnerabilities for better security.
You need strong security to protect your network and privacy. A simple web server dashboard should hide your keys and use security tools checked by the community. Security keeps your web server dashboard safe as your needs grow.
Customization and User Experience
You want a web server dashboard that fits you. Customization lets you change layouts and pick chart types. You can show only the data you care about. Save your favorite settings for quick access. Many dashboards let everyone use them in their own language. Here are the features users like most:
Customization Feature
Why It Matters
Default Layout Customization
Lets you set up your dashboard just how you like it.
Data Relevance Display
Shows only the performance metrics and data you need.
Chart Type Variety
Gives you choices for how you see your data.
Multilingual Support
Makes the dashboard easy for everyone, no matter their language.
A simple web server dashboard with good customization makes your experience smooth and personal.
Integration with Smart Home and IoT
You want your server dashboard to work with your smart home. In 2026, integration is a must-have. You can connect to weather services, Z-Wave, HomeKit, Google Assistant, MQTT, Philips Hue, Sonos, Google Nest, and Tasmota devices. This means you control lights, speakers, and sensors from your web server dashboard. You get real-time updates about your home’s status. A simple web server dashboard should make these connections easy.
Weather integration helps with automation
Z-Wave and HomeKit let you control devices
Google Assistant gives you voice commands
MQTT works for DIY and third-party devices
Philips Hue and Sonos control smart lights and sound
Google Nest and Tasmota manage sensors and local control
Real-Time Monitoring and Alerts
You need to see what is happening right now. The best server dashboards show real-time CPU, memory, disk usage, and uptime. You get alerts when something goes wrong. Tools like Dotcom-Monitor, Site24x7, and Netdata send alerts before problems get big. You can set up your web server dashboard to watch performance and send messages if anything changes. Custom alerts help you fix problems fast and keep your network running.
Mobile and Remote Access
You want to check your web server dashboard from anywhere. In 2026, mobile and remote access is normal. You can see performance and real-time updates on your phone or tablet. A simple web server dashboard should look good and work well on any device. This means you stay in control, even when you are not at home.
Choosing the Right Server Dashboard
Assessing Your Needs
First, think about what you want your web server dashboard to do. Do you just want to see your favorite links and check if your server is working? Maybe you want to watch smart home devices or get alerts if something is wrong. If you have a business or lots of data, you might need more advanced tools and team features. Make a list of what you really need. This will help you choose the best dashboard.
Matching Features to Scenarios
Each web server dashboard is good at different things. Here’s how you can match features to what you need:
For home users: Choose a dashboard that is easy to set up, works on phones, and connects to smart home devices.
For families: Pick one with user accounts and simple controls.
For business or advanced users: Look for dashboards with analytics, real-time monitoring, and team sharing.
If you need advanced analytics or business intelligence, FineBI is a great choice. It lets you make custom dashboards, look at data, and make smart choices. You can see how FineBI compares to other dashboards in this table:
Feature
FineBI
Microsoft Power BI
Analytics
Ad Hoc Reports, Dashboard, Predictive
Similar features
Integrations
Accern, Microsoft Excel, more
Many available
Pricing
$10 per user per month
Free version, free trial
FineBI gives you strong analytics and is good for business teams. You can use it to watch performance and find trends.
Considering Budget and Hardware
Think about how much money you want to spend and what kind of server you have. Many web server dashboards are free and work on simple hardware. If you want more features, you might need to pay for a license or subscription. FineBI has powerful tools for a monthly fee, and you get analytics and support. Make sure your server can run the dashboard you pick. Some dashboards need more memory or storage to work well.
Troubleshooting Common Server Dashboard Issues
When you use a server dashboard, you might run into a few bumps along the way. Don’t worry—most problems have simple fixes. Let’s look at some common issues and how you can solve them.
Connectivity Problems
Sometimes, your dashboard can’t connect to your devices or services. This can feel frustrating. You might see errors when trying to reach your apps or data. Here’s what you can do:
Check your network cables and Wi-Fi. Make sure everything is plugged in and working.
Restart your router or server. This often solves connection hiccups.
If you use APIs, refresh your tokens. Sometimes, tokens expire and need updating.
Double-check your login details. A small typo can stop everything.
Performance Optimization
Does your dashboard feel slow? You’re not alone. Slow performance is a common issue, but you can speed things up with a few tricks:
Use smaller images and graphics. Big files take longer to load.
Reduce the number of widgets or charts on your main page.
Turn on caching if your dashboard supports it. This helps pages load faster.
Close other apps on your server to free up memory.
A fast dashboard makes your life easier. You’ll spend less time waiting and more time getting things done.
Dashboard Errors and Fixes
You might see errors or strange displays on your dashboard. Maybe a chart won’t load or data looks wrong. Here’s a quick table to help you spot and fix common problems:
Common Issues
Typical Resolutions
Data Accuracy Issues
Check your data sources and audit your data regularly.
Display Problems
Use clear charts and focus on the most important numbers.
Connection Failures
Refresh API tokens and check your inputs.
Slow Performance
Optimize images, reduce requests, and use caching for faster load times.
If you see something odd, start by checking your settings. Make sure you use the latest version of your dashboard software. Updates often fix bugs and add new features.
You’ve seen the best server dashboard options for 2026. Each one brings something special. If you want a simple web server dashboard, you have great choices. For advanced analytics, FineBI stands out. Pick the tool that matches your needs. Try a demo, read setup guides, or join a community forum. You’ll manage your network with more confidence.
Product Trial
FineReport
Pixel-perfect reports · Interactive dashboards · Easy data entry · Digital twins
Access a wealth of case studies, industry insights, and solution guides to accelerate digital transformation.
FAQ
How do I pick the best server dashboard for my home?
Think about what you want to see and do. Do you need simple stats or deep analytics? Try a few dashboards. See which one feels right for you and your family.
Can I use these dashboards on my phone?
Yes! Most dashboards work on phones and tablets. You can check your network from anywhere. Just open your browser or use the dashboard’s app.
Is my data safe with these dashboards?
You stay in control. Good dashboards use strong security. Look for features like password protection, user roles, and hidden API keys. Always update your dashboard for the latest safety tools.
Do I need to know how to code?
No, you don’t! Many dashboards use drag-and-drop tools. You can set up and customize your dashboard without writing code. If you like coding, some dashboards let you add custom scripts.