A sustainability dashboard helps you track important data. It shows information about the environment, people, and how companies are run. You can see what your actions do. This helps you make better choices for your business. In the last five years, more companies use digital tools for sustainability. The table below shows how these changes help you work faster. It also helps you reach more people.
A sustainability dashboard lets you see how your group is doing. It helps you check progress on things like energy use and waste. You can also see how people are treated. This tool gives you numbers and charts that are easy to read. You can find out if you are meeting your goals for the environment, social responsibility, and company rules.
A sustainability dashboard helps you see if you are reaching your goals and targets.
It looks at the environment, social issues, and money matters.
You use it to share these numbers often.
You can use an esg dashboard to show your progress to others. It helps you know if you are following rules and standards, like the UN’s Sustainable Development Goals. You can also check if you meet ESG compliance. Some dashboards show your total emissions and how much energy you use. They also show how much energy comes from renewable sources. This helps you make good choices and get better results.
An esg dashboard makes it simple to collect and check data from many places. You can use it to follow reporting rules and track compliance without extra work. This helps investors and customers trust you because they see your real results.
Who Uses Sustainability Dashboards
Many groups use an esg dashboard. You can find them in:
Retail
Corporate offices
Aviation
Manufacturing
Healthcare
Food and consumer goods
Infrastructure
Energy transition
Technology
Financial services
Different people in these groups use the esg dashboard for different jobs. Here is a table that shows who uses it and what they do:
Role
Responsibilities
Executives
Look at important numbers to help make big choices and plans.
Operational Managers
Watch live data on energy use and fix problems fast.
Finance Teams
Check cost data to help with budgets and planning.
Sustainability Officers
Track how the company affects the environment and help meet goals.
IT Departments
Make sure the dashboard works well and keeps data safe.
You can see that an esg dashboard is useful for many people. It helps everyone work together to reach their sustainability goals.
How Sustainability Dashboards Work
Data Integration with FineReport
You need to collect data from many places to see your full progress. FineReport helps you do this easily. You can use its drag-and-drop tools to connect different data sources. You do not have to write any code. FineReport lets you link databases, Excel files, and cloud systems. This means you can gather information about energy, waste, and social programs in one spot.
FineReport connects to many sources at once. You can get data from your ERP, CRM, or factory sensors. This helps you build an esg dashboard that shows all your important data. You do not need to use many tools. You can see all your numbers and charts together. This saves time and helps you make fewer mistakes.
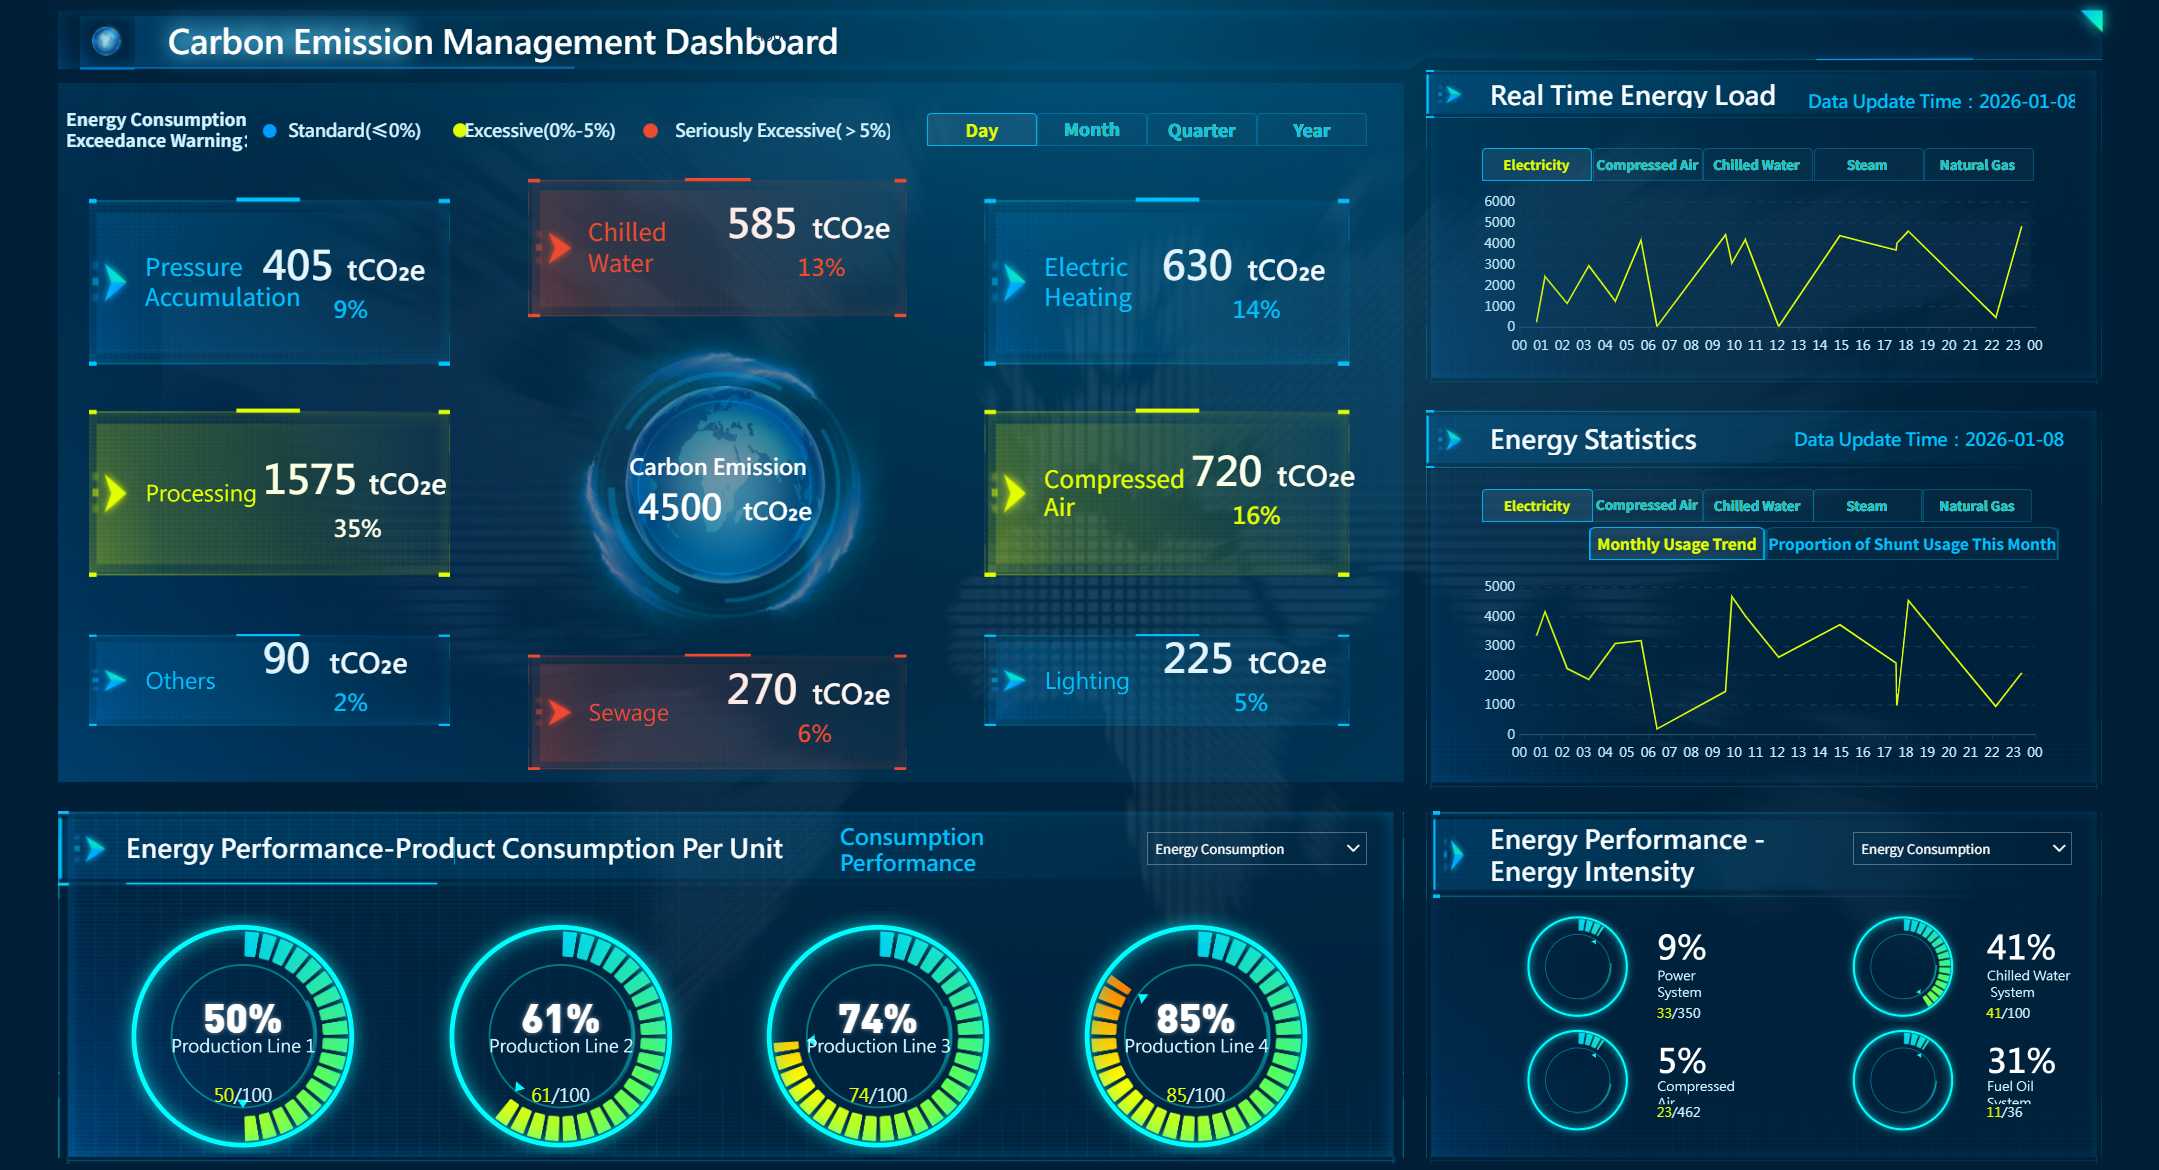
carbon emission management dashboard - click to engage
Real-Time Data Visualization
You want to know what is happening right now. An esg dashboard with real-time data lets you do this. You can watch energy use, emissions, and other numbers as they happen. This helps you find problems early and fix them quickly.
Real-time data visualization gives you many good things:
You always see your ESG performance. You do not have to wait for reports.
You can check if you follow different rules and standards. This helps you find problems early.
You can make choices faster. You do not have to wait for old numbers.
You can focus on smart actions, not just rules. You can test ideas, see risks, and choose the best steps for your company.
You can track energy use as it happens. This helps your team stay aware and make better choices.
When you use an esg dashboard with real-time data, you can act fast. You can improve your results and reach your goals sooner.
Key Features and Automation
An esg dashboard does more than show numbers. It uses automation to make your work easier. You do not have to type in data by hand. The dashboard collects, checks, and updates information for you.
Here is how automation helps you:
Feature
What It Means for You
Automation enhances accuracy
You get good data because the dashboard stops mistakes.
Saves time
You do not spend hours making reports. You can work on bigger projects.
Real-time data access
You see important numbers right away. This helps you make smart choices fast.
Visual data representation
The dashboard shows hard data in easy charts and graphs. You can spot trends fast.
You can set up alerts for your esg dashboard. If something goes wrong, you get a message right away. You can also send reports to your team or leaders on a schedule. This keeps everyone updated and ready to help.
A sustainability dashboard with these tools helps you manage your data, save time, and do better work. You can trust your numbers and focus on making a real difference.
Sustainability Dashboard Applications in Manufacturing
ESG Data Tracking and Compliance
Manufacturing has many rules to follow. An esg dashboard helps you keep up. You can see energy, water, waste, and social data in one place. This makes it simple to check if you follow the law. You do not need to look at many systems. The esg dashboard puts all your numbers together.
Here is how an esg dashboard helps you:
Feature
Description
Centralized data visibility
You can see all your emissions, water, waste, and social data in one spot.
Automated compliance tracking
Your data matches rules like GRI and CSRD without extra work.
Real-time monitoring and alerts
You get alerts if something is wrong.
Cross-department collaboration
You can share data with teams in operations, finance, HR, and supply chain.
Enhanced reporting accuracy
You get reports ready for audits and free from manual mistakes.
Many manufacturers think rules are hard to understand. Data is often in different places. Doing things by hand takes time and can cause mistakes. An esg dashboard fixes these problems. You can automate data entry and reports. You also get updates right away, so you always know what is happening.
FanRuan ESG Solution Overview
You can use the FanRuan ESG solution to run your factory better. This esg dashboard shows a 3D view of your plant. You see real-time data on machines and energy use. You can connect many systems and watch all your important numbers at once.
Feature Description
3D environment shows real-world conditions for better management.
Real-time display lets you see how things are working right now.
Connects many equipment systems for easy data viewing.
FanRuan is special because it links HR, finance, and ESG data. You do not have data silos, so your information stays the same everywhere. The esg dashboard works with rules like CSRD, GRI, and TCFD. You can use mobile dashboards to check your numbers anywhere. The platform updates often, so you are ready for new rules. You also get open APIs for easy setup.
Customer Story: Danfoss
Danfoss wanted to make its factory in China better. The company used FineReport as its esg dashboard. You can learn from what they did. Danfoss linked HR, finance, and ESG data. This made reports easy to make and share. The esg dashboard stopped data silos and helped everyone see the same numbers.
Danfoss used FineReport to collect data from all production lines. The company automated reports, which saved time. The esg dashboard let them watch energy use and emissions in real time. Danfoss used less paper and lowered carbon emissions. The team made better choices and reached their goals faster.
Benefits of Data Visualization in Sustainability Dashboards
Enhanced Decision-Making
You need to make good choices fast. Sustainability reporting tools turn numbers into easy charts and graphs. This helps you find problems and fix them quickly. Engineering teams can see what jobs are most important and act fast. Leaders can look at a dashboard and understand hard issues in seconds. In healthcare, teams share facts better and work together to solve problems. Good visuals help you remember key facts, so you make better choices every day.
You can spot trends and patterns that are hard to see in just numbers.
Teams work better together when everyone understands the same facts.
Sustainability reporting is best when you mix data with stories. This makes reports simple to understand and helps people care about the results.
Transparency and Reporting
You want people to trust your sustainability reporting. Data visualization makes this happen. It turns hard facts into simple pictures. This helps investors, customers, and your team see what is going on. When you use clear charts and space, your reports are easier to read. People can check your progress and hold you responsible. This builds trust and shows you want to be open.
Sustainability reporting should be clear and honest. When you use visuals, you help everyone see your work and results. This makes your company look like a leader in sustainability.
Mobile and 3D Dashboards
You are not always at your desk. With FineReport, you can check your sustainability reporting on your phone or tablet. You see updates in real time wherever you are. Mobile dashboards let you track key numbers and find problems fast. You can also use 3D dashboards to see your factory or office in a new way. These tools help you understand hard systems and make better choices.
Mobile dashboards keep you connected anywhere.
3D dashboards give you a cool view of your work.
You can act fast when you see changes right away.
Sustainability reporting is easier and stronger with these new tools. You get the whole picture, make better choices, and show your progress to everyone.
Implementing a Sustainability Dashboard with FanRuan
Steps for Successful Implementation
You can build an esg dashboard with FanRuan by following some easy steps. First, collect your data from every place you use. FineReport lets you link databases, Excel, and cloud systems with simple tools. Next, set up your dashboard to show the numbers your team needs most. You can add charts, tables, and 3D views to help track your goals. Teach your team how to use the dashboard. Give them guides and videos so they learn to check data and share updates. After these steps, you can see your progress right away and make better choices.
Best Practices and Tips
You want your esg dashboard to have correct data and help everyone work together. Try these best practices to get good results:
Best Practice
Description
Data Integration and Validation Testing
Test all links and check math to make sure your numbers are right.
User Training and Adoption Programs
Give training to each group. Use guides, videos, and help tools.
Establish Governance and Data Ownership
Decide who owns each data source and who can make changes.
Change Management for Long-Term Success
Get leaders to support the dashboard and tell everyone why it helps.
Periodic Data Quality Audits
Check your data every few months to keep it correct.
Enabling Cross-Department Collaboration
Let teams share dashboards and talk about progress together.
These tips help your esg dashboard work well. They help you track your progress and share updates with your team and leaders.
Overcoming Common Challenges
You might have some problems when you start your esg dashboard project. Here is a table that shows common problems and ways to fix them:
Challenge
Strategy to Overcome
Ensuring Data Accuracy
Pick dashboard tools that can grow
Validating Data from Various Sources
Think about how your dashboard will work in the future
Managing Implementation Costs
Make dashboards easy for everyone to use
You can fix these problems if you plan ahead. Use a step-by-step way to report your data. Use your resources wisely and think about the future. Set up clear rules so everyone knows what to do. Make your key performance indicators easy to understand. This helps you see your progress and compare it with others. If you follow these steps, your esg dashboard will help you reach your goals and show your progress to everyone.
You can use a sustainability dashboard to make clear goals. You can track your progress with KPIs. Standards like GRI help you compare results. They also help you build trust with others. Data visualization makes ESG reporting easy to read and understand.
Setting goals with deadlines helps you do better.
Dashboards make things more open and build trust.
Good data tools help you make smart choices.
To start with FineReport:
Decide your ESG goals and what to measure.
Collect data from every place you use.
Get your team involved early.
Pick the best ESG framework for your needs.
Set up your dashboard with easy-to-read visuals.
Find more resources at the FanRuan website.
Product Trial
FineReport
Pixel-perfect reports · Interactive dashboards · Easy data entry · Digital twins
Access a wealth of case studies, industry insights, and solution guides to accelerate digital transformation.
FAQ
What is a sustainability dashboard?
A sustainability dashboard helps you track and show your progress on environmental, social, and governance (ESG) goals. You see your data in charts and graphs. This tool helps you make smart choices for your business.
How does FineReport connect to my data?
You use FineReport’s drag-and-drop tools to link databases, Excel files, and cloud systems. You do not need to write code. FineReport brings all your data together in one place.
Can I use a sustainability dashboard on my phone?
Yes! You can check your dashboard on your phone or tablet. FineReport gives you mobile dashboards. You see updates in real time, wherever you are.
Why is real-time data important for ESG reporting?
Real-time data lets you see what happens as it happens. You can spot problems early and fix them fast. This helps you stay on track with your ESG goals.