Data factory solutions help you integrate information from many sources. You can transform raw data into clear visuals and discover valuable insights. FineReportandFineVis let you see patterns in your data and turn them into real-time insights. These tools support business intelligence by making your workflows smooth and efficient. When you use a data factory, you gain faster access to insights that guide better decisions.
Data Factory Solutions Overview
What is a Data Factory?
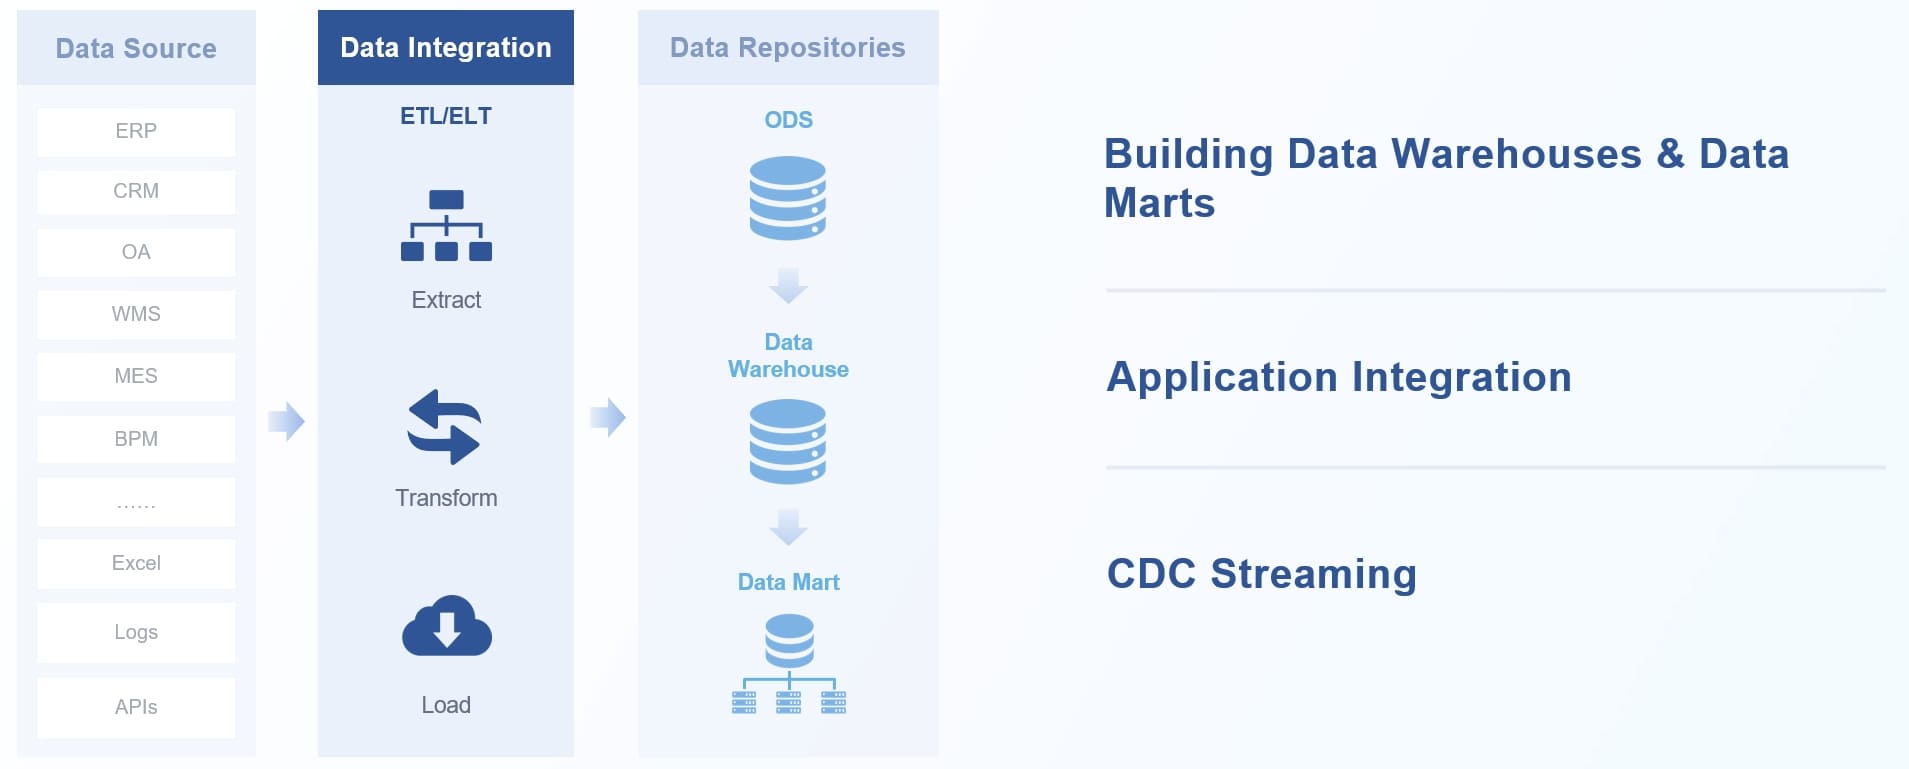
A data factory is a platform that helps you collect, process, and move data from different sources to where you need it. You can use a data factory to build data pipelines that automate the flow of information.
Azure Data Factory is a cloud-based data integration service. You can use it to connect to both on-premise and cloud data sources. It lets you create end-to-end data pipelines that automate ETL (Extract, Transform, Load)and ELT (Extract, Load, Transform) tasks. Azure Data Factory scales to handle small or very large datasets. It offers a visual interface, so you can build and manage pipelines without much coding. You also get features like monitoring, logging, and error handling to keep your data pipelines running smoothly.
FanRuan's FineDataLink is an enterprise-level data integration platform. You can connect to many types of data sources, including relational databases, APIs, and files. FineDataLink supports real-time synchronization, so your business always works with the latest data. It uses a low-code approach, making it easy to set up and manage data pipelines. You can choose from several synchronization methods, such as timestamp or log parsing, to fit your needs. FineDataLink also provides strong security features, like data encryption and SQL injection prevention.
Data factory solutions play a key role in modern reporting and visualization. You can use them to bring together data from many places, transform it, and deliver it to tools like FineReportandFineVis. This makes your reports more accurate and up-to-date. With automated pipelines, you spend less time on manual work and more time on analysis. Data factory solutions help you build a strong foundation for business intelligence and better decision-making.
Integration with FineReport and FineVis
FineReport and FineViswork together with data factory solutions to create seamless data workflows. You can connect, transform, and visualize your data without manual effort. This integration helps you build reliable pipelines that deliver real-time analytics and insights for your business.
You can connect FineReportandFineVis to a wide range of data sources. FineDataLink supports over 100 types of databases, APIs, and files. You can link your business systems, cloud storage, and even legacy platforms. The integration process uses visual tools, so you do not need to write code. You can set up connections quickly and start building data pipelines right away.
FineReportlets you combine multiple data sources in a single report. You can pull information from SQL databases, Excel files, and web APIs. This unified approach breaks down data silos and gives you a complete view of your business. FineVis uses the same integration layer, so your dashboards always show the latest information.
Once you connect your sources, you need to prepare your data for analysis. FineDataLink and FineReport support powerful transformation features. You can clean, filter, and reshape your data using visual tools. ETL automation lets you schedule these tasks, so your data stays up to date without manual work.
You can use FineDataLink to automate data transformation across your pipelines. The platform supports both ETL and ELT, giving you flexibility in how you process your data. You can set up rules to handle missing values, join tables, and apply business logic. FineReport then takes this prepared data and turns it into clear, actionable reports.
FineReport also supports custom data entry forms. You can collect new data directly from users and feed it into your pipelines. This feature helps you keep your information accurate and complete.
Real-time analytics depend on fast and accurate data updates. FineDataLink and FineReport enable real-time synchronization across your systems. When you update data in one place, the changes appear instantly in your reports and dashboards. This low-latency sync ensures you always work with the most current information.
Here is how real-time synchronization works in practice:
Tool
Real-Time Synchronization Features
Additional Capabilities
FineDataLink
Supports real-time synchronization by instantly reflecting data updates across connected systems, ensuring accuracy and low latency. Supports over 100 data sources and API integration for seamless data sharing.
Automates repetitive tasks, reduces manual data transfers, and enables monitoring and troubleshooting of data pipelines.
Enables creation of custom data entry forms and real-time dashboards that facilitate efficient data handling and visualization. Supports automation of data collection and reporting.
Provides mobile compatibility and parameter linkage for interactive reports, enhancing data accessibility and decision-making.
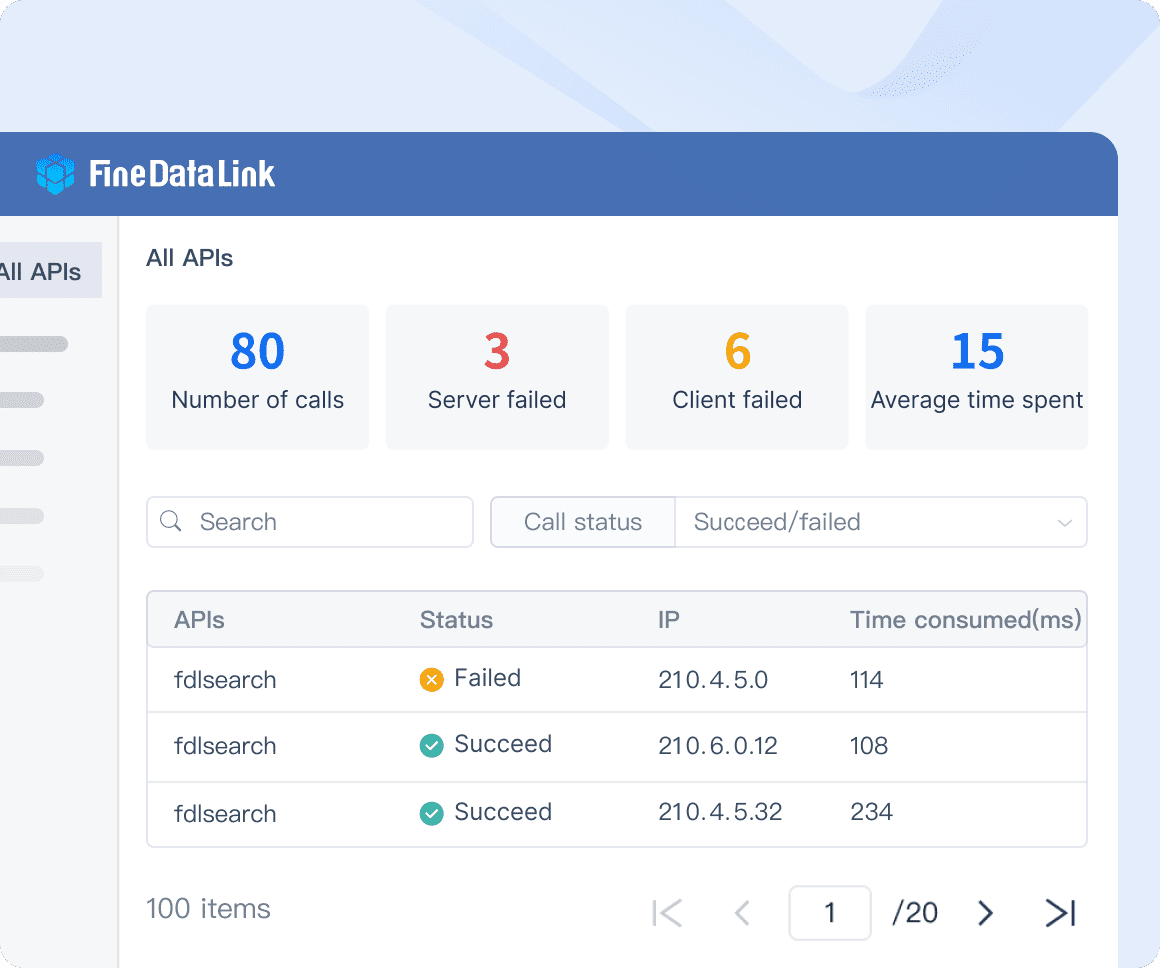
You can monitor your pipelines and troubleshoot issues using built-in dashboards. FineReportandFineVisboth support real-time analytics, so you can spot trends and respond to changes as they happen. This integration helps you make faster, more accurate decisions.
Benefits of Unified Reporting and Visualization
When you use FanRuan products for unified reporting and visualization, you gain many advantages:
You improve decision-making accuracy, with integrated tools leading to higher decision accuracy.
You boost productivity and efficiency by streamlining data access and focusing on high-value tasks.
You foster better collaboration by creating a shared data platform that breaks down silos.
You gain real-time insights, allowing faster responses to market changes and improving agility.
You empower non-technical users with self-service features, reducing IT dependency and cutting report generation time.
You distribute reports in multiple formats, improving accessibility and customer relationships.
You reduce reconciliation errors and simplify KPI tracking by integrating with enterprise BI tools.
You unlock predictive analytics and automation with AI, machine learning, and NLP features.
You scale and customize your reporting tools to fit evolving business needs, reducing IT costs.
You ensure data protection with robust security and compliance features.
You build a data-driven culture that supports innovation and strategic planning.
Note:FineReportandFineVis help you create a unified, secure, and scalable environment for all your reporting and visualization needs.
You can create dashboards that turn raw data into clear insights. FineVis andFineReportgive you a drag-and-drop interface. You select charts, tables, and widgets, then place them where you want. This approach helps you build dashboards quickly, even if you do not have coding skills. You can connect to many data sources and combine them in one view. FineVis supports over 60 chart types, so you can choose the best way to show your analysis. FineReport lets you design dashboards that match your business needs. You can customize layouts, colors, and data filters to highlight important trends.
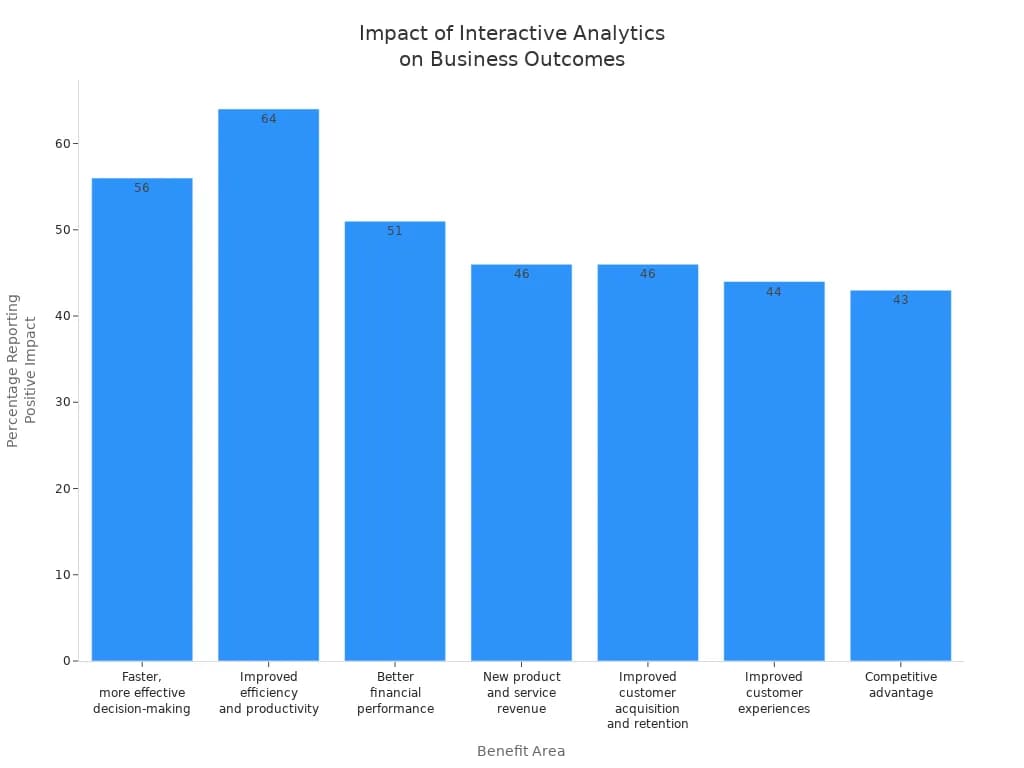
Interactive analytics help you explore your data and find answers fast. With FineVis and FineReport, you can click on charts to drill down into details. You can filter, sort, and group data with simple controls. This makes your analysis more flexible and helps you discover new insights. Many businesses report strong benefits from using interactive analytics:
Benefit Area
Percentage Reporting Positive Impact
Improved efficiency and productivity
64%
Faster, more effective decision-making
56%
Better financial performance
51%
New product and service revenue
46%
Improved customer acquisition and retention
46%
Improved customer experiences
44%
Competitive advantage
43%
You gain faster insights and make better decisions when you use interactive analytics. These tools support business intelligence by making data analysis easier for everyone.
Mobile and 3D Visualization
You can access your dashboards on any device. FineVis and FineReport offer mobile-friendly layouts, so you see your insights on phones, tablets, or large screens. FineVis also supports 3D visualization. You can use 3D charts to show complex data in a way that is easy to understand. This feature works well for industries like manufacturing and smart cities. You can interact with 3D models, rotate them, and see your analysis from different angles.
Tip: Use clear labels and simple visuals to tell your data story. Focus on key insights and avoid clutter. This helps your audience understand your analysis and take action.
Building Reporting Workflows
Automated Report Generation
You canautomate report creationusing FineReport and data factory solutions. Start by connecting your data sources and setting up ETL automation. This process transforms raw data into structured information for reporting. FineReport lets you design templates that pull data from multiple systems. You can schedule ETL automation tasks to run at regular intervals, ensuring your reports always use the latest data. Automation reduces manual work and helps you focus on analysis. You gain reliable, up-to-date insights for your business.
Tip: Use ETL automation to streamlinedata workflowsand minimize errors in your reporting process.
Scheduling and Distribution
You can schedule reports to run daily, weekly, or monthly. FineReport provides a simple interface for setting up these schedules. You choose the time and frequency, then let the system handle the rest. Reports can be distributed automatically by email, mobile app, or saved to shared folders. This ensures stakeholders receive the information they need without delay. You can customize distribution lists and formats, making it easy to share insights across your organization.
Set up automated schedules for regular reporting.
Distribute reports in multiple formats, such as PDF, Excel, or HTML.
Notify users with alerts when new reports are available.
Data Security and Permissions
You control who can view, edit, or authorize reports using FineReport’s detailed permission system. The platform links permissions to roles, which can be set for departments, custom groups, or individual users. Each report, dashboard, and directory has its own access settings. FineReport uses a database schema with tables that store permission values and entities. This structure gives you fine-grained control over data access and operations in your reporting workflows. You protect sensitive information and ensure only authorized users can make changes.
Maintaining data quality and reliability is essential for sound decision-making. You should define clear data quality objectives and use tools for profiling, cleansing, and monitoring. Embed quality checks into your data workflows for real-time validation. Automate data quality monitoring to catch issues early. Use centralized rule libraries and metadata management to enforce standards. Train your team to prioritize data quality and review processes regularly. These steps help you build trustworthy reporting workflows that support your business goals.
Core Application Scenarios
Monitoring and Alert: Real-Time Data Application
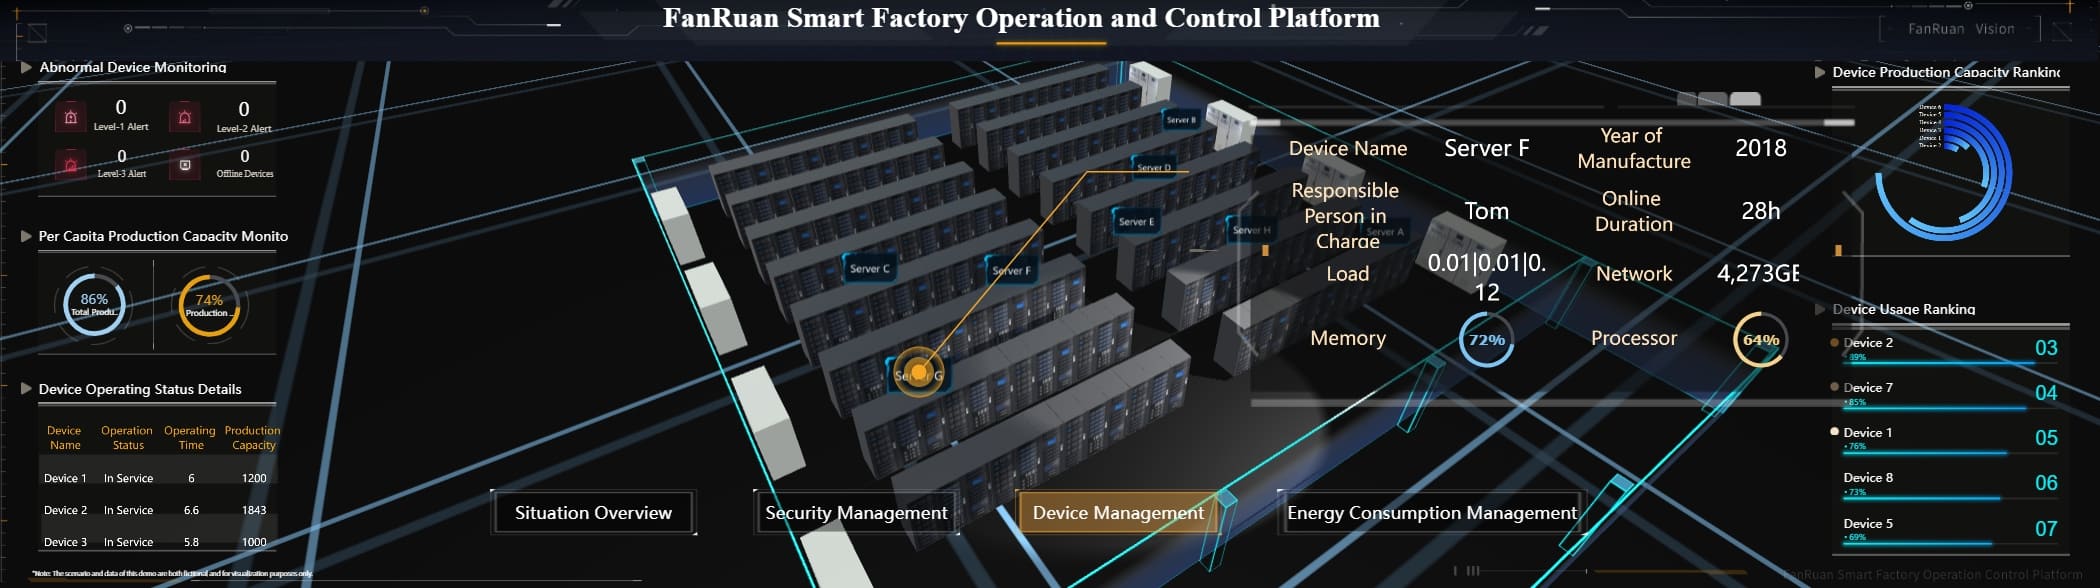
Smart Factory Operation and Control Platform Created by FineReport
You can use data factory solutions to monitor your data pipelines and receive alerts in real time. These tools help you track the health of your systems and spot issues before they become problems. Real-time analytics give you instant feedback on pipeline performance and resource usage. You can set up alerts for different events, such as failed pipeline runs or changes in factory size. When something goes wrong, you get notified right away by email or through platforms like Microsoft Teams.
Set up metric alerts for failed runs, entity counts, and system size.
Use log alerts and activity log alerts to catch unusual activity.
Monitor integration runtimes, including Azure and self-hosted options.
Collect diagnostic logs and metrics for deeper analysis and extended retention.
Visualize monitoring data with tools like Metrics Explorer, Log Analytics, Grafana, and Power BI.
Tip: Real-time analytics help you investigate issues quickly and keep your data pipelines running smoothly. You can use dashboards and workbooks to see trends and make informed decisions.
Paperless Operations
Data factory solutions help you move toward paperless operations by digitizing every step of your workflow. You can capture, share, and analyze manufacturing data without using paper forms. These systems replace manual processes with integrated software, such as Manufacturing Execution Systems and connected worker platforms. Real-time analyticslet you see what is happening on the shop floor as it happens. This digital approach reduces errors, eliminates waste, and improves collaboration across teams. You also lower costs, optimize scheduling, and enhance security. By using real-time data, you support continuous improvement and drive operational excellence throughout your enterprise.
Best Practices and Challenges
Ensuring Data Quality
You need strong data quality to get reliable results from your data pipelines. Start by profiling your data sources. This helps you understand what information you have and where problems might appear. Clean and transform your data to remove errors and duplicates. Set up validation rules and monitor your pipelines in real time. Track metadata so you know where your data comes from and how it changes. Use error handling and logging to catch issues early.
Here are steps you can follow:
Profile your data sources before building pipelines.
Clean and transform data to standardize formats and remove mistakes.
Apply validation rules and monitor pipelines in real time.
Keep metadata updated to track changes and data lineage.
Use error handling and logging to fix problems quickly.
Many organizations use automated pipelines to collect and transform data from different sources. This approach improves consistency and speeds up reporting. For example, a retail company used automated data ingestion and transformation to combine information from many regions. This reduced manual work and improved data analysis.
Overcoming Integration Issues
You may face challenges when you connect different systems and formats. Integration can become complex if your data sources use different structures. To avoid problems, plan your pipelines carefully. Use the drag-and-drop and no-code features in FineReportandFineVis to simplify integration. These tools help you connect major ERP systems and reduce errors.
Changing business needs that require updates to your pipelines.
You can avoid these issues by starting with pilot projects and testing your workflows.Monitor your pipelinesand adjust them as your needs change. Treat automation as an ongoing process. Real-time analytics and AI features in FineVis help you spot problems and improve quality control.
Tip: Use real-time monitoring and automation to keep your pipelines running smoothly and support continuous improvement.
Optimizing Performance
You want your pipelines to run fast and handle large amounts of data. Optimize your transformation steps to reduce delays. Monitor pipeline performance using built-in analytics tools. Adjust your workflows to handle more data as your business grows. Use real-time analytics to track resource usage and spot bottlenecks.
A logistics company improved performance by using machine learning in FineVis for demand forecasting. This reduced stockouts and made their pipelines more efficient. You can use similar strategies to boost your own data analysis and reporting.
Optimization Strategy
Benefit
Streamline transformation
Faster data pipelines
Monitor pipeline analytics
Early detection of issues
Scale workflows
Handle more data easily
Use real-time analytics
Quick response to changes
You can unlock powerful insights by combining Azure Data Factory or FineDataLink with FineReportandFineVis. These platforms automate your data pipelines, reduce manual errors, and deliver real-time analytics. You gain faster access to insights, improve reporting accuracy, and support business intelligence. Many organizations customize integration options to fit their industry needs. Start by piloting a workflow or exploring parameterized templates to tailor your solution. This approach helps you create reliable, scalable workflows and drive better decisions.
Click the banner below to try FineReport for free and empower your enterprise to transform data into productivity!
Real-time insights to optimize production, logistics, and decisions.
FAQ
How do you connect FineReport to different data sources?
You can connect FineReport to over 100 data sources, including SQL databases, Excel files, and APIs. Use the built-in data connector. The drag-and-drop interface makes setup quick and easy. No coding is required.
Can you automate report delivery with FineReport?
Yes! FineReport lets you schedule reports for automatic delivery. You can send reports by email, mobile app, or save them to shared folders. This feature ensures everyone gets the latest insights on time.
What makes FineVis dashboards stand out?
FineVis dashboards support over 60 chart types and 3D visualizations. You can build interactive dashboards with a zero-code, drag-and-drop interface. The dashboards adapt to any device, so you can view insights on your phone, tablet, or large screen.
Is your data secure when using FineDataLink and FineReport?
FineDataLink and FineReport use strong security features. You control user permissions, encrypt sensitive data, and monitor access. These tools help you protect your business information and meet compliance needs.