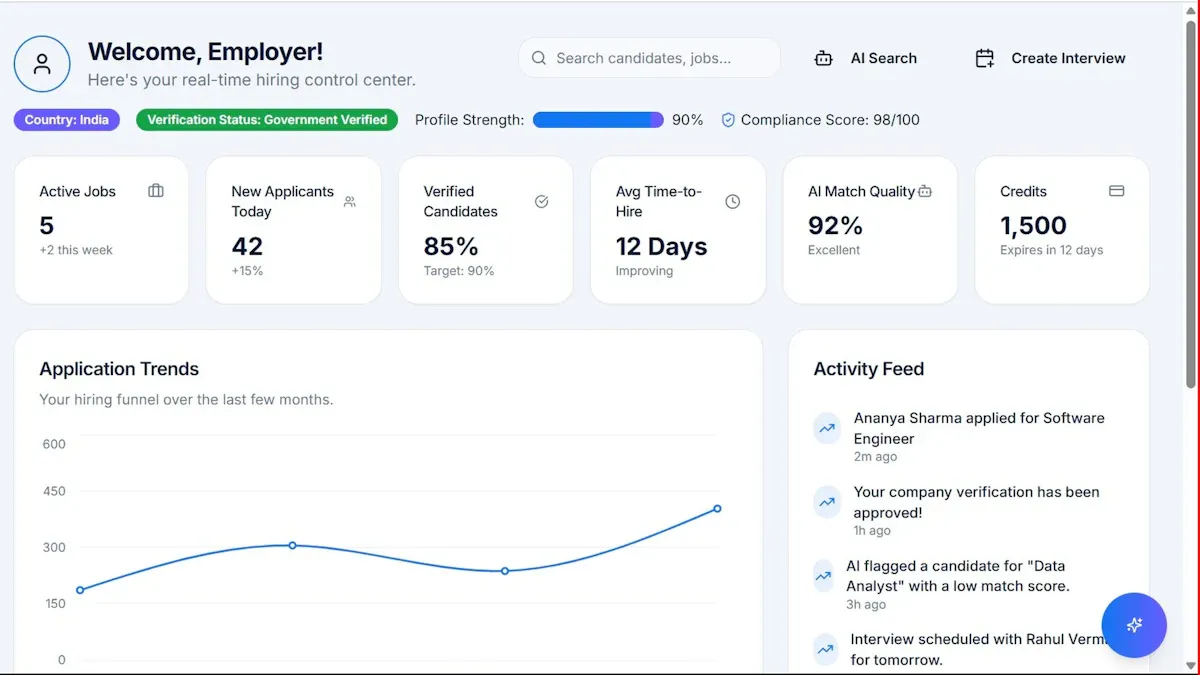
A strong business report format is not just a writing preference. It is a decision-making tool. For operations leaders, department heads, analysts, and managers, the format determines whether a report gets read quickly, trusted immediately, and acted on decisively. When reports are unclear, executives miss the point, teams debate structure instead of substance, and recommendations lose momentum. A well-structured business report solves that by organizing facts, analysis, and next steps in a way stakeholders can scan, verify, and use.

All reports in this article are built with FineReport.
What the business report format includes and why it matters
A business report is a structured document used to present information, explain findings, evaluate a situation, or recommend action. Companies use reports to support decisions such as entering a new market, reviewing monthly performance, assessing project risk, investigating incidents, or justifying budget requests.
The core value of the business report format is consistency. It helps readers know where to find the purpose, evidence, conclusions, and recommendations without digging through long blocks of text.
A formal business report is different from a quick internal update or presentation summary:
- Formal report: A complete document with front matter, structured sections, evidence, analysis, and recommendations. Often used for high-stakes decisions.
- Informal internal update: A shorter memo, email, or dashboard summary meant for routine communication or status tracking.
- Presentation summary: A visual recap designed for meetings, usually highlighting takeaways rather than documenting full reasoning.
Format directly affects three things executives care about:
- Readability: Leaders need to scan fast and still understand the issue.
- Credibility: Clear sections, labeled visuals, and logical flow signal professionalism.
- Decision quality: A report that links evidence to action reduces ambiguity and speeds approval.
Key Metrics (KPIs) for an effective business report format
When evaluating whether a report is strong enough for executive use, focus on these core elements:
- Clarity of purpose: The report states exactly what question it answers.
- Audience alignment: The detail level matches the needs of executives, managers, or technical reviewers.
- Evidence quality: Claims are backed by reliable data, examples, or documented observations.
- Logical structure: Sections appear in an order that supports understanding and action.
- Executive summary quality: The summary captures the problem, findings, and recommendation quickly.
- Visual clarity: Charts and tables simplify data instead of complicating it.
- Recommendation traceability: Each recommendation clearly connects to a finding.
- Formatting consistency: Headings, fonts, numbering, and labels stay uniform throughout.
- Actionability: The report makes next steps specific, realistic, and measurable.
- Version control: Readers can identify the latest approved version of the report.
Core sections in a standard business report format
A standard business report format usually follows a predictable structure. Not every report needs every section, but most formal reports include the parts below.
Title page, table of contents, and executive summary
The front matter sets the tone. It tells readers what the report is, who prepared it, when it was issued, and how to navigate it.
What to include on the title page
A clean title page typically includes:
- Report title
- Subtitle if needed
- Company or department name
- Author or team name
- Date of submission
- Report version or confidentiality label if applicable
A good title is specific. “Q2 Sales Review for APAC Region” is stronger than “Sales Report.”
When to include a table of contents
Use a table of contents when the report is long enough that readers may jump between sections. In practical terms, that usually means any report over a few pages, especially if it contains multiple charts, appendices, or subsections.
If your report includes many visuals, also add:
- List of figures
- List of tables
- Appendix list
How to write an executive summary
The executive summary is often the most important part of the report. Senior leaders may read only this section before deciding whether to continue.
A strong executive summary should answer four questions:
- What business issue is being addressed?
- What did the report find?
- Why do those findings matter?
- What action is recommended?
Keep it concise. In most cases, two to four short paragraphs are enough.
Simple executive summary formula:
| Element | What to write |
|---|---|
| Problem | State the issue or decision required |
| Method | Briefly explain how data was gathered or reviewed |
| Findings | Summarize the most important facts or trends |
| Recommendation | State the proposed next step clearly |
Write the executive summary last, after the full report is complete. That makes it easier to reflect the actual findings accurately.
Introduction, background, and objectives
This section tells readers why the report exists and what it will cover.
Introduction
The introduction should define the purpose of the report in direct language. Avoid broad, generic openings. Start with the business situation.
For example:
- This report evaluates the causes of declining on-time delivery in the West distribution region.
- This report assesses market demand and pricing conditions for expansion into Southeast Asia.
Background
The background gives the business context needed to understand the issue. This may include:
- Recent performance trends
- A triggering event or management request
- Market conditions
- Operational constraints
- Prior decisions or initiatives
Background should be useful, not exhaustive. Include only the context that helps the reader interpret the findings.
Objectives, scope, assumptions, and limitations
Professional reports define boundaries early. This saves confusion later.
Include:
- Objectives: What the report aims to answer
- Scope: What departments, time periods, products, or regions are covered
- Assumptions: Conditions treated as true for analysis purposes
- Limitations: Gaps in data, time constraints, or unavailable inputs
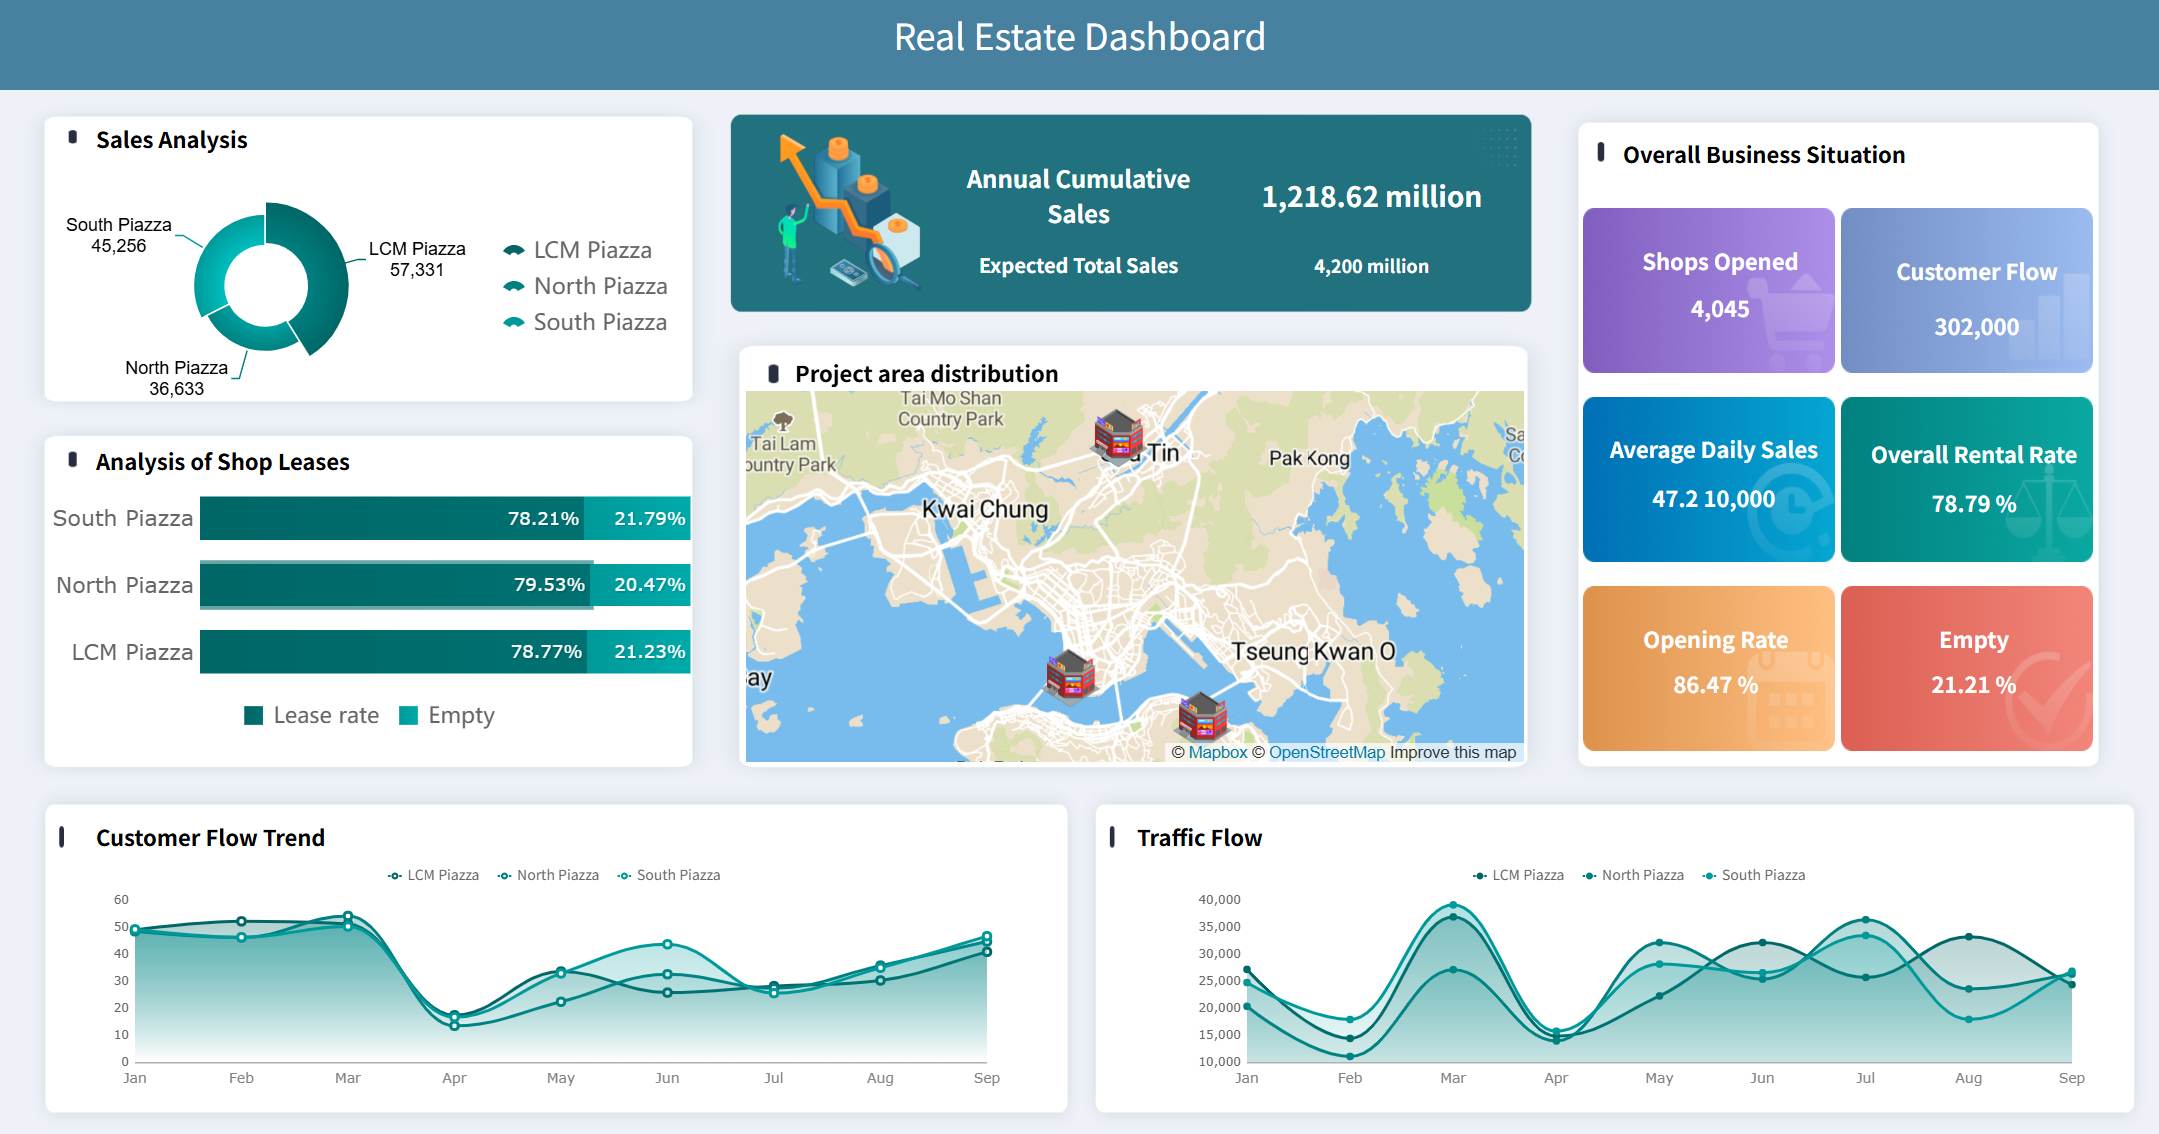
This is especially important for analytical reports. Without clear scope, readers may challenge the findings for addressing the wrong question.
Findings, analysis, and discussion
This is the body of the report. It presents evidence and explains what that evidence means.
Findings
The findings section should focus on facts:
- Sales dropped 8% month over month
- Downtime increased after a supplier change
- Customer churn was highest in one segment
- A project missed three major milestones
Keep findings separated from opinion. Use subheadings to group related points by topic, department, timeline, or business driver.
Analysis
Analysis interprets the evidence. This is where you explain patterns, relationships, root causes, and implications.
Examples:
- Revenue declined primarily because of lower repeat purchases, not new customer acquisition.
- Incident frequency increased after process changes reduced inspection checks.
- Expansion risk is driven less by demand uncertainty and more by channel partner readiness.
Discussion
Discussion adds business meaning. It connects the analysis to strategic or operational consequences.
Good discussion answers questions like:
- Why does this matter now?
- What happens if the issue is not addressed?
- Which trade-offs are involved?
- How does this compare with targets or expectations?
When to use charts, tables, and short subsections
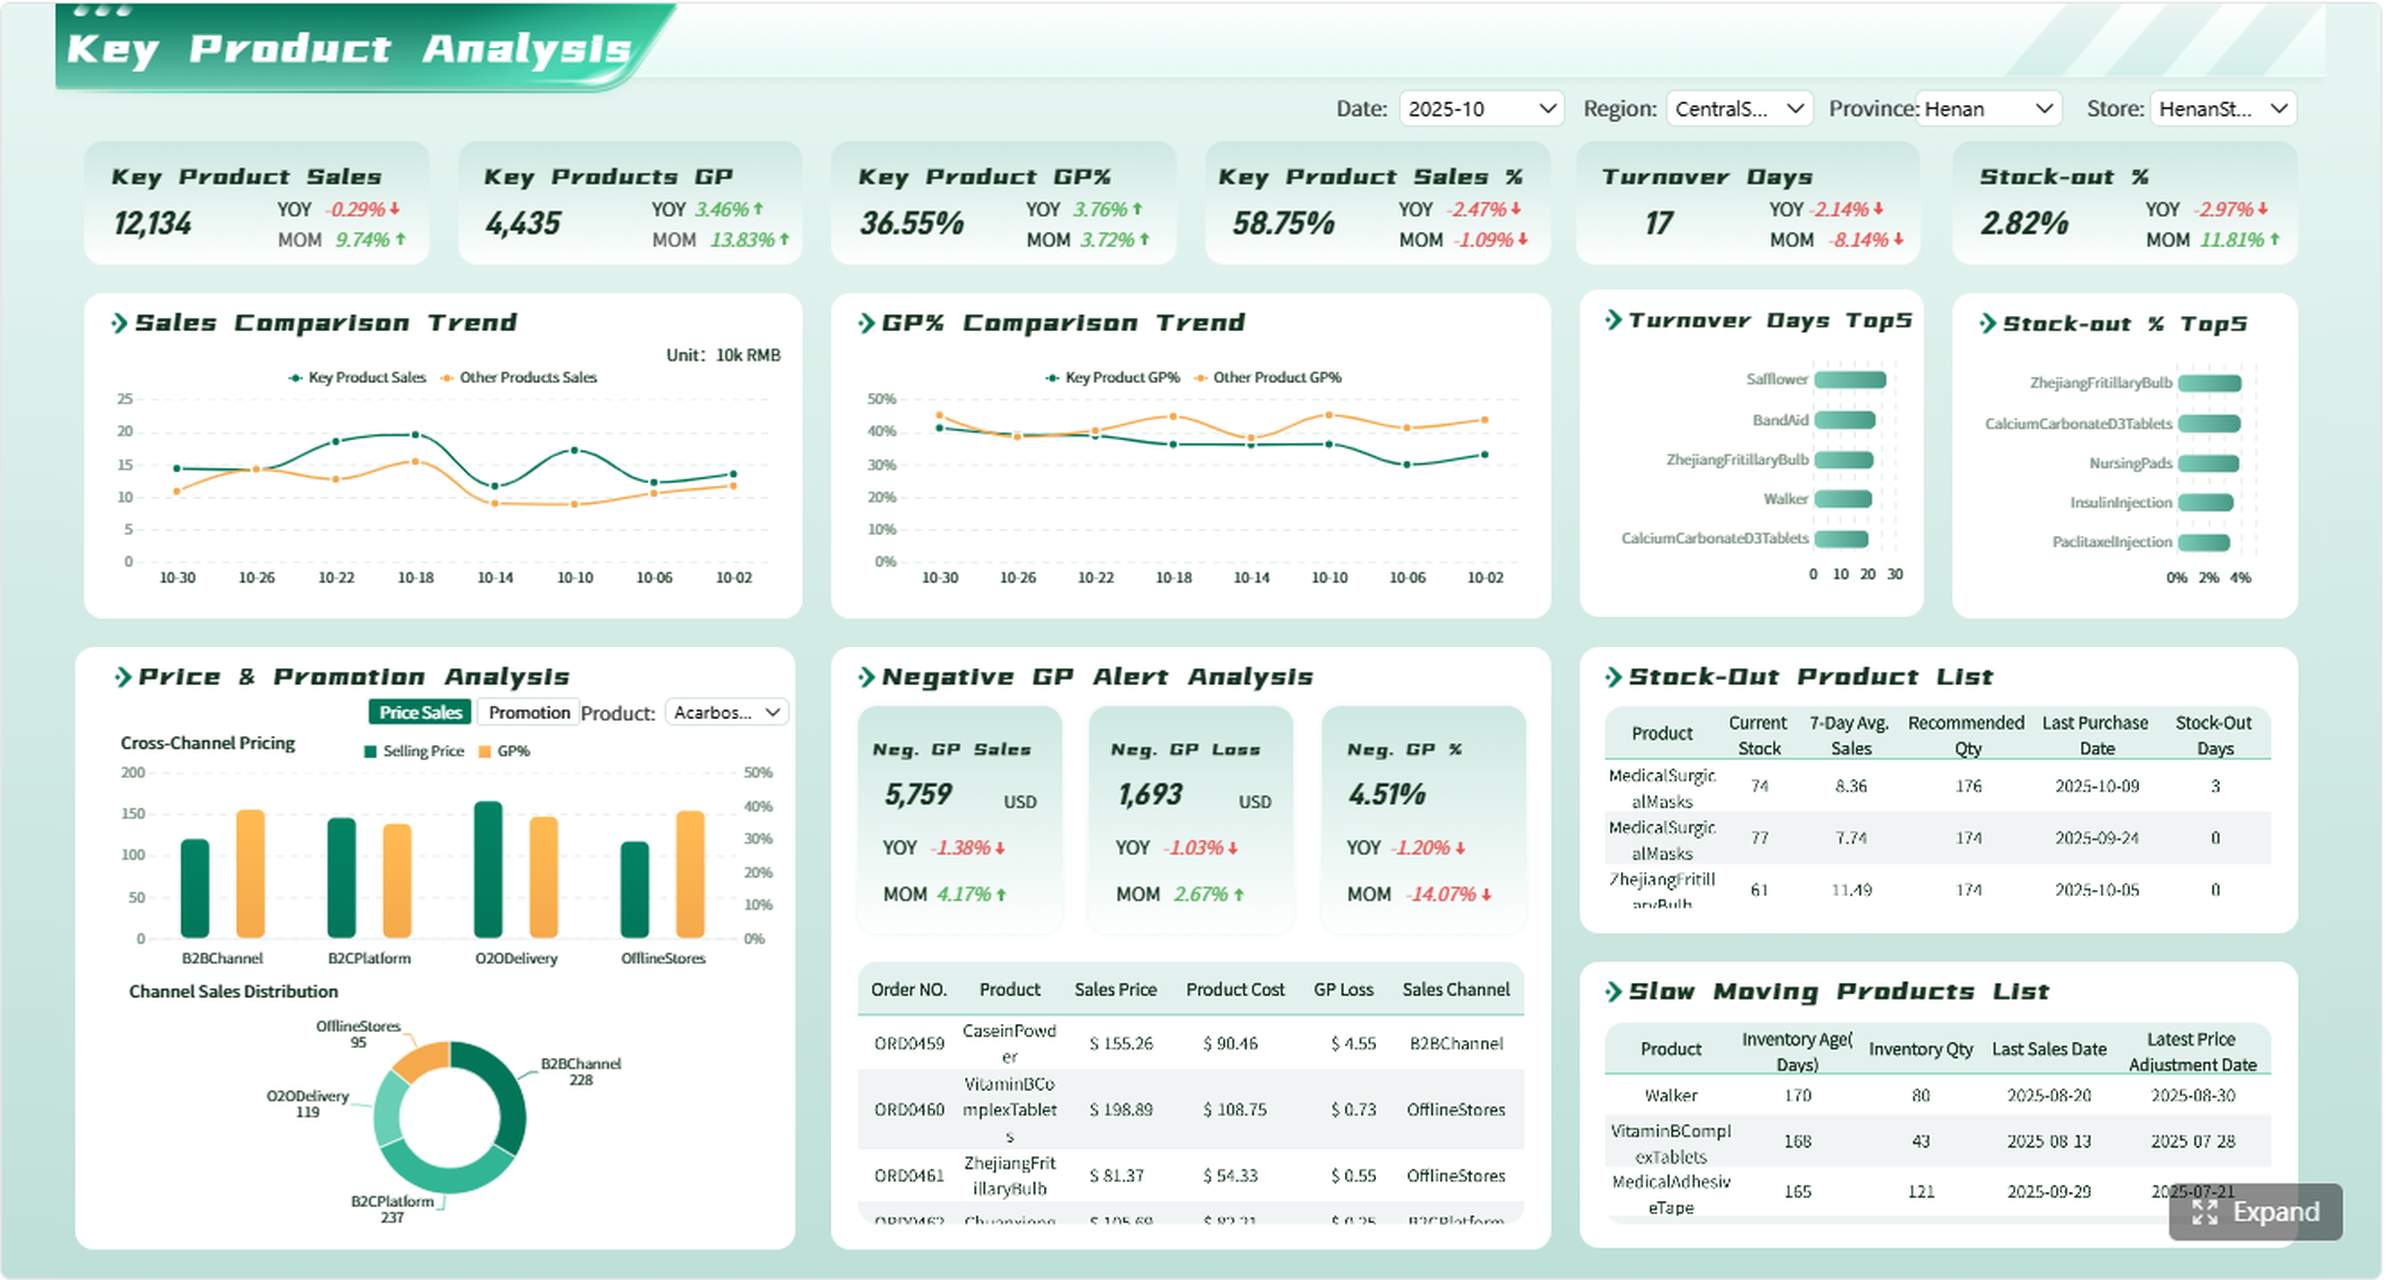
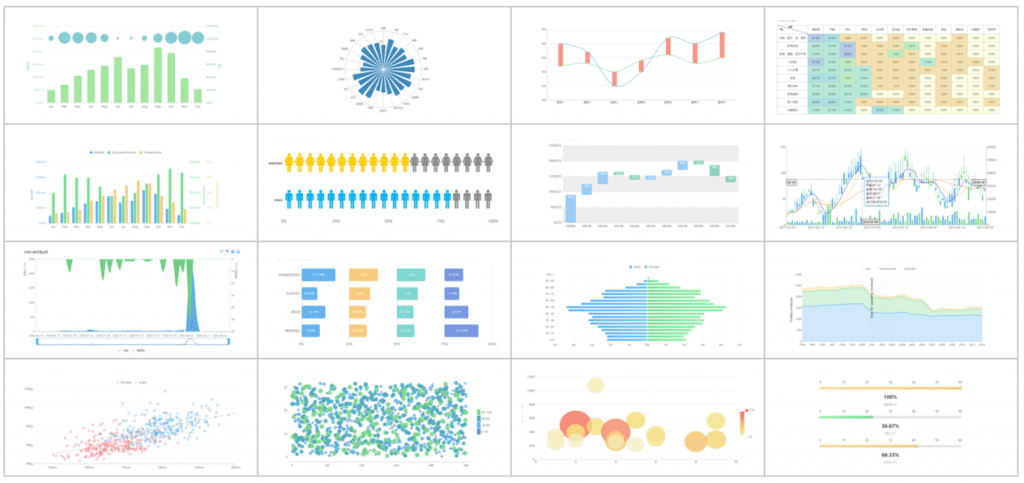
Use visuals when they reduce reading time or improve comparison.
Best uses:
- Line charts: Trends over time
- Bar charts: Comparisons across categories
- Pie or stacked charts: Composition, used sparingly
- Tables: Detailed values, exceptions, rankings, or side-by-side comparisons
Short subsections work well when the body includes multiple themes, such as:
- Financial impact
- Operational impact
- Customer impact
- Risk factors
- Regional performance
A useful rule: if a visual appears, explain it. Never assume the chart speaks for itself.
Recommendations, conclusion, and appendices
This final part turns insight into action.
Recommendations
Recommendations should flow directly from the findings. If the report found a root-cause issue, the recommendation should address it specifically.
Strong recommendations are:
- Specific
- Measurable
- Feasible
- Time-bound
- Assigned to an owner where possible
For example, instead of saying “improve reporting,” say:
- Standardize weekly inventory variance reporting across all warehouses by the first week of next quarter.
Conclusion
The conclusion is not just a repeat of the executive summary. It should reinforce the main takeaway from the full report.
Use the conclusion to:
- Restate the significance of the findings
- Confirm the answer to the original business question
- Emphasize the urgency or rationale for action
Appendices
Appendices hold supporting detail that is useful but too long for the main body.
Typical appendix items include:
- Survey instruments
- Raw data tables
- Interview notes
- Methodology detail
- Technical definitions
- Supporting calculations
Keep the main report focused. Move depth to the appendix when it supports credibility without interrupting flow.
How to write each section of a business report format clearly and professionally
Even a well-planned business report format can fail if the writing is hard to scan or the layout is inconsistent.
Structuring information for busy readers
Executives rarely read reports line by line. They scan for logic, evidence, and implications.
To make your report easier to consume:
- Use clear, descriptive headings
- Put the most important point first in each section
- Keep paragraphs short
- Use bullets for grouped points
- Sequence ideas logically from issue to evidence to action
A practical structure for most sections is:
- State the point
- Show the evidence
- Explain the business impact
- Link to the next section or recommendation
Tone matters too. Keep it objective and evidence-based. Avoid emotional language, overstatement, and unsupported certainty.
Use phrases like:
- The data indicates
- The analysis suggests
- The primary driver appears to be
- Based on the findings, the recommended action is
Formatting tips that improve clarity
Formatting is not cosmetic. It affects whether a report feels trustworthy and easy to navigate.
Essential formatting standards
Use these fundamentals consistently:
- One clean cover page
- Consistent heading levels
- Standard, readable fonts
- Adequate white space
- Uniform margins and spacing
- Page numbers
- Figure and table labels
- Consistent date and number formats
Figure and table labeling
Every visual should have:
- A clear title
- A figure or table number
- Units of measurement where relevant
- A short explanation in the text
For example:
- Figure 2. Monthly Order Volume by Region
- Table 4. Incident Severity by Site, Q1
Citations, references, and version control
In business settings, source documentation should be practical and consistent. If you use external research, market data, benchmarks, or legal requirements, cite them according to your company standard.
For internal governance, version control is critical. Add:
- Version number
- Report owner
- Approval date
- Revision history for high-impact documents
This is especially important for compliance, audit, project, and incident reporting.
Common mistakes to avoid
Many reports fail for predictable reasons.
Weak summaries
A vague executive summary is one of the most common issues. If the summary does not identify the problem, findings, and recommendation, leaders will not see the value quickly.
Unsupported claims
Never make a major statement without evidence. If the report says customer satisfaction fell due to staffing shortages, show the data behind that conclusion.
Inconsistent formatting
Changing heading styles, font sizes, numbering logic, or table formats makes a report look unfinished and unreliable.
Recommendations that do not match the evidence
If the findings show a pricing problem, but the recommendation focuses on marketing spend, the report loses credibility.
Dense text and unexplained visuals
Large text blocks slow readers down. Charts without interpretation create confusion.
Real-world examples of the business report format
The best way to understand a business report format is to see how the structure changes by use case.
Internal performance report example
A monthly operations or sales report is one of the most common internal report types. Its goal is to show what happened, why it happened, and where attention is needed next.
A simple structure might look like this:
- Title page
- Executive summary
- Monthly performance overview
- KPI results by team or region
- Variance analysis
- Risks and issues
- Recommended actions
- Appendix with detailed tables
Why this order works
- The summary gives leaders the headline story first.
- Performance overview provides context.
- KPI sections show where results exceeded or missed target.
- Variance analysis explains why.
- Risks and actions move the conversation toward management response.
A typical internal performance report may track:
- Revenue
- Gross margin
- Output volume
- Service level
- Customer complaints
- Staffing utilization
- Budget variance
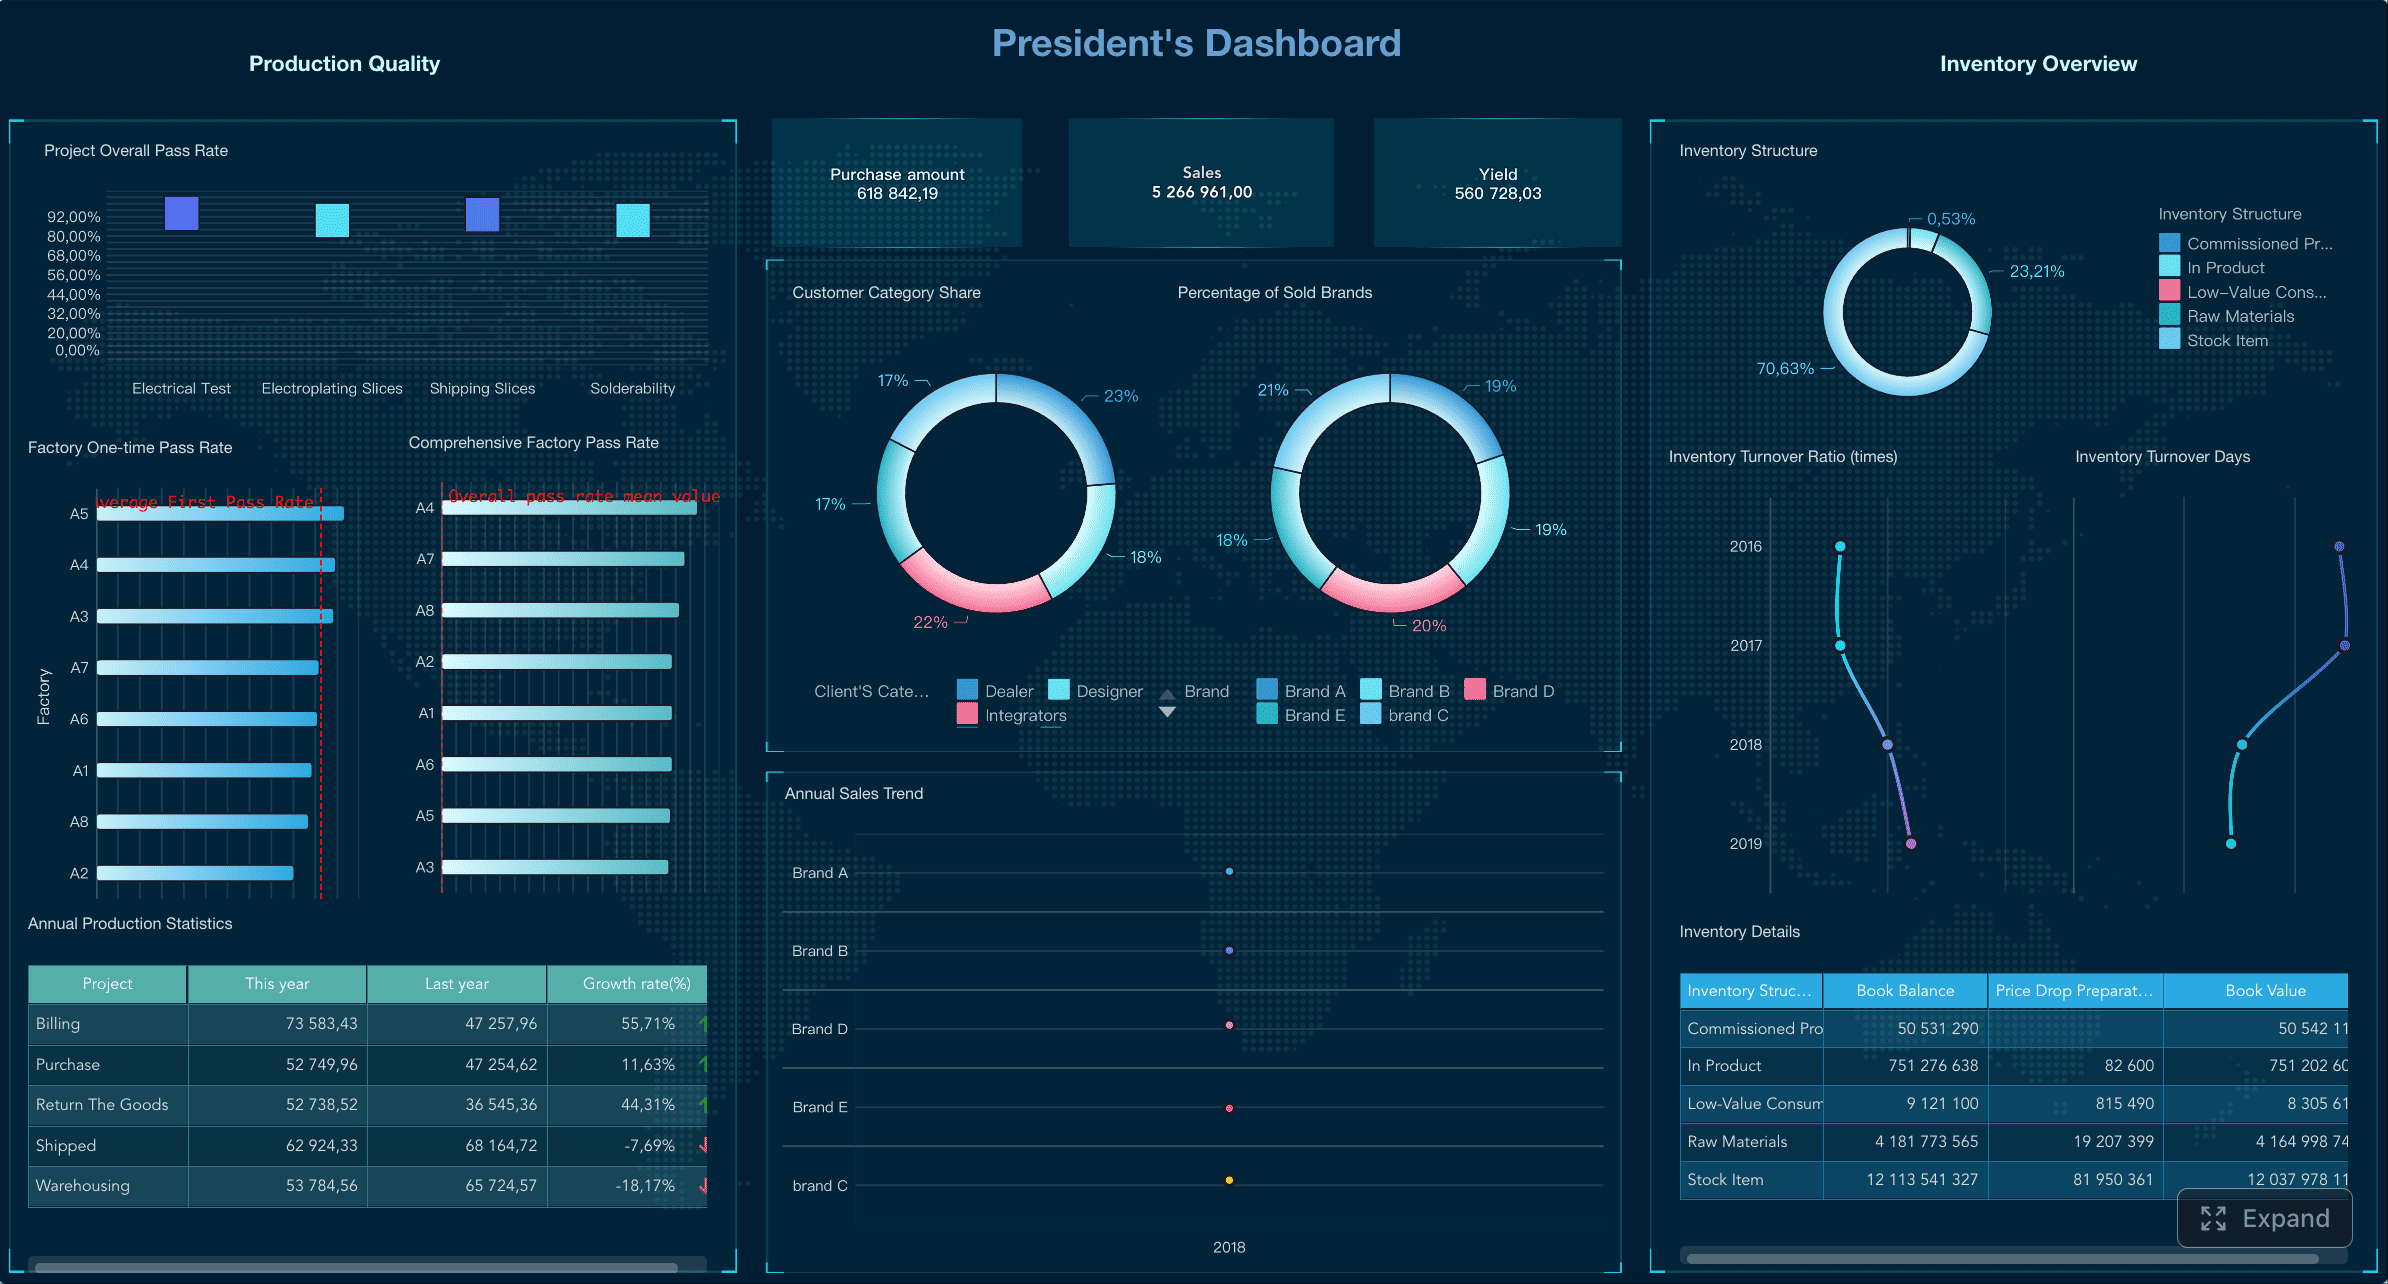
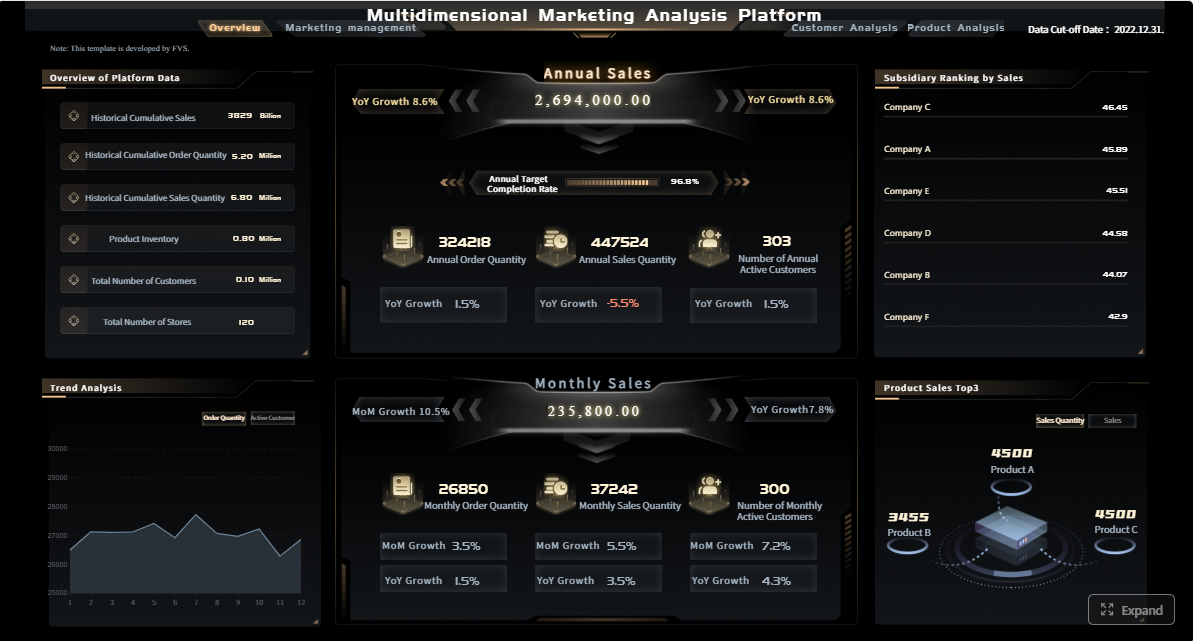
This kind of report is ideal for dashboard-driven tools like FineReport, especially when teams need recurring updates with drill-down capability across departments or locations.
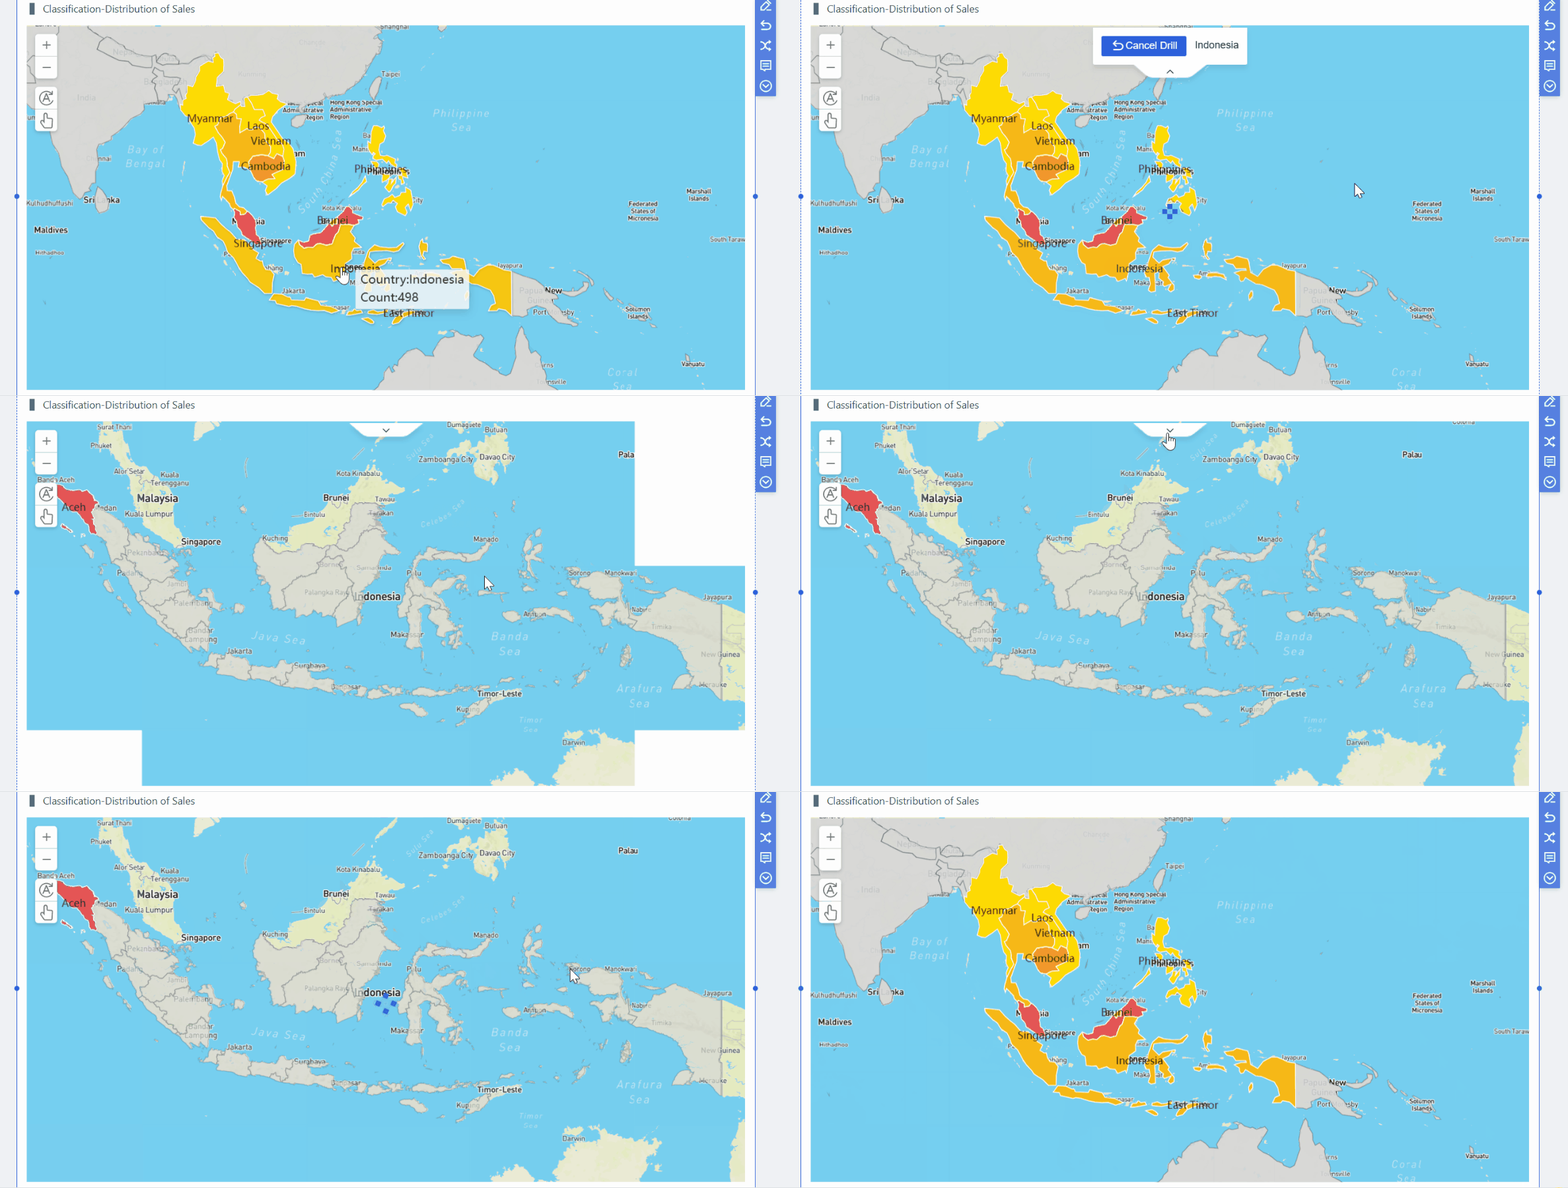 Drill-down capability across locations
Market analysis report example
A market analysis report supports strategic decisions such as expansion, pricing changes, or product launches.
A common format includes:
- Title page and executive summary
- Business objective
- Market background
- Customer demand analysis
- Competitor review
- Pricing analysis
- Risk assessment
- Recommendation and implementation path
- Appendices
What makes this format effective
A market analysis report needs to move from external data to business decision. That means the structure should gradually narrow from broad market conditions to a specific recommendation.
For example, a company evaluating expansion into a new region may present:
- Market size and growth rate
- Customer segment demand
- Competitive pricing ranges
- Distribution challenges
- Regulatory considerations
- Financial upside and risk scenarios
The recommendation section should not simply say “enter the market.” It should state conditions for entry, such as target segment, price band, pilot timeline, and performance thresholds.
Project status or incident report example
Project status reports and incident reports are designed for stakeholder visibility and operational control.
Project status report structure
A clear project report often includes:
- Project title and reporting period
- Executive status summary
- Milestone progress
- Budget and resource status
- Risks and blockers
- Decisions needed
- Next actions
Incident report structure
An incident report often includes:
- Incident description
- Date and location
- Impact assessment
- Root-cause analysis
- Corrective actions
- Preventive recommendations
- Supporting evidence in appendices
The order matters because stakeholders want immediate visibility into severity, impact, and required response before they review detailed evidence.
Templates, PDFs, and tools to speed up the process of writing a business report format
Templates and reporting tools can dramatically reduce the time needed to produce a polished report.
When to use a template
A business report template is a prebuilt structure that standardizes headings, layout, and visual conventions. It is useful when teams need consistency across recurring reports.
Use a template when:
- The report type repeats regularly
- Multiple people contribute to the report
- Leadership expects a standard format
- Compliance or audit consistency matters
- Branding and governance need to be controlled
Templates are especially valuable for:
- Monthly business reviews
- Sales reports
- Project updates
- Board reporting packs
- Incident documentation
Template vs. report built from scratch
| Approach | Best for | Main advantage | Main risk |
|---|---|---|---|
| Reusable internal template | Recurring reports | Speed and consistency | Can become rigid if never updated |
| Built from scratch | New or unusual strategic reports | Flexibility | Slower and easier to structure poorly |
A template should never force irrelevant sections into the document. Good teams customize while preserving the core logic.
Helpful resources and downloadable examples
Useful report resources typically include:
- Printable PDF examples
- Branded internal templates
- Executive summary samples
- Section-by-section writing prompts
- Preformatted tables and chart layouts
What should you look for in a strong example?
- Clear purpose statement
- Logical section order
- Good balance between text and visuals
- Recommendations tied to evidence
- Clean formatting that supports scanning
For organizations that produce frequent reports, a reporting platform can go beyond static templates. FineReport is a practical option when teams want to build repeatable, branded report outputs from live business data instead of manually copying numbers into slides or documents.
Best practices to implement a strong business report format
If you want your report process to work at scale, follow these consultant-level practices.
1. Start with the decision, not the document
Before writing, ask:
- What decision will this report support?
- Who will read it first?
- What action should happen after reading it?
This prevents over-reporting and keeps the content relevant.
2. Build a section map before drafting
Create the skeleton first:
- Executive summary
- Purpose and scope
- Findings
- Analysis
- Recommendation
This reduces rework and keeps the argument tight.
3. Standardize KPIs and definitions
Many reporting conflicts come from inconsistent metrics. Define terms such as revenue, churn, utilization, or incident severity before distributing the report.
4. Use visuals only where they reduce decision time
Do not add charts just to make the report look analytical. Use them where comparison, trend recognition, or anomaly detection matters.
5. Automate recurring reporting where possible
If the same report is created weekly or monthly, automate data refresh, chart generation, and template output. This cuts manual errors and gives decision-makers faster access to current information.
Final checklist before submitting a business report format
Before you send any formal business report, run through a final review. This step catches the issues that most often weaken credibility.
Ask these questions:
- Does the report answer the original business question?
- Are all major claims supported by evidence?
- Do recommendations clearly follow from the findings?
- Is the document formatted consistently?
- Are data values, labels, and calculations accurate?
- Is the level of detail right for the intended audience?
- Are visuals labeled and explained clearly?
- Have grammar, spelling, and page references been checked?
- Are version number and ownership details included if needed?
Section-by-section checklist you can reuse
| Section | Final check |
|---|---|
| Title page | Title is specific, date and author are correct |
| Table of contents | Headings and page numbers match final draft |
| Executive summary | Problem, findings, and recommendation are clear |
| Introduction | Purpose and context are stated directly |
| Background | Only relevant context is included |
| Objectives and scope | Boundaries, assumptions, and limitations are defined |
| Findings | Facts are organized and easy to verify |
| Analysis | Patterns and implications are explained clearly |
| Recommendations | Actions are specific and linked to evidence |
| Conclusion | Final takeaway answers the business question |
| Appendices | Supporting detail is included without cluttering the main body |
| Formatting | Fonts, headings, numbering, and labels are consistent |
A professional business report format makes your message easier to trust and easier to act on. Whether you are preparing a monthly performance update, a market analysis, or a project incident review, the right structure turns raw information into clear business direction. If your team wants to standardize report creation, improve visual clarity, and automate recurring reporting workflows, it makes sense to move beyond manual documents and into a more scalable reporting system.

FAQs
A standard business report usually includes a title page, table of contents for longer documents, executive summary, introduction, background, findings, analysis, conclusion, recommendations, references, and appendices when needed.