Why Social Media Reporting Tools Matter Now
Proving the ROI of social media is no longer optional. Marketing directors, agency leads, and executives need clear, timely, and actionable reporting that connects social activity to business outcomes. A static dashboard can show what happened, but modern teams also need to understand why performance changed and what to do next.
The best social media reporting tools in 2026 do more than collect metrics from LinkedIn, Meta, TikTok, YouTube, Instagram, and X. They help teams analyze performance, compare campaigns, detect anomalies, build executive-ready summaries, and turn social data into decisions.
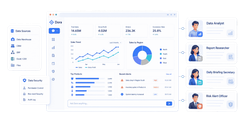
This is where the market is shifting from dashboards to digital employees. With FineBI + Dora, teams can combine trusted BI dashboards with an AI Data Agent experience. FineBI provides the governed reporting foundation, while Dora helps users ask questions in chat, generate chart-based answers, receive scheduled summaries, and monitor key social media signals before the next meeting.
What Are the Best Social Media Reporting Tools?
The best social media reporting tools are platforms that collect, organize, analyze, and present social performance data. They help marketing teams track campaigns, audience growth, engagement, conversion, sentiment, competitive performance, and customer response activity across channels.
Basic tools focus on native metrics and scheduled exports. More advanced tools combine dashboards, data modeling, automation, AI summaries, and governance. For business teams, the goal is not just to make a report. The goal is to make social performance easier to understand and act on.
A strong social media reporting tool should answer three questions:
- What is happening across our social channels?
- Why did performance change?
- What should the team do next?
That makes social media reporting both an analytics workflow and a decision workflow.
Why Traditional Social Media Dashboards Fall Short
Traditional dashboard-centric reporting tools are useful, but they often create friction for fast-moving marketing teams.
They Are Static and Reactive
Dashboards usually show what already happened. Users still need to log in, adjust filters, compare charts, and interpret the result. That slows response time when engagement drops, sentiment shifts, or a campaign needs adjustment.
They Create Information Overload
Social teams track dozens of metrics across many channels. Without a clear narrative, important signals can get buried in noise. A reporting tool should help users separate meaningful changes from normal fluctuation.
They Often Lack Context
A chart might show a spike in engagement, but it may not explain whether the spike came from a campaign, an influencer mention, a competitor event, or a viral topic. Good reporting connects the number to the story behind it.
They Require Manual Reporting Work
Weekly updates, monthly client reports, executive summaries, and campaign recaps often require manual exports and slide preparation. That pulls analysts and marketers away from strategy.
They Miss Time-Sensitive Opportunities
Without alerts or proactive monitoring, teams may notice negative sentiment, falling share of voice, or campaign underperformance too late.
The Shift From Dashboards to AI Data Agents
The next generation of social media reporting tools is moving toward AI-powered Data Agents. These are not generic chatbots. They sit on top of trusted data assets, understand business definitions, and help users complete repeatable analytics workflows.
An AI Data Agent can support social media reporting in several ways:
- Continuous monitoring: Track campaign KPIs, competitor mentions, sentiment, and engagement changes.
- Intelligent synthesis: Connect performance data with campaign context, audience segments, and historical trends.
- Proactive communication: Push alerts, scheduled briefings, and summaries to the right stakeholders.
- Guided investigation: Let users ask follow-up questions in natural language and receive chart-based answers.
- Workflow follow-up: Help assign owners, track unresolved issues, and keep recurring reports moving.
This changes the reporting model from people searching dashboards to AI helping people ask, analyze, generate, push, alert, and follow up.
Core Features to Look For in the Best Social Media Reporting Tools
When choosing the best social media reporting tools, look beyond basic charts. The strongest platforms support both self-service analysis and repeatable automation.
Multi-Channel Data Integration
A useful reporting tool should bring social data together from the platforms your team actually uses. This may include LinkedIn, Meta, Instagram, TikTok, YouTube, X, Pinterest, social listening tools, CRM systems, web analytics, and ad platforms.
The more channels you manage, the more important unified reporting becomes. Native platform analytics are helpful, but they are usually siloed.
Governed KPI Definitions
Metrics such as engagement rate, conversion rate, share of voice, and response time should be defined consistently. If every team calculates performance differently, leadership cannot trust the report.
FineBI is useful here because it helps teams centralize metrics, dashboards, permissions, and semantic definitions. Dora can then answer questions from that trusted foundation.
Automated Reporting
Recurring reports should not require manual assembly every week. Look for scheduled delivery, template-based reports, automated exports, and AI-generated summaries.
For agencies, this is especially important because client reporting can consume a large amount of team time.
Natural Language Analysis
Modern teams increasingly expect to ask questions in plain language:
- Which campaign had the highest engagement rate last week?
- Why did TikTok traffic drop on Thursday?
- Which posts drove the most conversions?
- How does our share of voice compare with our top competitors?
An AI Data Agent like Dora can turn these questions into governed analysis instead of forcing every user to rebuild dashboards manually.
Alerts and Anomaly Detection
The best tools should help teams catch issues early. Useful alerts might include:
- Engagement dropping below a threshold
- Negative sentiment rising sharply
- Paid social spend increasing without conversions
- A competitor gaining share of voice
- Customer response time exceeding SLA targets
Executive-Ready Storytelling
Social media reporting should be easy for non-specialists to scan. A strong report should include summary insights, context, visual evidence, and recommended next steps.
Key Social Media Metrics to Track
The right metrics depend on your business model and social strategy, but most teams should track the following areas.
Engagement Rate
Engagement rate usually compares likes, comments, shares, saves, or other interactions against followers, reach, or impressions.
Business value: It shows whether content is resonating with the audience.
AI workflow: Dora can monitor engagement rate against historical trends and competitor benchmarks, then flag unusual drops or spikes for review.
Social-Driven Conversion Rate
Social-driven conversion rate compares conversions from social traffic with total social sessions or clicks.
Business value: It connects social activity to pipeline, sales, signups, or other business outcomes.
AI workflow: Dora can retrieve conversion data, compare it with campaign spend, and push weekly summaries to sales and marketing leadership.
Share of Voice
Share of voice compares your brand mentions with total mentions in your market or category.
Business value: It shows brand visibility relative to competitors.
AI workflow: Dora can act as a Risk Alert Officer by monitoring share of voice and alerting the PR team when a competitor's visibility changes quickly.
Sentiment Analysis
Sentiment analysis tracks positive, neutral, and negative mentions or comments.
Business value: It helps teams detect reputation risk, campaign reception, and customer frustration.
AI workflow: Dora can schedule sentiment briefings, highlight major shifts, and suggest a review of recent posts or service interactions.
Customer Response Time and Resolution Rate
For brands that handle customer service through social media, response time and resolution rate are operational metrics.
Business value: They affect customer satisfaction and public brand perception.
AI workflow: Dora can generate weekly support reports by channel, team, or agent, and flag cases that exceed SLA thresholds.
11 Best Social Media Reporting Tools for 2026
The best choice depends on your team size, reporting complexity, budget, and governance needs. The 11 best social media reporting tools below fit different levels of maturity, from free native analytics to governed AI reporting platforms.
FineBI + Dora
FineBI + Dora is a strong fit for enterprises and advanced teams that need governed analytics, AI-assisted reporting, and cross-functional visibility.
FineBI provides the trusted BI foundation: dashboards, metric modeling, data integration, permissions, and semantic assets. Dora adds the AI Data Agent layer, turning those assets into a conversational assistant that can answer questions, generate visual analysis, send scheduled summaries, monitor anomalies, and follow up with responsible owners.
This combination is useful when social media reporting needs to connect with broader business data, such as CRM, web analytics, revenue, customer service, or campaign spend.
FineBI + Dora is especially useful for teams that need:
- Governed KPI definitions across marketing teams
- Social performance dashboards connected with business data
- AI chat analysis based on trusted BI assets
- Scheduled executive or client briefings
- Alerts for campaign anomalies, sentiment risk, or share-of-voice changes
- A scalable path from static reporting to Agentic BI workflows
Sprinklr
Sprinklr is an enterprise platform for social media management, customer experience, listening, and marketing workflows. It is well suited for large organizations that need broad social listening, publishing, engagement, and analytics capabilities in one environment.
It is a strong option when social data is part of a larger customer experience operation.
Hootsuite Analytics
Hootsuite Analytics is a mature social media analytics option for teams that already use Hootsuite for scheduling and social management. It supports multi-platform tracking, campaign reporting, benchmarking, and increasingly AI-assisted recommendations.
It is a practical choice for teams that want social publishing and reporting in the same workflow.
Sprout Social
Sprout Social is a social media management and analytics platform for teams that need publishing, engagement, listening, and reporting in one place. It is especially useful for brands that want polished reports across multiple social networks.
It is a strong fit for teams that need social performance reporting, audience insights, and collaboration workflows together.
Agorapulse
Agorapulse combines social inbox management, publishing, monitoring, and reporting. Its reporting features are practical for teams that need scheduled reports, campaign tracking, and clear summaries for managers or clients.
It is useful for small and mid-sized teams that want one tool for day-to-day social media operations and recurring reports.
Metricool
Metricool is a reporting and analytics tool for social media, web, and advertising performance. It supports dashboards, competitor analysis, campaign tracking, and automated reports.
It is a good fit for marketers and agencies that need affordable multi-channel reporting without a heavy BI implementation.
Social Status
Social Status focuses on automated social media reporting, competitor benchmarking, and white-labeled client reports. It is especially useful for agencies that need polished recurring reports without heavy manual formatting.
It is a good fit when client communication and reporting speed are the primary priorities.
Whatagraph
Whatagraph is a visual reporting and dashboard platform designed for marketing teams and agencies. It supports drag-and-drop report building, automated delivery, and multi-channel marketing data connectors.
It is useful when teams need simple, client-ready reports across social, paid, web, and campaign data.
Buffer Analyze
Buffer Analyze is a lightweight option for teams that want clear social media metrics without a complex enterprise setup. It is best suited for small teams, startups, and brands that need clean reporting for core channels.
It is a good fit when ease of use matters more than advanced governance or deep customization.
Looker Studio
Looker Studio is a flexible visualization tool that can be used for social media reporting through connectors and blended data sources. It can be cost-effective, but it usually requires more setup and maintenance than dedicated social reporting tools.
It is useful for teams that already have technical reporting support and want flexible dashboards.
Native Platform Analytics
Native analytics tools such as Meta Business Suite, TikTok Analytics, LinkedIn Analytics, YouTube Analytics, and Instagram Insights are free and channel-specific.
They are useful for tactical platform decisions, but they become limiting when teams need cross-channel reporting, executive summaries, automated delivery, or business outcome analysis.
How to Choose Among the Best Social Media Reporting Tools
Choosing among the best social media reporting tools starts with the reporting job you need the tool to do. The right choice is not always the platform with the longest feature list. A strong tool should match your team size, channel mix, reporting cadence, data governance needs, and the business decisions your reports are supposed to support.
Startups and Solo Marketers
Prioritize ease of use, low cost, and core metrics. Native analytics, Buffer, Metricool, or a simple dashboard setup may be enough. For small teams, the right option is usually the one that makes weekly performance checks fast and easy.
Growing Teams and Agencies
Prioritize report automation, client-ready outputs, multi-channel views, and reusable templates. Social Status, Whatagraph, Hootsuite, Agorapulse, or a BI-based workflow can help reduce manual reporting time. For agencies, reporting tools should make recurring client reports consistent, polished, and easy to reuse.
Large Enterprises and Advanced Teams
Prioritize governance, scalability, permissions, semantic definitions, and AI-assisted workflows. FineBI + Dora or enterprise social platforms are stronger fits when social reporting needs to connect with sales, service, finance, and leadership workflows. For enterprises, a strong platform should combine dashboard reporting, trusted metric definitions, role-based access, automated alerts, and AI-assisted analysis.
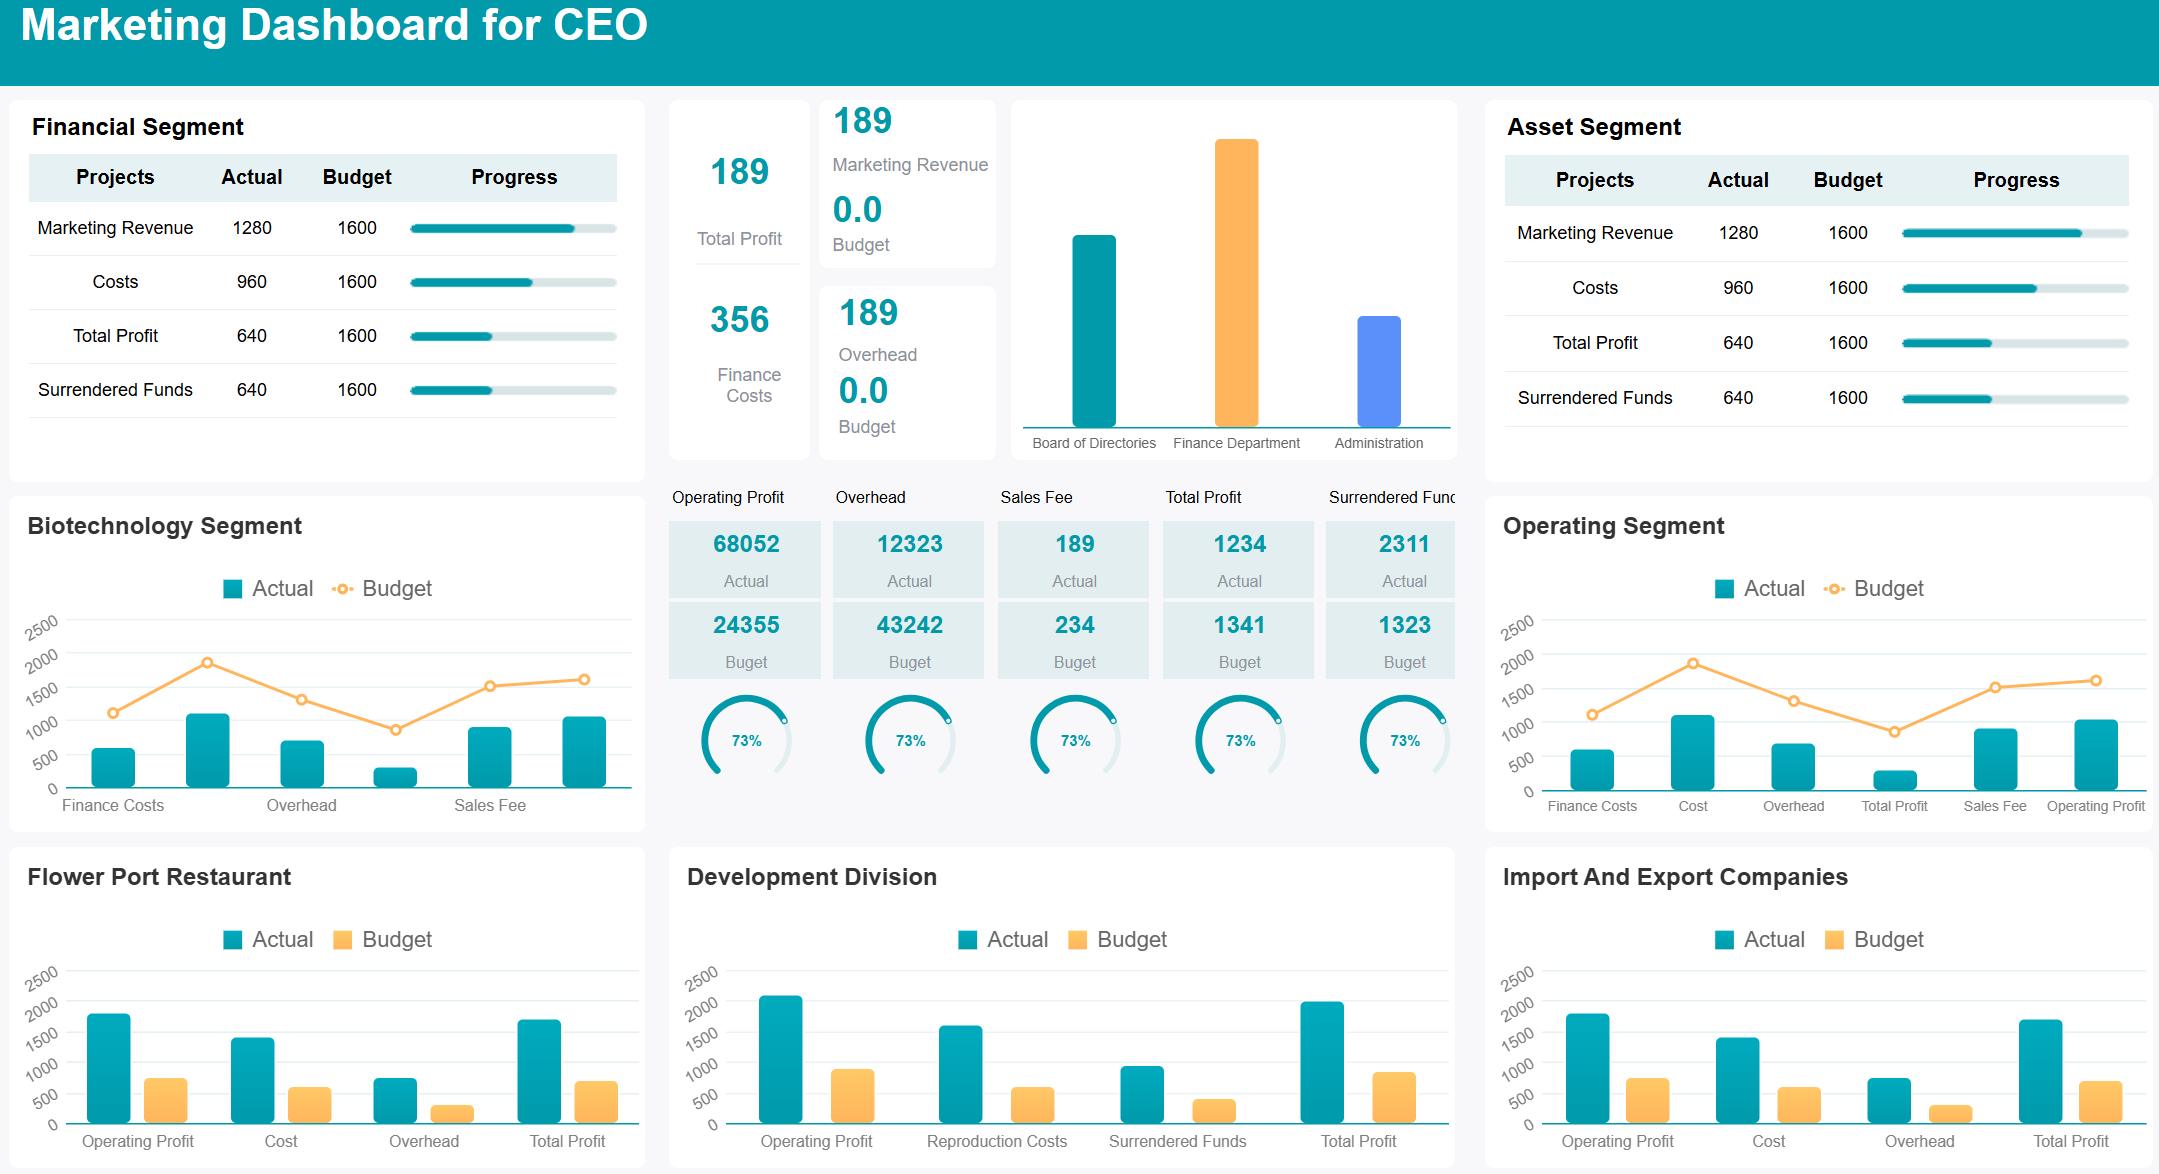
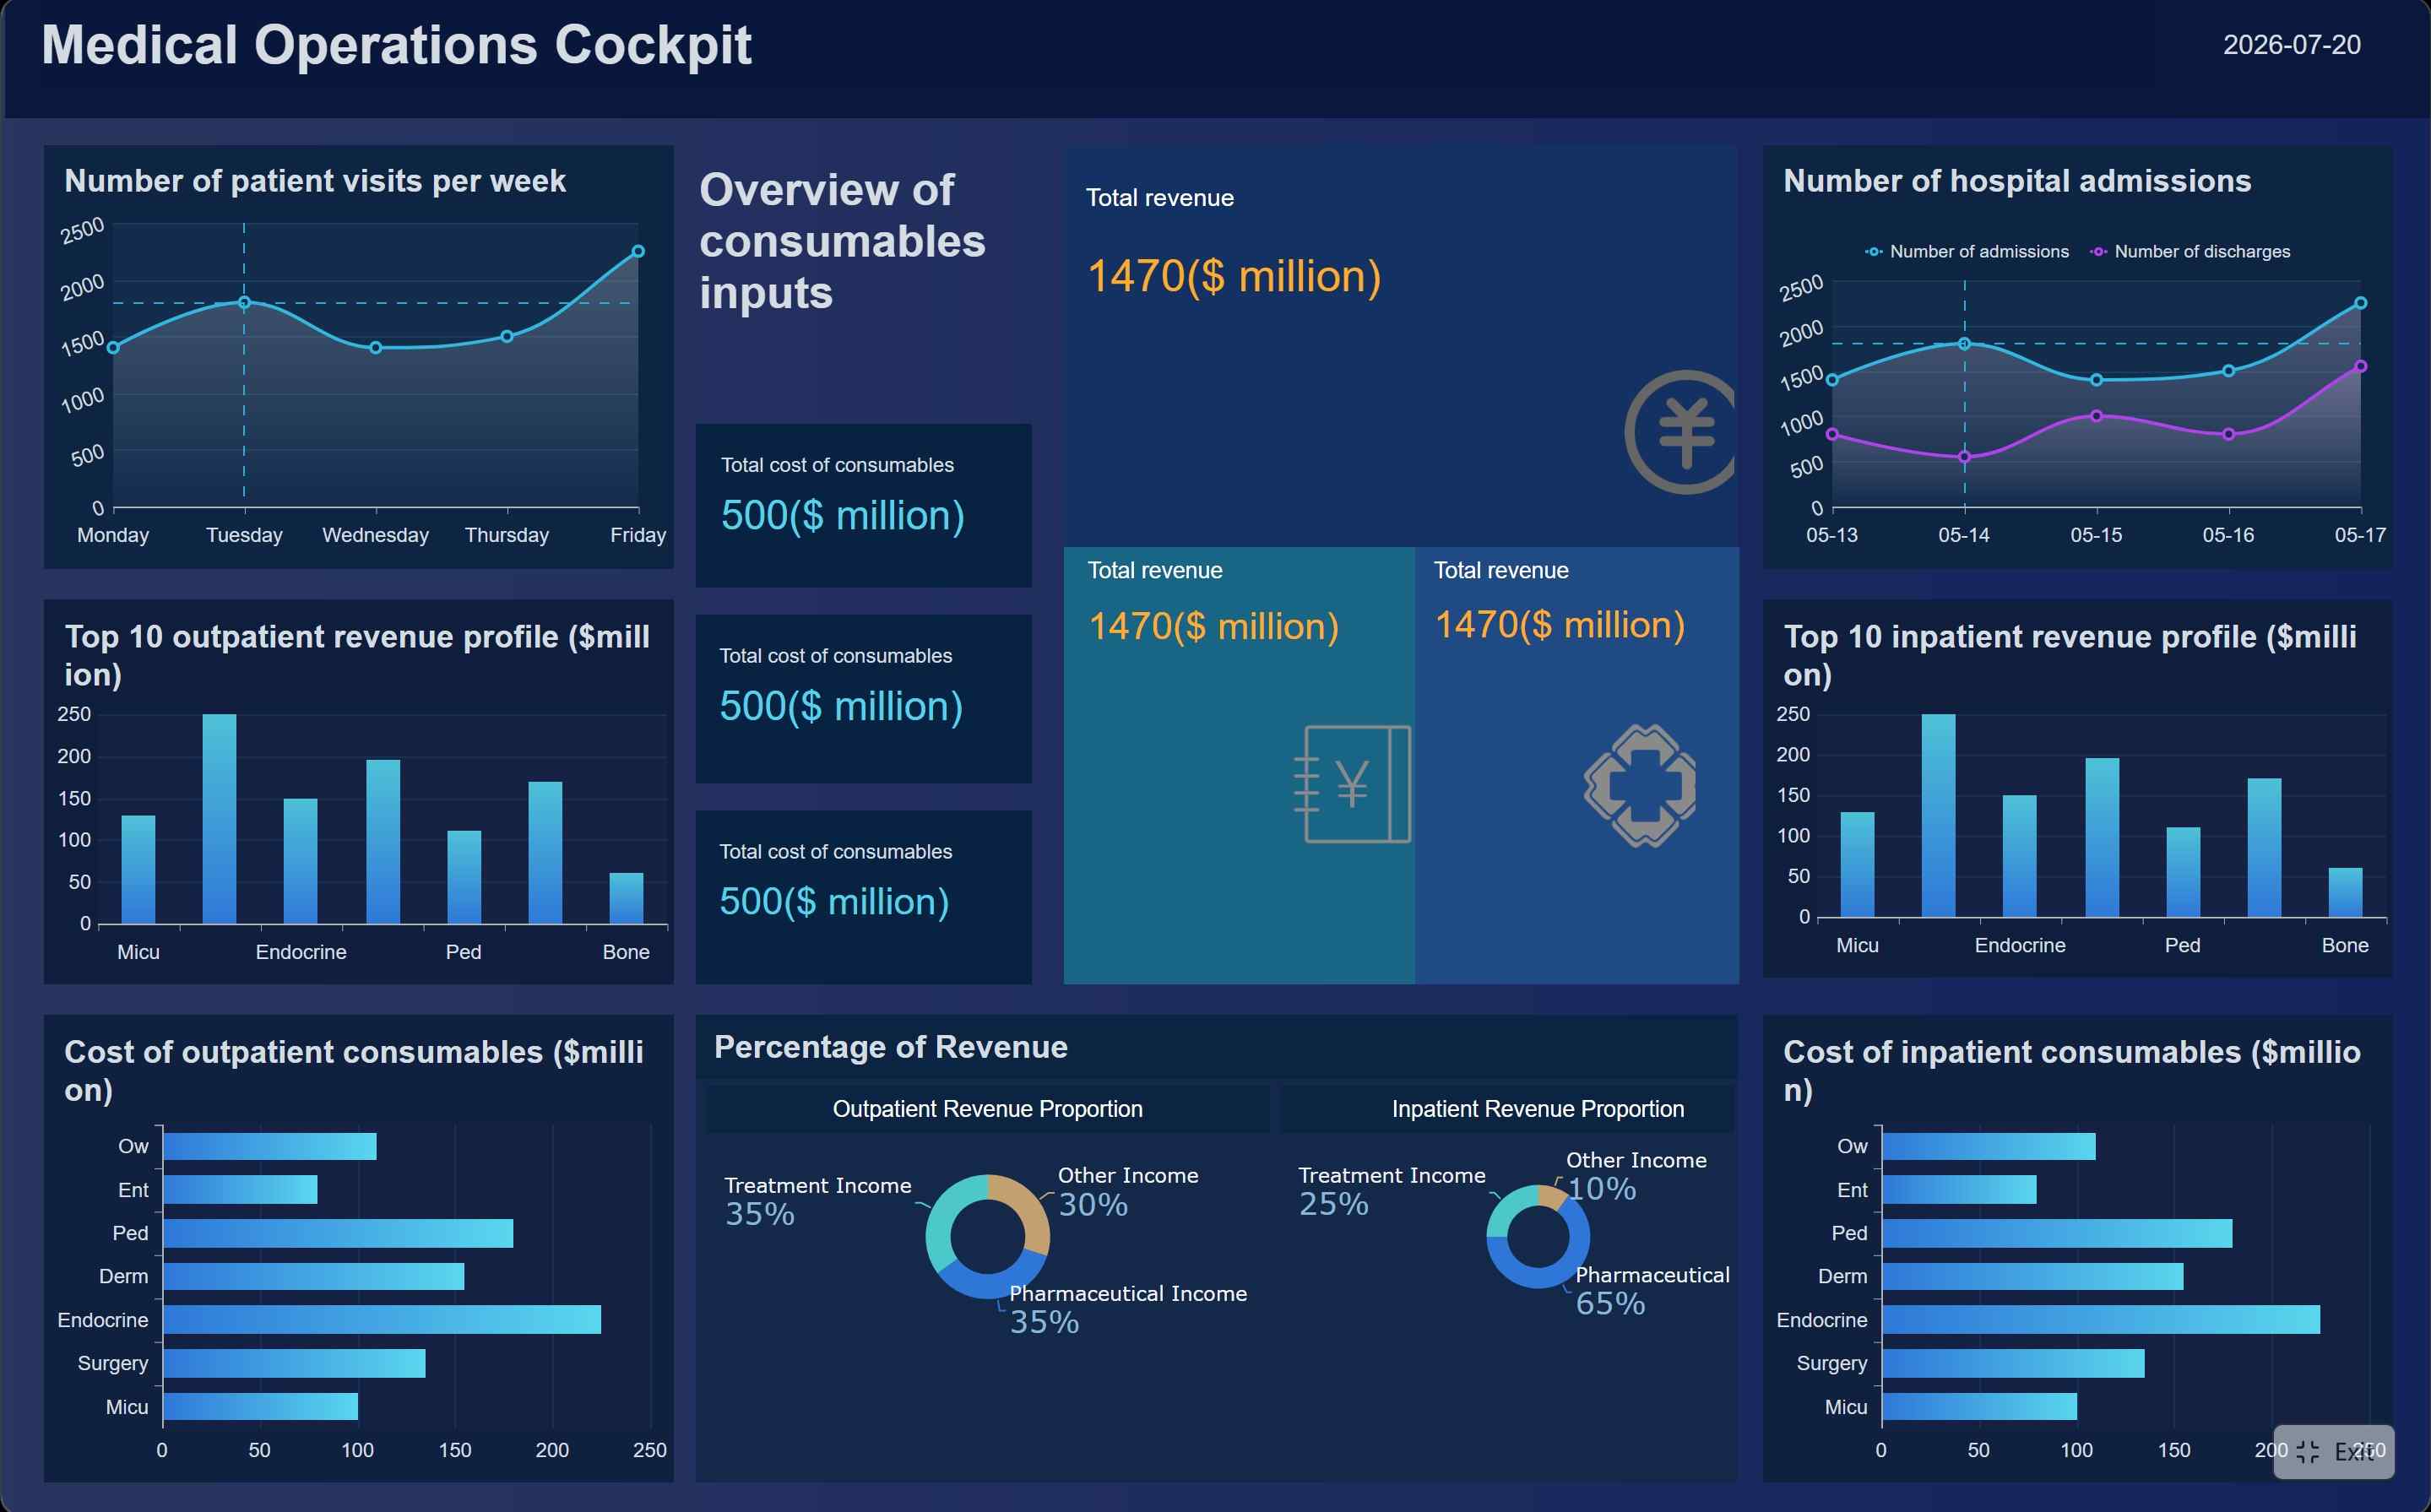
All reports in this article are built with FineBI .
A Practical Social Media Reporting Scenario
Imagine it is Monday morning. Instead of logging into five dashboards, a Marketing VP uses one of the best social media reporting tools in the stack and asks their AI Data Analyst in team chat:
"Show me last week's social performance across all channels, highlight any anomalies, and compare our engagement rate to our top two competitors."
With FineBI + Dora, the workflow can run like this:
- Dora retrieves trusted data from FineBI dashboards and semantic definitions.
- Dora interprets the request using the team's approved KPI definitions.
- Dora generates a concise chart-based answer in chat.
- Dora highlights unusual changes, such as an engagement dip on Thursday.
- Dora cites the dashboard source and data refresh time.
- Dora suggests a follow-up question, such as analyzing the content themes behind the engagement dip.
This turns a manual investigation into a faster, more repeatable analysis workflow. It also shows why reporting tools should support more than charts. They should help teams move from cross-channel social media analytics to decision-ready recommendations.
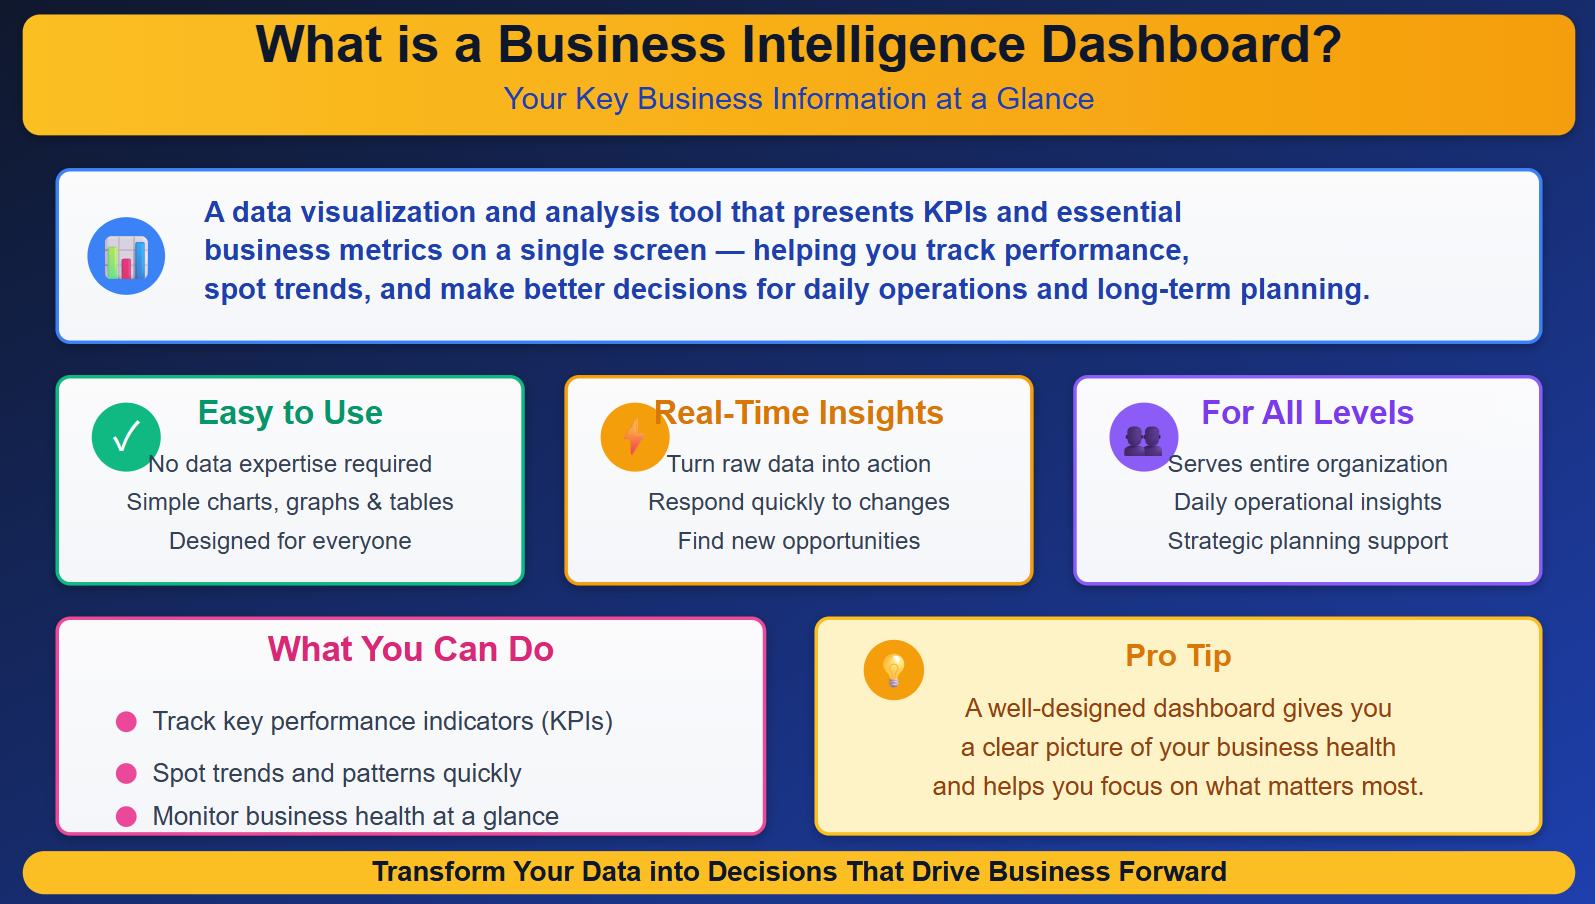
All reports in this article are built with FineBI.
Social Media Reporting Best Practices
Define KPI Ownership First
Before implementing a tool, define which metrics matter, how each metric is calculated, and who owns it. This keeps reports consistent and prevents confusion during leadership reviews. Even the best social media reporting tools cannot fix unclear KPI ownership.
Treat BI as the Semantic Layer
When using FineBI, build calculated metrics, filters, permissions, and business terminology into the BI layer. Dora can then use that governed foundation to answer questions more reliably. This is especially important when social media reporting software needs to connect social metrics with CRM, revenue, customer service, and campaign spend data.
Automate Recurring Workflows
Start with high-value reporting tasks such as weekly leadership summaries, monthly client reports, competitive share-of-voice updates, or campaign performance recaps. The tool should reduce repetitive report preparation, not create another dashboard that someone has to manually interpret.
Use Alerts for Fast-Moving Risks
Set thresholds for sentiment drops, conversion issues, response time breaches, campaign underperformance, or competitor activity. Alerts are most valuable when they are tied to clear owners and next steps.
Keep Humans in the Review Loop
AI-generated summaries should support decision-making, not replace judgment. Have analysts or campaign owners review important summaries, especially during the early rollout.
FineBI + Dora for the Best Social Media Reporting Tools Stack
Building a modern social media reporting system manually can become complex. Teams need to connect many channels, define metrics consistently, build dashboards, prepare summaries, monitor risks, and serve different stakeholders. This is why many teams compare reporting tools not only by chart design, but also by governance, automation, and AI workflow support.
FineBI solves the reporting foundation problem. It helps teams centralize data, define governed metrics, build dashboards, and create a trusted semantic layer for marketing analysis. For teams evaluating the best social media reporting tools, this governed foundation matters because every report needs consistent KPI logic.
Dora solves the workflow automation problem. It turns that foundation into an AI assistant that can answer questions, generate dashboard-style analysis views, push scheduled summaries, monitor anomalies, and follow up with responsible owners. This makes FineBI + Dora a practical option for companies that want AI-powered social media reporting tools rather than another static dashboard.
Together, FineBI + Dora give marketing teams a practical path from manual reporting to governed, AI-assisted social media intelligence.

Get Ready-to-Use Dashboard Templates in Fine Gallery
Conclusion: From Social Reports to Social Intelligence
Choosing the best social media reporting tool is no longer just about picking the dashboard with the most charts. It is about choosing a system that helps your team understand performance, explain changes, and act faster.
For small teams, native analytics or lightweight reporting platforms may be enough. For agencies, automated client reporting can save hours every month. For enterprises, governed data, AI-assisted analysis, and cross-functional workflow automation become much more important.
The best social media reporting tools in 2026 will combine unified data, clear KPI definitions, automated reporting, and AI-assisted analysis. With FineBI as the governed BI foundation and Dora as the AI Data Agent layer, marketing teams can move from static reporting to proactive social media intelligence.
FAQs
What are the best social media reporting tools?
The best social media reporting tools collect, analyze, and present performance data from social channels. They help teams track engagement, audience growth, conversions, sentiment, campaign performance, and competitive activity.
What is the best social media reporting tool for enterprises?
For enterprises, the best tool usually needs governance, permissions, metric consistency, cross-system data integration, and automation. FineBI + Dora is a strong option when teams want BI dashboards plus AI-assisted reporting workflows. It is especially useful for enterprises comparing the best social media reporting tools for governed AI analysis.
Which social media metrics matter most?
Important metrics include engagement rate, reach, impressions, follower growth, click-through rate, social-driven conversions, share of voice, sentiment, customer response time, and resolution rate.
How can AI improve social media reporting?
AI can summarize performance, answer questions in natural language, detect anomalies, send scheduled briefings, monitor risks, and suggest follow-up analysis based on trusted data.
Are native platform analytics enough?
Native analytics can be enough for small teams focused on one or two channels. They become limiting when teams need cross-channel reporting, automated summaries, business outcome analysis, or executive-ready reporting.
How do FineBI and Dora work together for social media reporting?
FineBI provides governed dashboards, metrics, and data models. Dora adds a conversational AI layer that can answer questions, generate visual summaries, send briefings, monitor anomalies, and support follow-up workflows.