Digital dashboard software is a platform that centralizes data from multiple sources into visual, real-time dashboards for faster monitoring, reporting, and decision-making.
10 best digital dashboard software tools in 2026
1. Tool-by-tool comparison snapshot
Here is a quick view of the leading digital dashboard software tools covered in this guide:
2. Features, pros, cons, and best use cases for each digital dashboard software
1. FineBI
One-sentence overview:FineBI is a self-service business intelligence and digital dashboard software platform designed for teams that need scalable dashboards, governed analytics, and fast access to business data across departments.
Key Features:
Broad data connectivity across databases, cloud apps, files, and enterprise systems
Self-service dashboard creation for business users
Interactive drill-down, filters, and cross-analysis
Centralized governance, permissions, and data security controls
Pixel-perfect reporting and scheduled distribution
Mobile-friendly dashboard access
Pros & Cons:
Pros:
Strong balance between self-service usability and enterprise-grade governance
Well-suited for executive dashboards, operational reporting, and cross-functional analytics
Flexible data preparation and modeling capabilities
Effective choice for organizations that need both dashboards and formal reporting
Cons:
May offer more capability than very small teams need
Initial setup is more involved than lightweight dashboard-only tools
Best For (Target user/scenario):
Mid-sized companies and enterprises
Leadership teams needing unified KPI visibility
Organizations that want to standardize dashboards across finance, sales, operations, and marketing
For teams comparing long-term dashboard platforms, FineBI stands out as one of the most balanced options because it supports both business-user dashboard building and enterprise control. That makes it a particularly strong choice when you need more than isolated charts and want a centralized analytics layer behind them.
One-sentence overview: Tableau is a leading analytics and digital dashboard software platform known for powerful visual exploration and highly customizable dashboards.
Key Features:
Advanced visual analytics and drag-and-drop dashboard building
Extensive data connectors
Interactive filters, drill-down paths, and storyboards
Organizations prioritizing visual exploration over simplicity
3. Power BI
One-sentence overview: Power BI is Microsoft’s business analytics platform that combines dashboarding, reporting, and data modeling at a competitive price point.
Key Features:
Native integration with Excel, Teams, Azure, and Microsoft Fabric ecosystem components
Interactive dashboards and drill-through reporting
Strong value for organizations already using Microsoft tools
Powerful analytics capabilities for the price
Good balance of dashboard creation and deeper reporting
Cons:
DAX and modeling can be difficult for non-technical users
Sharing and licensing structure may be confusing
Performance tuning may be needed on complex datasets
Best For (Target user/scenario):
Microsoft-centric companies
Finance, operations, and IT teams
Businesses looking for cost-efficient BI dashboards
4. Looker Studio
One-sentence overview: Looker Studio is a free, web-based dashboard tool that helps teams build connected reports, especially for Google marketing and website data.
Key Features:
Native integrations with Google Analytics, Google Ads, Search Console, and BigQuery
Shareable cloud dashboards
Custom charts and report templates
Scheduled email delivery
Community connector ecosystem
Pros & Cons:
Pros:
Free entry point for dashboard creation
Familiar option for marketers using Google tools
Fast to deploy for basic reporting workflows
Cons:
Limited governance and enterprise controls
Performance can vary with large or blended data sets
Advanced data modeling is limited compared with BI platforms
Best For (Target user/scenario):
Startups and small businesses
Marketing teams focused on Google ecosystem reporting
Users who need simple, low-cost dashboards
5. Databox
One-sentence overview: Databox is a KPI-focused digital dashboard software platform built for quick visibility into business performance across common SaaS tools.
Key Features:
Prebuilt metrics and dashboard templates
KPI scorecards and goal tracking
Mobile apps and TV dashboards
Alerts and scheduled reporting
Integrations with CRM, marketing, and sales tools
Pros & Cons:
Pros:
Easy to set up and use
Good for executive summaries and simple performance tracking
Useful mobile experience
Cons:
Less flexible for deep custom analytics
Advanced transformations may be limited
Can feel restrictive for complex reporting needs
Best For (Target user/scenario):
Small businesses
Sales and marketing teams
Leaders who want quick KPI snapshots without BI complexity
6. DashThis
One-sentence overview: DashThis is a marketing-focused dashboard software tool designed to automate recurring client and campaign reports across major advertising and analytics platforms.
Key Features:
Native marketing integrations
Prebuilt marketing report templates
Automated report refresh and scheduled sharing
White-label reporting options
Consolidated multi-channel campaign dashboards
Pros & Cons:
Pros:
Strong fit for agencies and in-house marketing teams
Reduces manual reporting effort
Useful template-driven setup for recurring reports
Cons:
Less suitable for finance, operations, or company-wide BI
More specialized than general-purpose dashboard platforms
Businesses that need automated stakeholder reporting
7. Geckoboard
One-sentence overview: Geckoboard is a lightweight dashboard platform built to display live business metrics on office screens and simple web dashboards.
Key Features:
Live KPI dashboards
Simple visual widgets
TV mode and sharing capabilities
Integrations with support, sales, and operations tools
Goal indicators and status monitoring
Pros & Cons:
Pros:
Very easy to understand and deploy
Effective for live team visibility
Good for customer support and operations environments
Cons:
Limited analytical depth
Less suitable for multi-layer reporting
Customization is narrower than BI-focused platforms
Best For (Target user/scenario):
Operations teams
Support teams and sales floors
Organizations wanting real-time KPI wallboards
8. Klipfolio
One-sentence overview: Klipfolio is a customizable online dashboard software platform aimed at businesses that need flexible KPI dashboards from multiple systems.
Key Features:
Wide connector library
Custom metric formulas and visual components
Dashboard publishing and sharing
Real-time and scheduled data updates
KPI monitoring across departments
Pros & Cons:
Pros:
Flexible for custom business dashboards
Good breadth of connectivity
Suitable for teams that want tailored metrics
Cons:
Setup can take time
Interface may feel less intuitive for new users
Not always the simplest option for non-technical teams
One-sentence overview: Monday.com is a work management platform with dashboard capabilities that help teams track projects, resources, and operational progress visually.
Key Features:
Project dashboards tied to boards and workflows
Workload, timeline, and status widgets
Automations and team collaboration features
Permissions and workspace controls
Templates for operations and project tracking
Pros & Cons:
Pros:
Strong for project visibility and execution tracking
Easy for teams already managing work inside the platform
Combines dashboards with action-oriented workflows
Cross-system reporting can be limited compared with BI tools
Dashboarding is strongest within Monday.com use cases
Best For (Target user/scenario):
Project managers
Operations teams
Companies wanting simple work dashboards connected to execution
10. Qlik Sense
One-sentence overview: Qlik Sense is an enterprise analytics platform that offers governed self-service dashboards and associative data exploration for complex reporting environments.
Key Features:
Usually requires stronger internal analytics maturity
Best For (Target user/scenario):
Enterprises
IT-led analytics programs
Organizations managing many data sources and governance requirements
3. Which digital dashboard software is best for your team?
Best option for startups and small businesses: Looker Studio or Databox
Best fit for enterprises with complex data environments:FineBI, Qlik Sense, or Tableau
Best choice for marketers needing automated reporting: DashThis
Best solution for teams that want simple project dashboards: Monday.com
Best all-around option for executive and business intelligence dashboards:FineBI
Why digital dashboard software matters in 2026
Modern digital dashboard software is no longer just a reporting layer. In 2026, teams expect a platform that delivers real-time visibility, automated reporting, and cross-functional access to trusted metrics without depending on manual spreadsheet work.
Executives want instant visibility into strategic KPIs. Marketers need cross-channel campaign dashboards that refresh automatically. Operations teams need live performance tracking. Project managers need status, workload, and delivery views that help teams act quickly. The common need is the same: one place to monitor performance and make better decisions faster.
The best dashboard platforms now support more than attractive charts. They help organizations:
Consolidate fragmented data
Standardize reporting across teams
Reduce manual update cycles
Improve accountability with shared KPIs
Create governed access to trusted business metrics
In this guide, the tools are compared using the criteria that matter most in real buying decisions:
Data integrations and connector depth
Dashboard customization and template flexibility
Reporting automation
Collaboration and governance controls
Ease of use, mobile access, and scalability
How we evaluated the 10 best digital dashboard software
Key features we compared
To identify the best digital dashboard software options, we focused on practical platform capabilities rather than surface-level design alone.
Data integrations and connectors
A dashboard is only useful if it can access the systems your business relies on. We looked at how well each platform connects to:
A low-cost tool can become expensive if reporting complexity grows. On the other hand, investing in a stronger platform early can reduce future migration costs. That is one reason many scaling companies evaluate FineBI seriously when they want a platform that can support both immediate dashboard needs and broader BI maturity over time.
Use-case recommendations by team and goal
For marketing and reporting teams
Marketing teams usually need dashboards that combine campaign metrics, attribution data, and recurring stakeholder reports with minimal manual work.
Best options:
DashThis for agency and campaign reporting automation
Looker Studio for Google ecosystem reporting on a budget
Databox for high-level KPI tracking
FineBI for companies that want marketing dashboards connected to wider business performance data
If your reporting needs are mostly channel-based and repetitive, DashThis is efficient. If you want to connect marketing data with sales, finance, or regional business performance, FineBI offers a stronger path to unified reporting.
For project and operations teams
Operations and project teams need dashboard software that surfaces KPIs, workload, team throughput, and process efficiency.
Best options:
Monday.com for project execution dashboards
Geckoboard for real-time operational visibility
Klipfolio for custom KPI dashboards
FineBI for broader operational analytics across multiple systems
Monday.com is best when your dashboard must live inside the work management process. FineBI is better when operational visibility depends on multiple systems, historical analysis, or executive rollups.
For leadership and cross-functional visibility
Executives need dashboards that summarize performance across sales, finance, operations, and marketing without forcing teams into disconnected reporting silos.
Best options:
FineBI for enterprise-ready executive and business intelligence dashboards
For leadership reporting, consistency and trust matter more than visual novelty. This is where platforms with strong governance and scalable semantic layers tend to outperform lighter dashboard tools.
What data sources need to connect today and later?
Make a realistic inventory of current systems and likely future additions. A tool that works for one ad platform or one spreadsheet today may become limiting when CRM, ERP, finance, and warehouse data need to be combined.
Who will build dashboards, and who will consume them?
If analysts are building and executives are consuming, a more advanced BI tool may make sense. If business users must self-serve without technical support, usability becomes a more important factor.
How important are white-labeling, governance, and audit controls?
Agencies may prioritize white-label delivery. Enterprises often need permissions, governance, audit trails, and security layers. These requirements can quickly narrow your shortlist.
What level of customization is necessary for your workflows?
Some teams only need simple KPI widgets. Others require drill-through analysis, custom formulas, embedded dashboards, or standardized executive reporting across regions and business units.
Common mistakes to avoid
Choosing based on visuals alone instead of integration depth
A dashboard that looks polished but cannot reliably connect to your business systems will create reporting friction. Connectivity and data trust should come before visual preference.
Overpaying for enterprise features your team will not use
Not every company needs embedded analytics, advanced governance, or large-scale semantic modeling on day one. Match tool complexity to actual reporting maturity.
Ignoring adoption, training, and maintenance requirements
A powerful platform only works if teams use it consistently. Consider onboarding effort, internal ownership, documentation, and the ongoing maintenance burden before buying.
Final verdict: the best digital dashboard software for different needs
Choosing the best digital dashboard software depends on your reporting complexity, data environment, and team structure. There is no single winner for every use case, but there are clear leaders by category.
If you need a practical recommendation for most growing organizations, FineBI is the strongest overall choice. It combines self-service dashboard creation, strong governance, cross-functional reporting, and scalability in a way many dashboard-only tools cannot match. For businesses that want to move beyond isolated KPI screens and build a more durable reporting foundation, it is one of the most complete options in 2026.
FAQs
Digital dashboard software brings data from multiple sources into one visual view so teams can track KPIs, monitor performance, and make faster decisions. It is commonly used for executive reporting, operations, sales, marketing, and finance.
Start with your use case, data sources, budget, and who will build the dashboards. Lightweight tools are better for simple KPI tracking, while BI platforms like FineBI, Power BI, Tableau, and Qlik Sense are better for deeper analysis and governance.
Dashboard software often focuses on visual KPI monitoring and reporting, while business intelligence tools usually add data modeling, deeper analytics, and governance features. Many modern platforms combine both, but some are still stronger in one area than the other.
Small teams often prefer tools like Looker Studio, Databox, or Geckoboard because they are easier to set up and more affordable. If you need more advanced reporting later, you may outgrow these simpler options.
Yes, many dashboard tools support live or near real-time data depending on the connector, refresh settings, and source system. Tools like Geckoboard and Databox are especially popular for real-time KPI visibility, while BI platforms can also offer scheduled or live updates.
Product Trial
FineReport
Pixel-perfect reports · Interactive dashboards · Easy data entry · Digital twins
 Key Features:
 Key Features:
 Key Features:
 Key Features:
 Key Features:
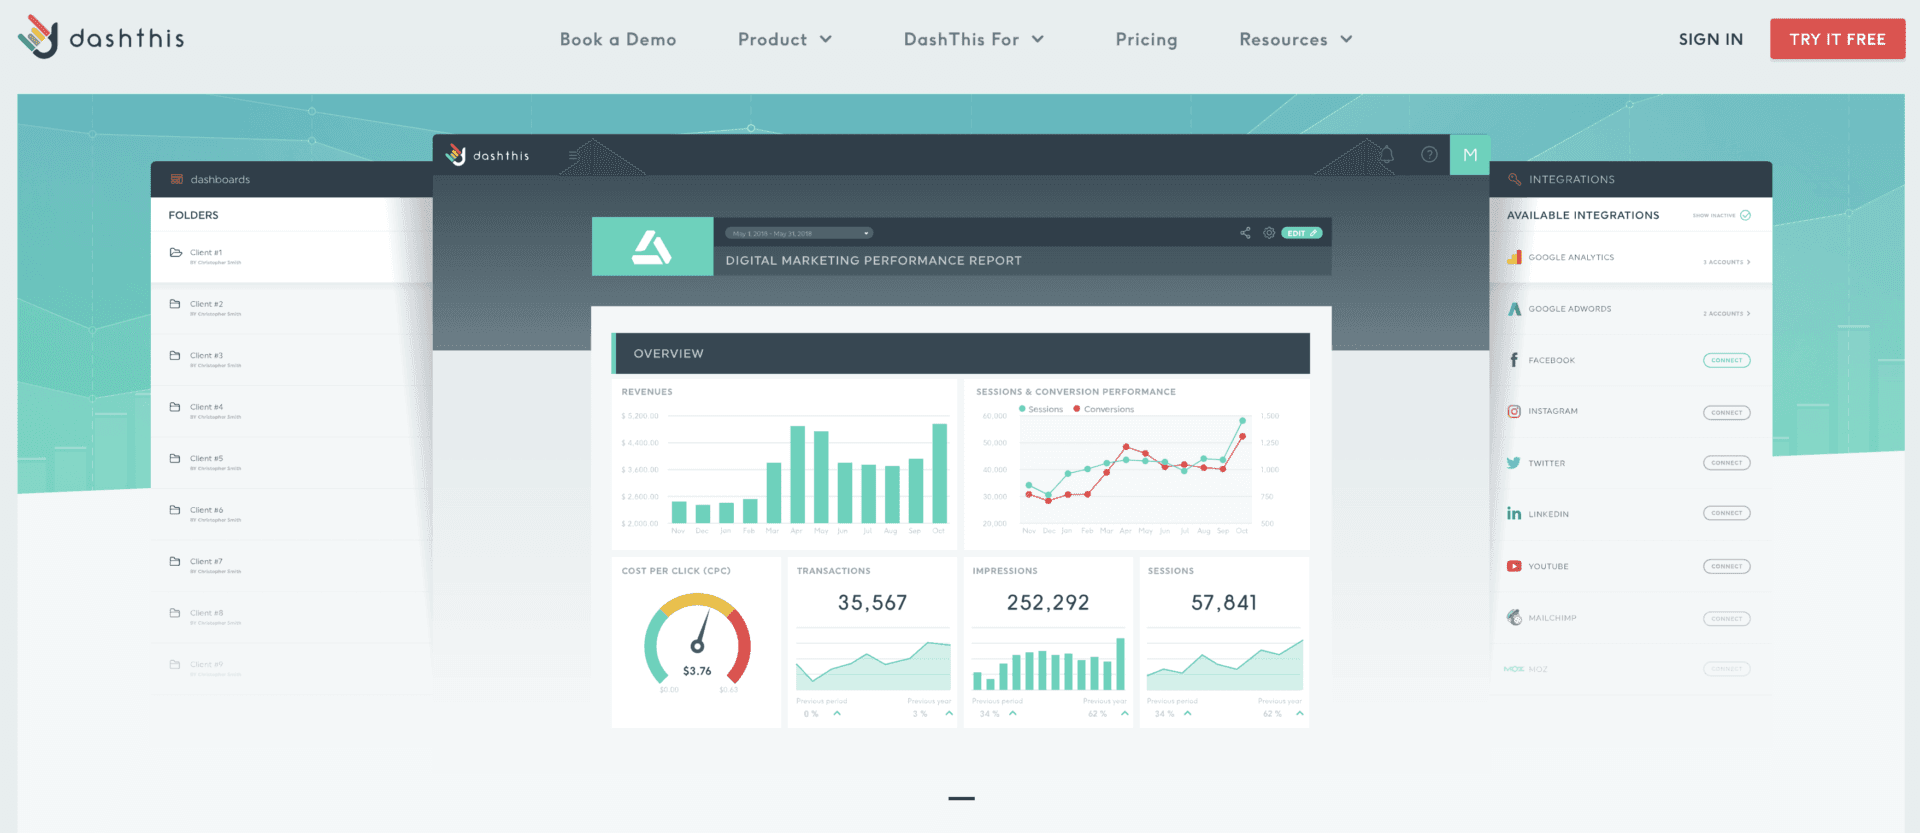 Key Features:
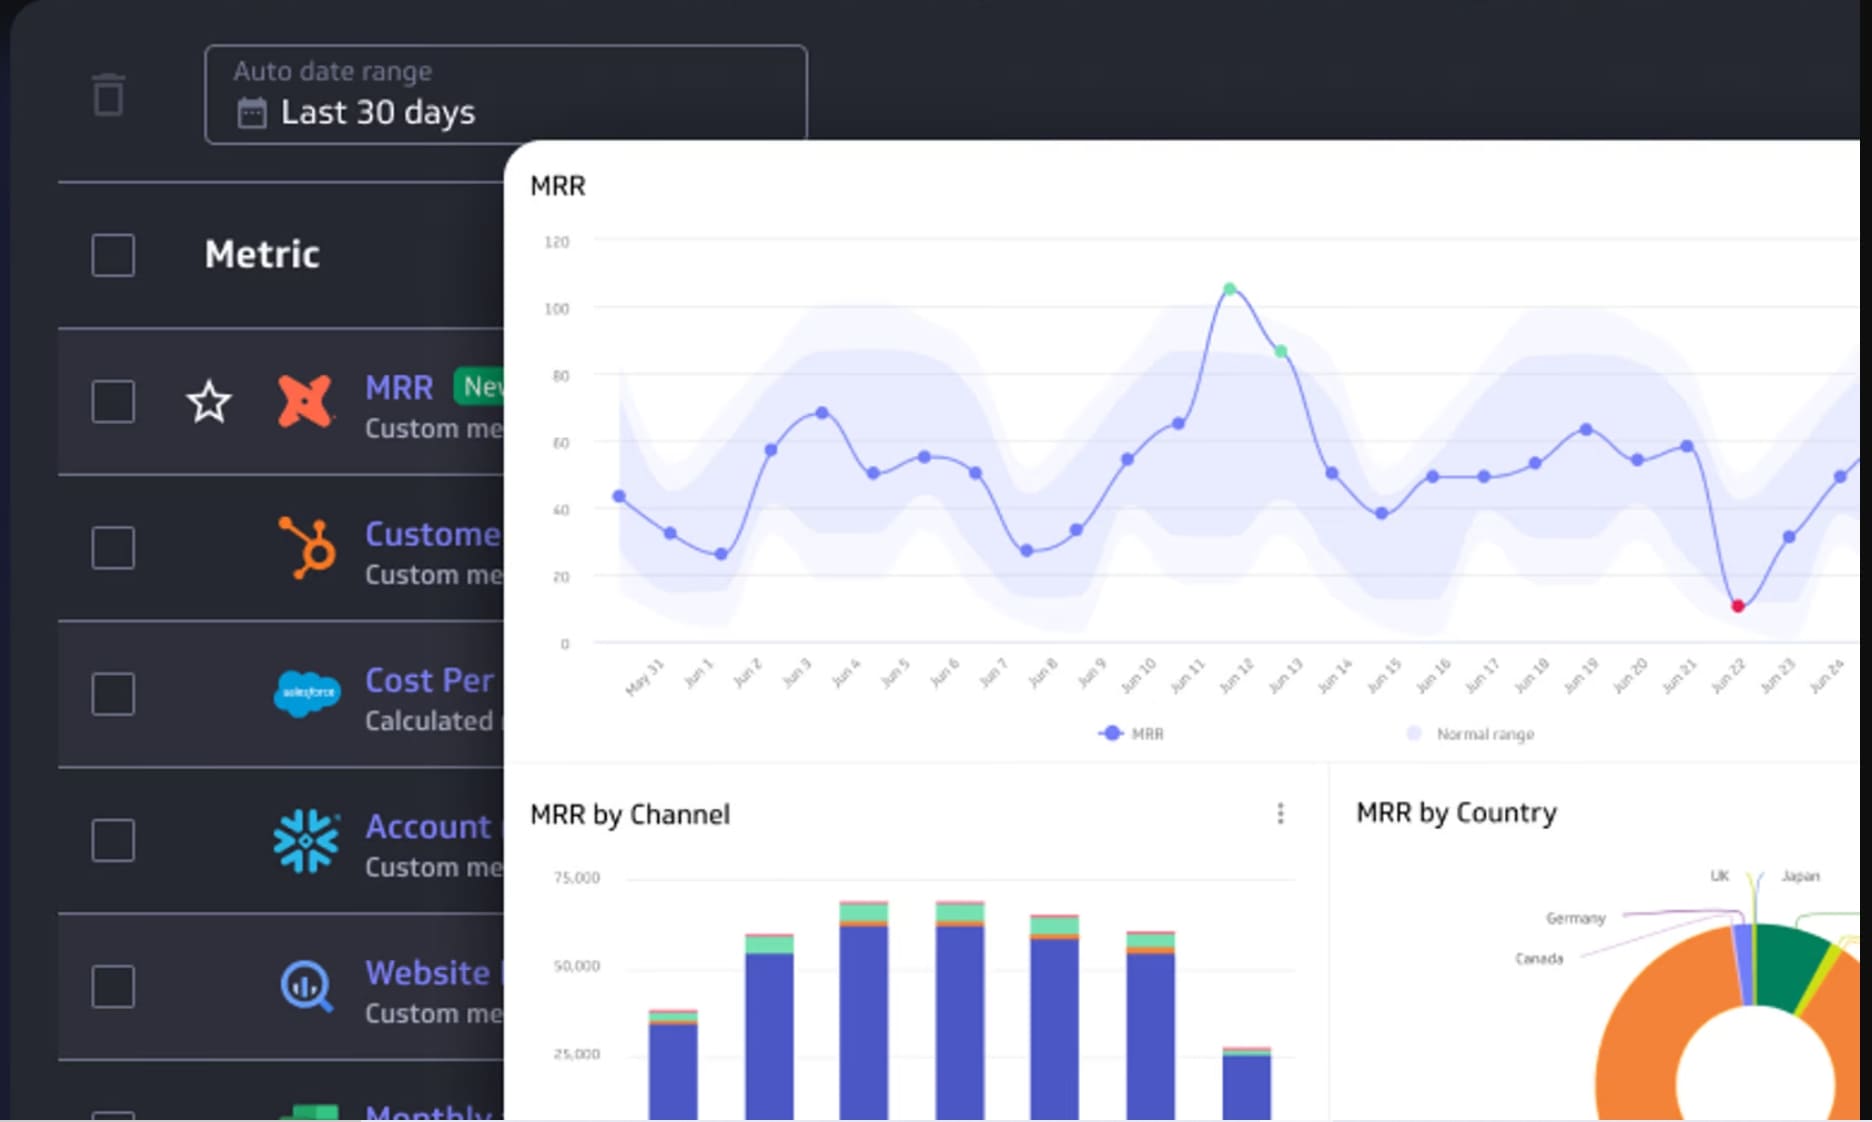 Key Features:
 Key Features:
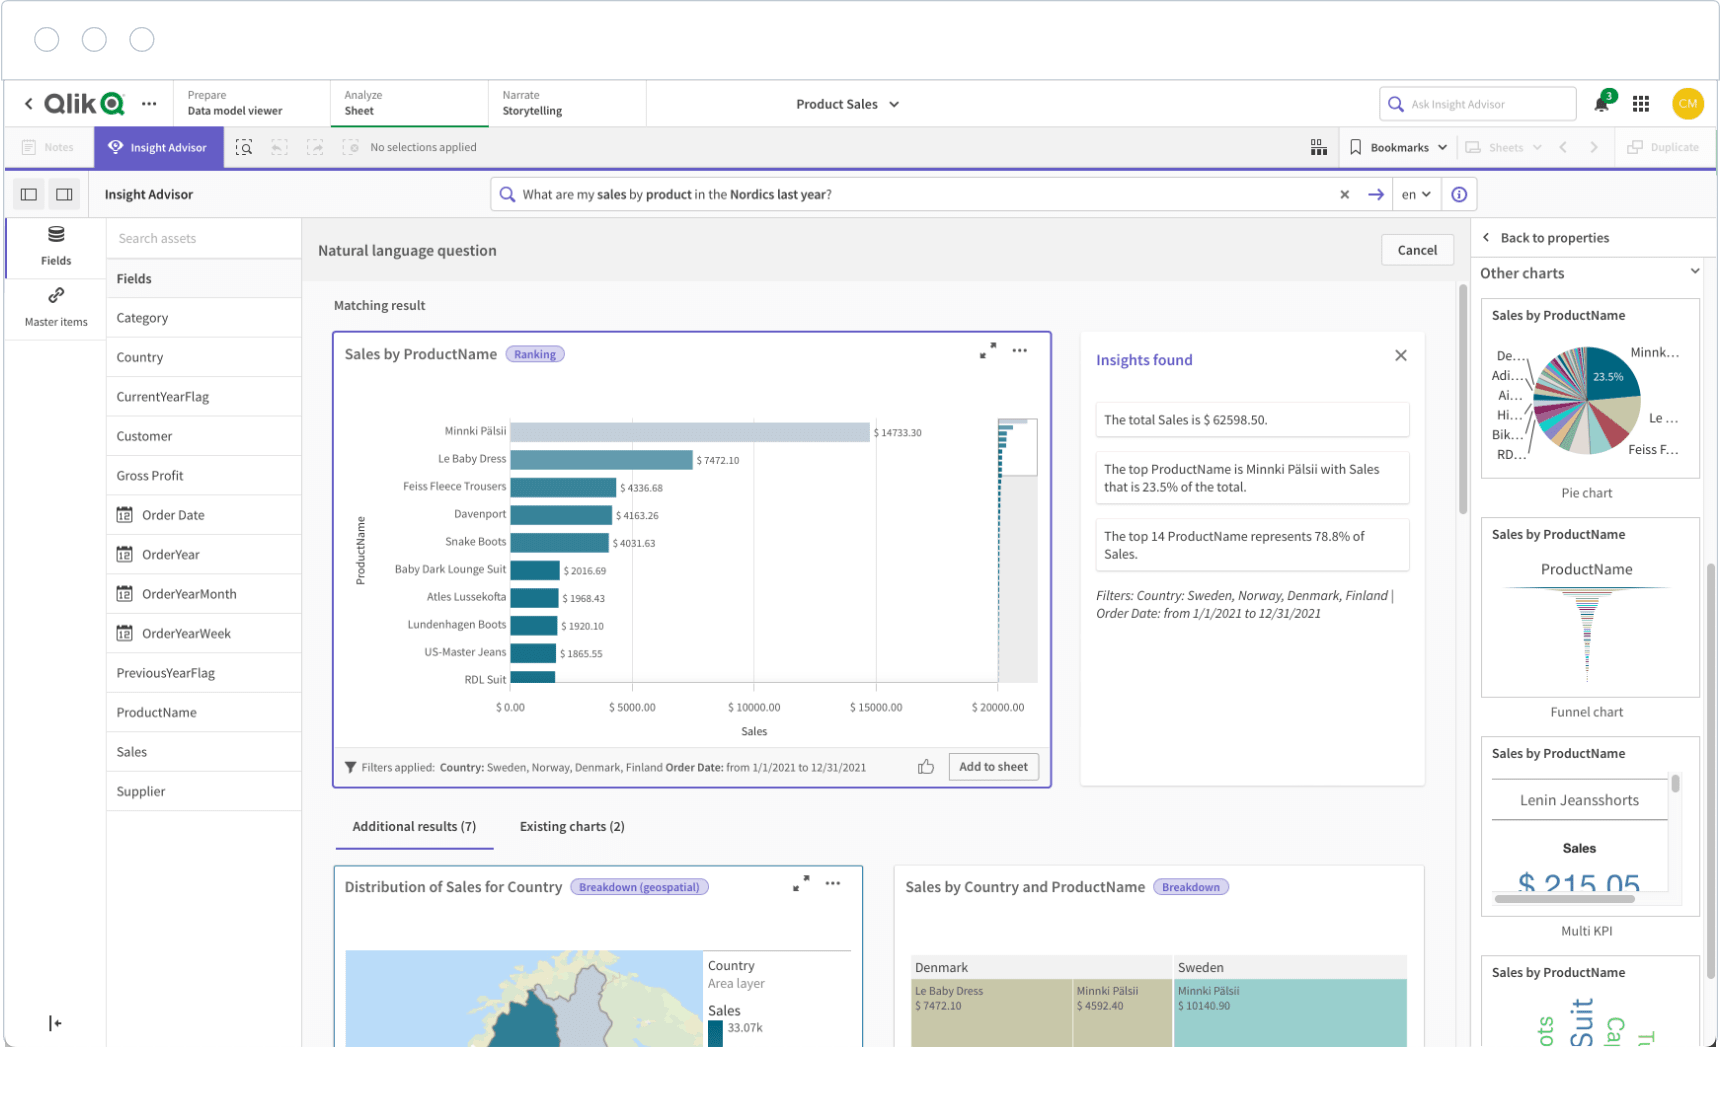 Key Features:


