Database reporting tools turn raw data into clear reports and dashboards, helping businesses make smarter, faster decisions.Looking for the best database reporting tools to power your business? Here are the top data reporting tools making waves this year:
FineReport by FanRuan
Power BI
Tableau
Looker
Qlik Sense
Zoho Analytics
Metabase
JasperReports
Superset
Redash.
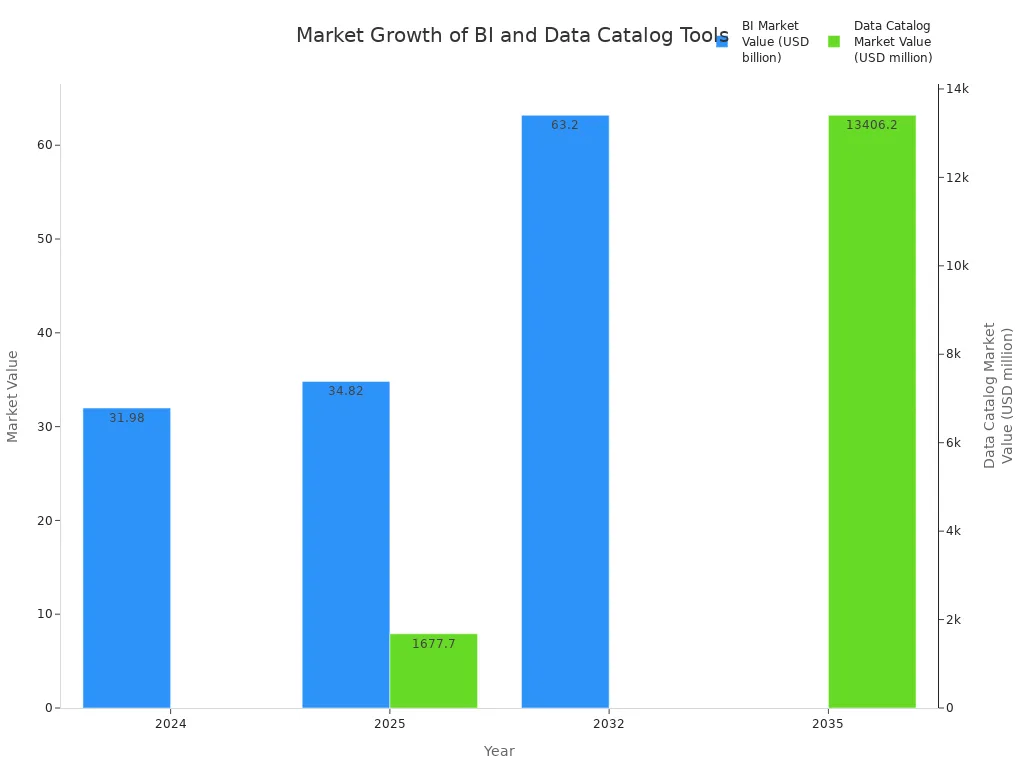
These database reporting tools help companies uncover insights, automate reporting, and enable smarter, faster decisions. Businesses choose reporting software that fits their needs, focusing on integration, scalability, and ease of use. The global business intelligence market keeps growing, reflecting the rising demand for top database reporting tools and advanced reporting solutions.
Metric/Statistic
Value/Insight
Global Business Intelligence Market Value (2024)
USD 31.98 billion
Projected Market Value (2025)
USD 34.82 billion
Projected Market Value (2032)
USD 63.20 billion
Compound Annual Growth Rate (CAGR)
8.9%
Database Reporting Tools Overview
What Are Database Reporting Tools
Database reporting tools help organizations turn raw data into meaningful reports and dashboards. These tools connect to different data sources, including cloud databases, on-premises systems, and SaaS platforms. With reporting software, users can create interactive reports, visualize trends, and share insights across teams. Most modern data reporting tools offer drag-and-drop interfaces, making it easy for anyone to build reports without coding.
A wide range of reporting tools exists today. Some focus on business intelligence, while others specialize in cloud analytics reporting or web-based reporting tools. Many companies now use cloud reporting tools and SaaS reporting tools to access data from anywhere. These cloud-based software solutions support real-time data analysis, mobile access, and seamless integration with other business applications.
Core Functionality
Description
Reporting and Analysis
Create reports and dashboards to extract insights from data.
Use natural language to query data and get insights.
These features make database reporting tools essential for any business that wants to stay competitive in a data-driven world.
Why Businesses Need Data Reporting Tools
Companies rely on data reporting tools to make sense of large amounts of information. Without proper reporting software, businesses face many challenges:
Poor data quality leads to unreliable reports and bad decisions.
Inefficient data management causes errors and prevents a single source of truth.
Manual reporting slows down access to important information.
Internal resistance and lack of training make reporting harder.
Outdated reporting tools limit insights and slow down business growth.
Poor communication of data needs results in confusing or incomplete reports.
Manual report creation wastes time and increases errors.
Lack of integration between reporting and planning systems causes data inaccuracies.
Cloud reporting tools and SaaS reporting tools solve these problems by automating data collection, improving accuracy, and speeding up reporting cycles. With web-based reporting tools, teams can collaborate in real time, share reports instantly, and access data from any device. Cloud analytics reporting also helps companies spot trends and make faster decisions.
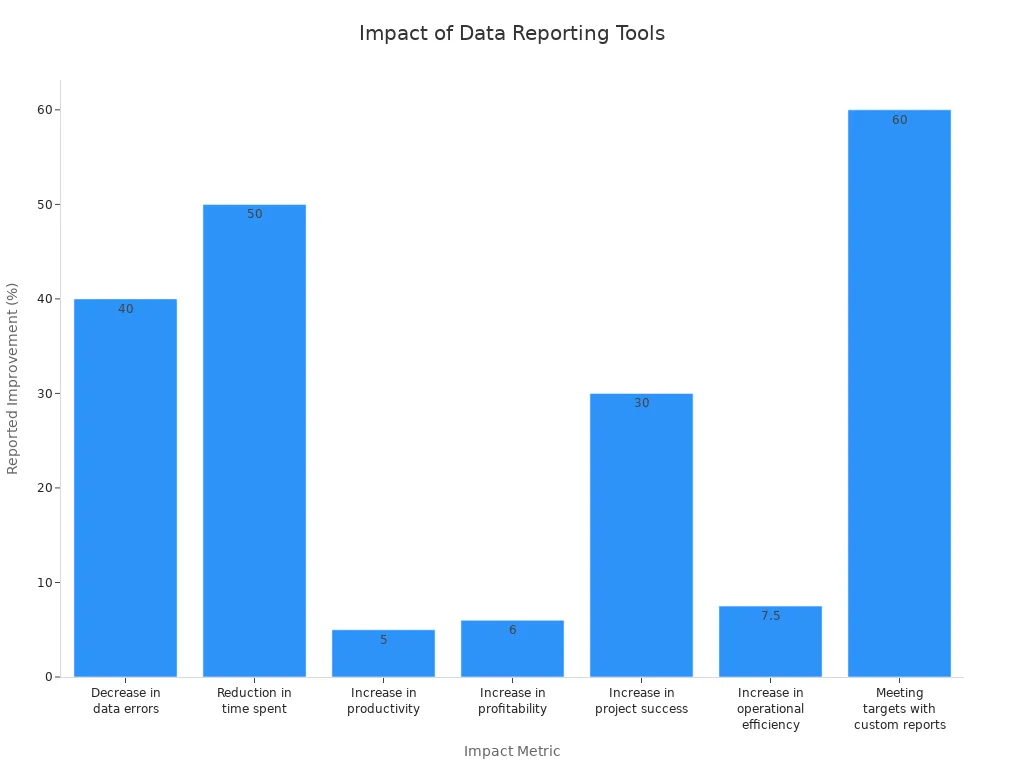
Studies show that automated reporting software reduces data errors by 40% and cuts time spent on data tasks by half. Businesses using cloud-based software and SaaS reporting tools see higher productivity, better collaboration, and improved profitability. Real-time data reporting tools help managers track performance, identify bottlenecks, and support smarter decision-making.
Tip: Companies that use modern cloud reporting tools and SaaS reporting tools are three times more likely to achieve above-average business performance.
Top Database Reporting Tools
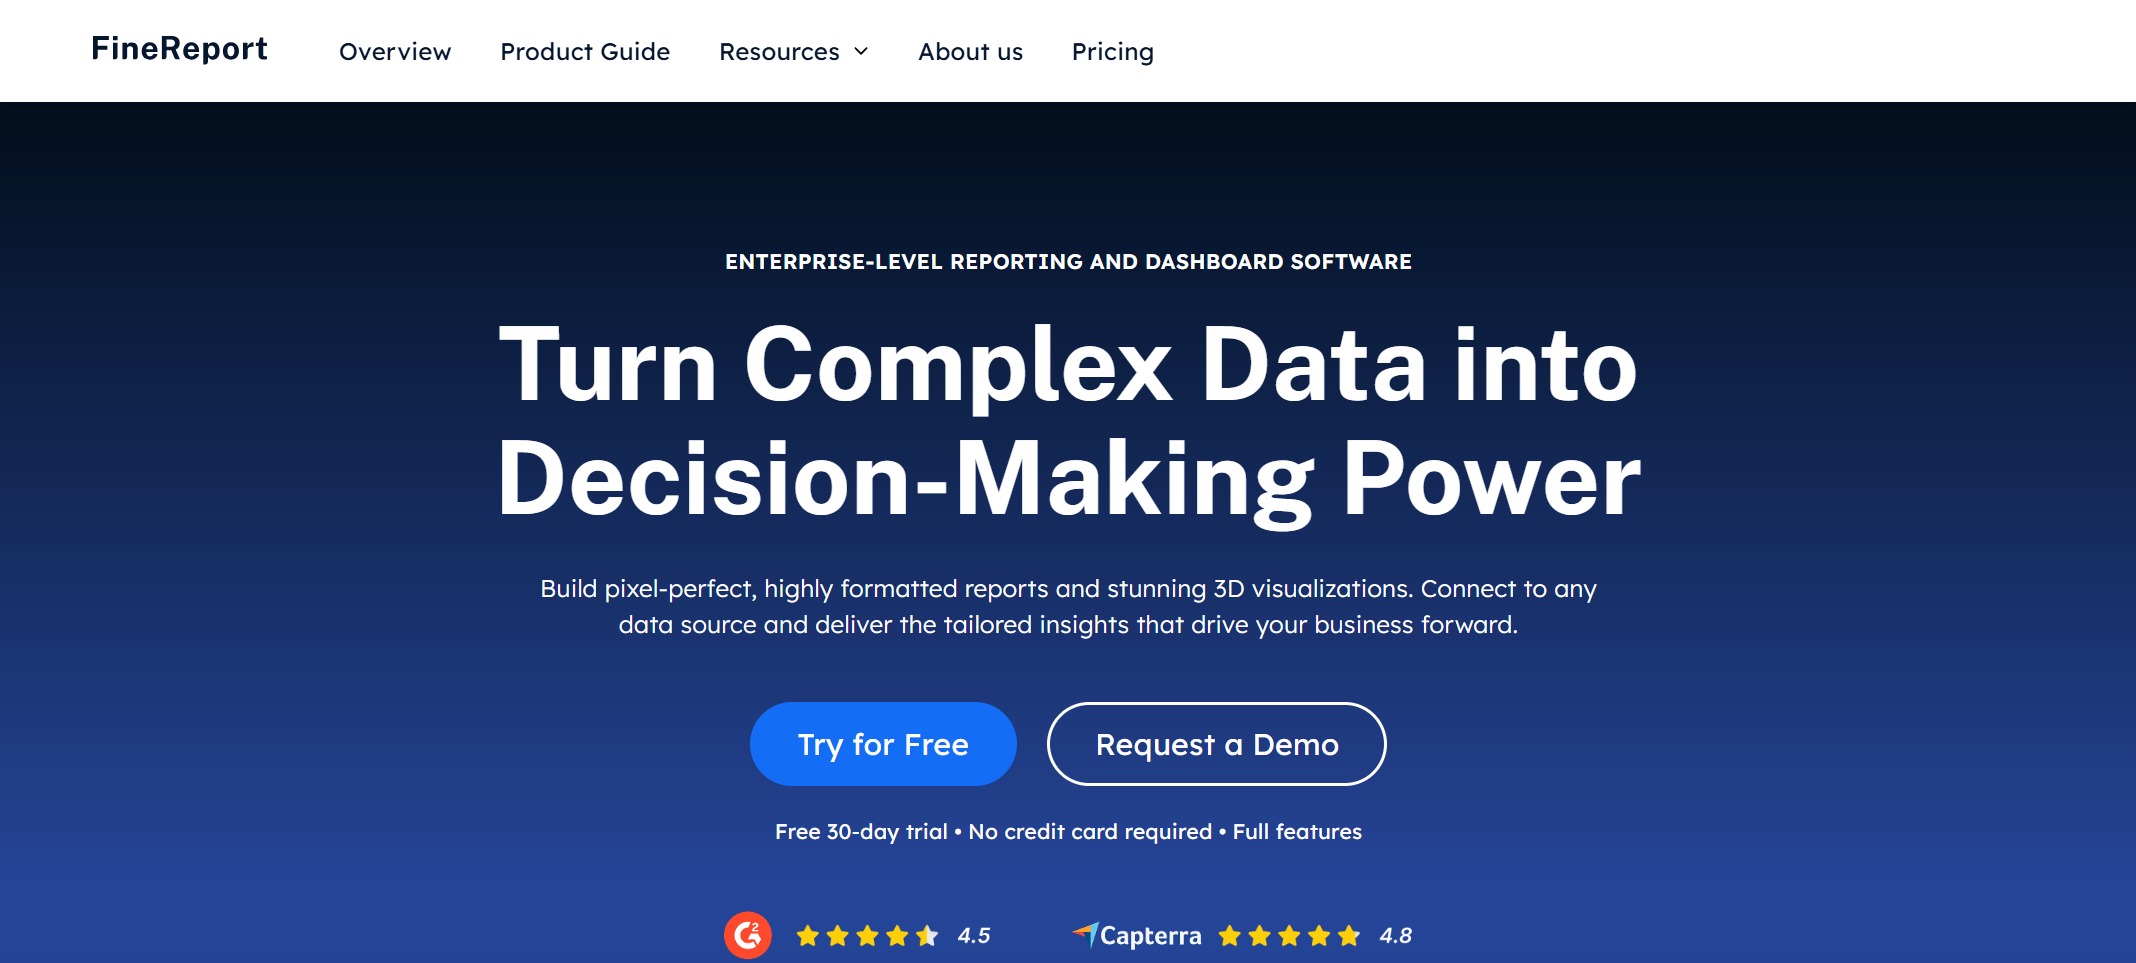
1.FineReport by FanRuan
FineReport by FanRuan stands out as a leading enterprise-level reporting and dashboard solution. Many large organizations and government agencies rely on it for its robust data integration, advanced analytics, and seamless workflow support. FineReport connects to a wide range of cloud and on-premises data sources, making it a top choice for companies with complex reporting needs.
Strong data import, export, and custom report features
Integration & Analytics
Reliable integration, advanced analytics, and real-time business analysis
Support
24/7 support via chat and email
Target Users
Large enterprises, government, and organizations with complex workflows
Workflow Integration
Seamless fit for enterprise and government operations
Operational Efficiency
Focus on improving efficiency, collaboration, and communication
Security
Enterprise-grade security for sensitive data
Mobility
Mobile BI apps for real-time access
FineReport offers a user-friendly drag-and-drop interface, allowing users to create impressive dashboards and reports in minutes. The platform supports all major databases and merges data from multiple sources with a single click. Users can choose from over 50 chart styles, including dynamic 3D effects, to visualize trends and patterns. FineReport also provides rich controls for data entry, validation, and temporary storage, making it ideal for operational reporting.
FineReport’s open APIs let IT teams customize reporting systems quickly. Streamlined deployment and integration help reduce operational costs, while multi-node clusters and real-time synchronization support enterprise scalability.
Pros:
Fast report creation with drag-and-drop tools
Advanced data visualization and analytics
Seamless integration with cloud and on-premises sources
Real-time dashboards and mobile access
Strong security and permission controls
24/7 support
Cons:
Requires higher server investment for independent deployment
Separate environments for data processing and visualization in some setups
Best Use Cases:
Many industries trust FineReport for their reporting needs. Manufacturing companies use it to monitor production lines with live cloud dashboards. Retailers rely on saas reporting tools to track sales and inventory in real time. Financial services firms use interactive dashboard features to watch key performance indicators and spot risks early.
A global electronics company improved its supply chain by using FineReport’s cloud reporting tools. Managers now get instant updates on shipments and inventory. In the public sector, government agencies use FineReport to create saas dashboards for budget tracking and resource planning. These organizations value the platform’s ability to scale as their data grows.
FineReport helps teams move faster. With cloud and saas reporting tools, users can share insights, automate reporting, and make better choices every day. The platform’s flexibility and strong cloud integration make it a top pick for modern businesses.
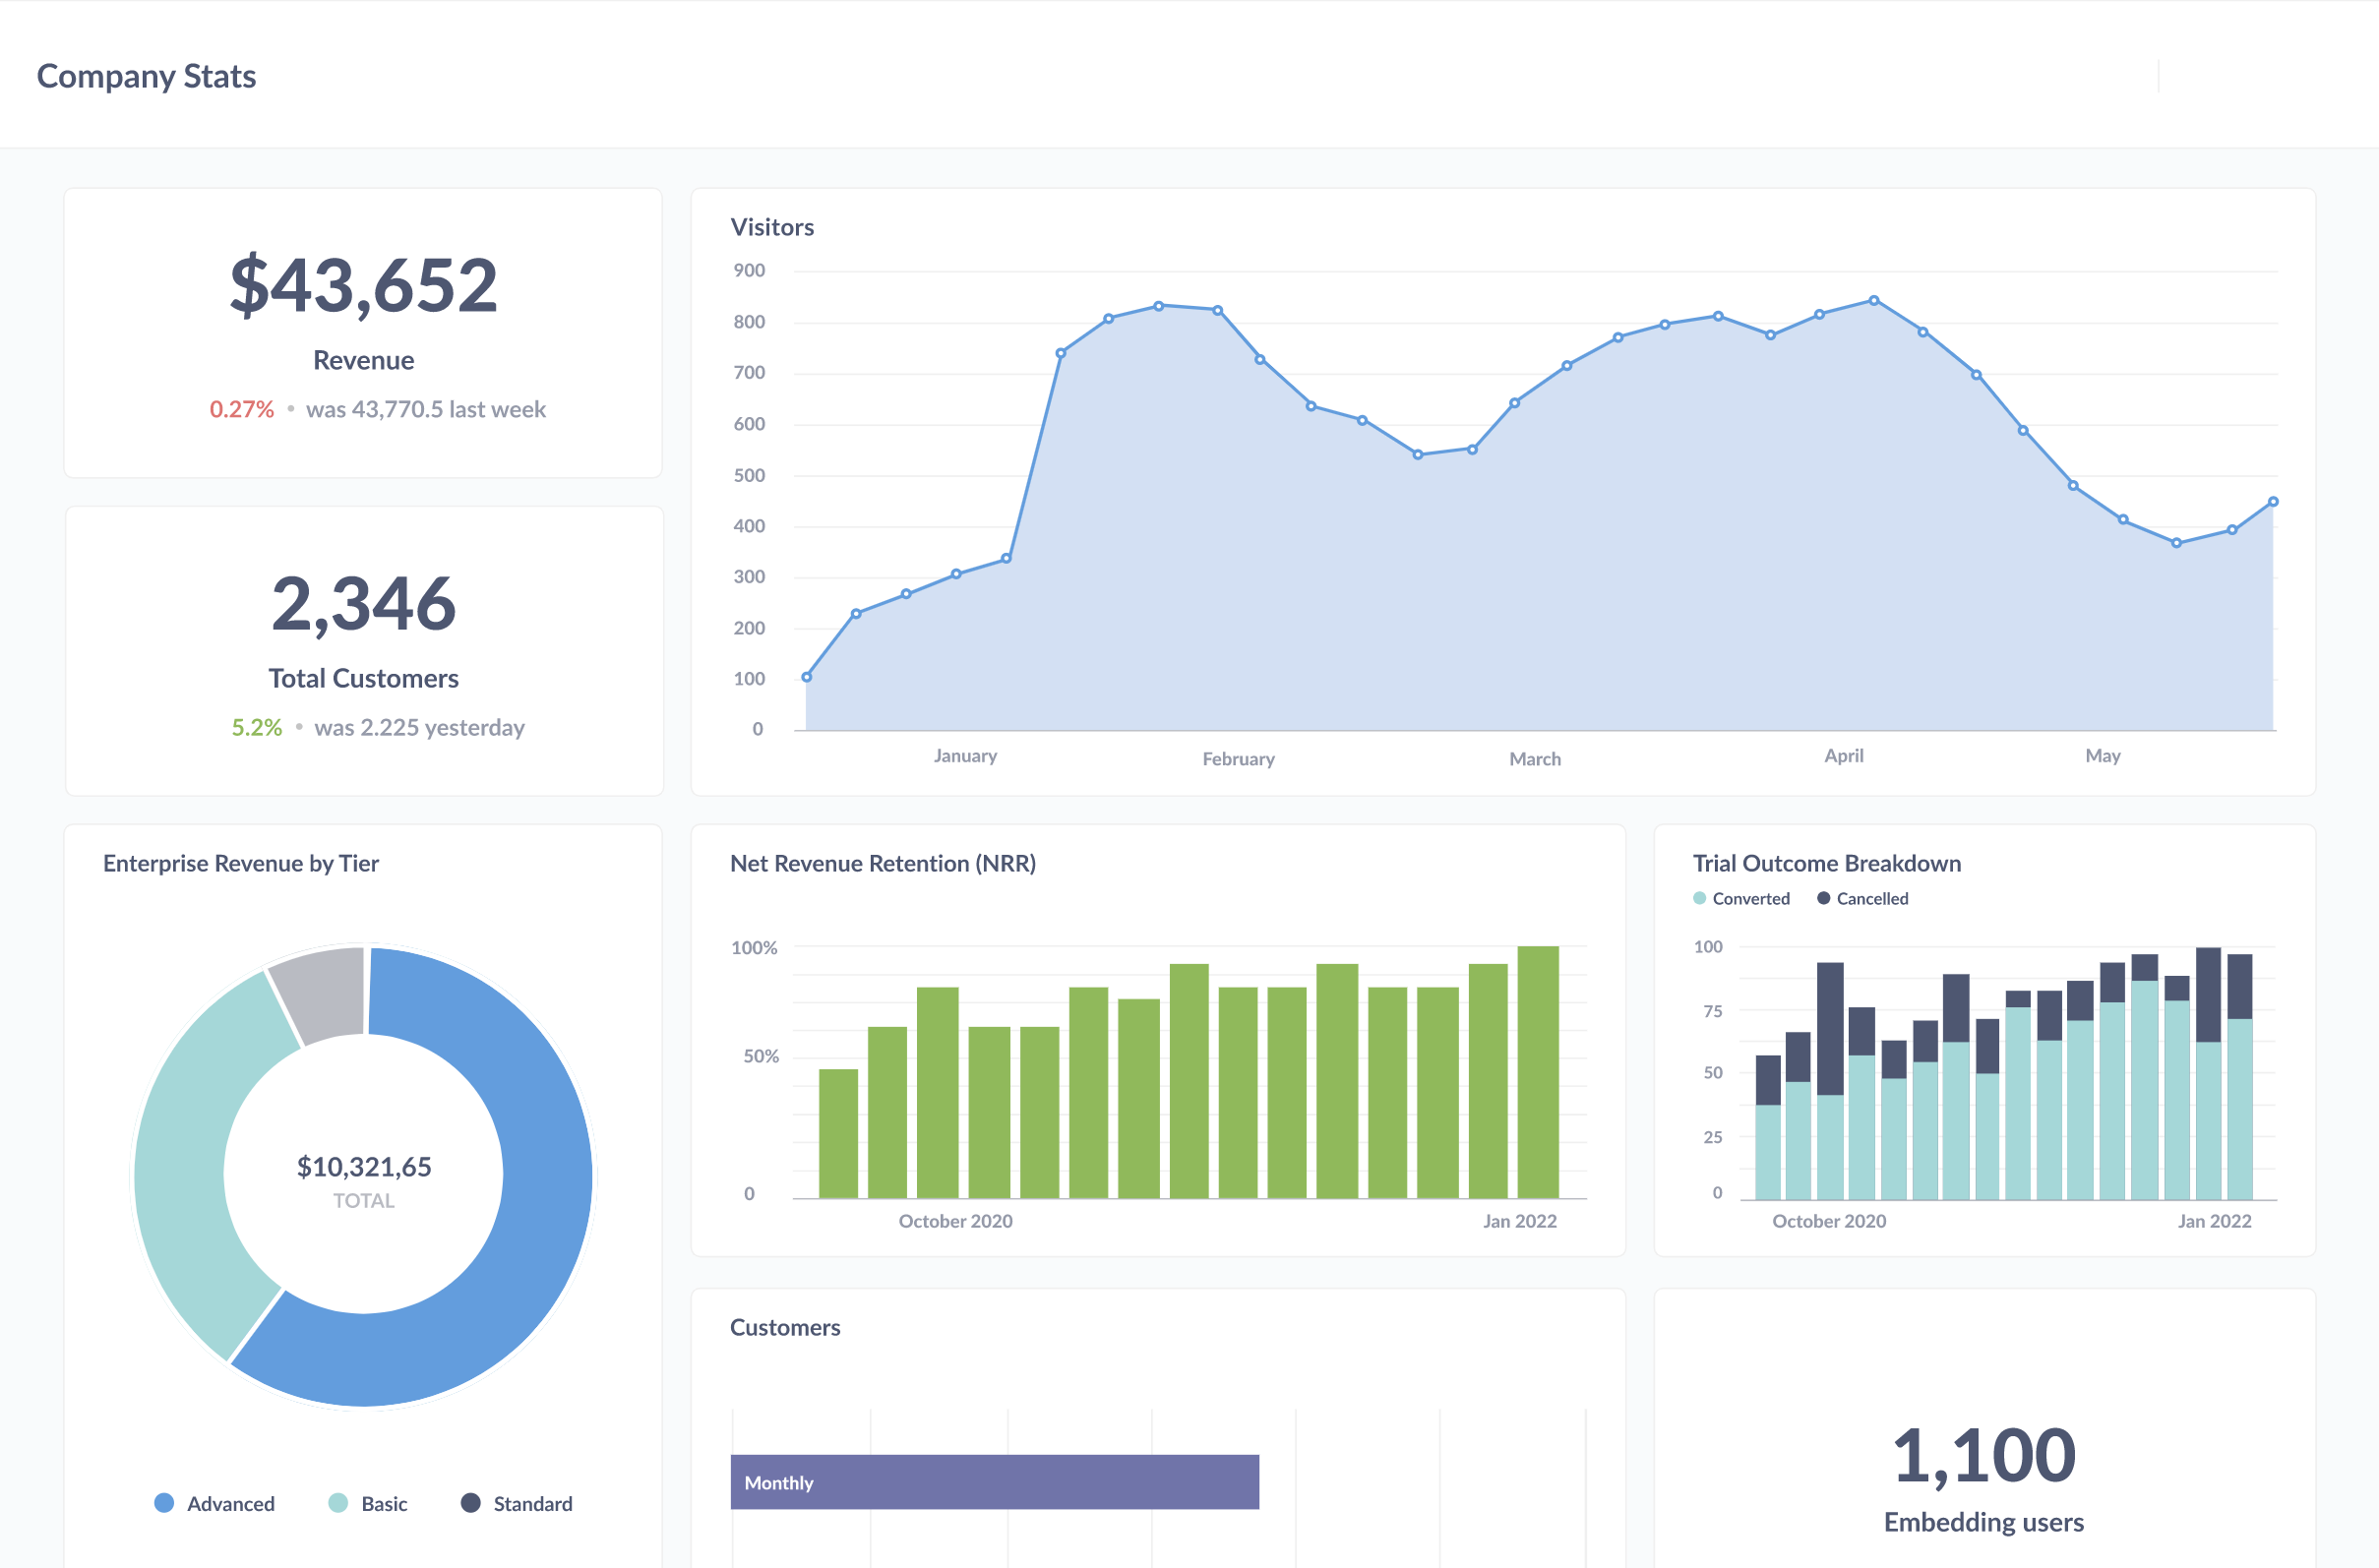
Below is a Production Management Dashboard created by FineReport.
Power BI, developed by Microsoft, is a popular choice for businesses seeking cloud reporting tools and saas reporting tools. It offers a suite of products, including Desktop, Service, and Mobile App, to cover all reporting needs. Power BI integrates with Microsoft 365, Teams, and SharePoint, making it easy for users to collaborate and share dashboards.
Power BI’s drag-and-drop interface makes it easy to build dashboards and reports. Users can customize visuals, use AI-powered analytics, and access data from anywhere with the mobile app. Monthly updates keep the platform current and secure.
Pros:
Affordable for small and medium businesses
Deep integration with Microsoft cloud services
AI-powered analytics and real-time alerts
Mobile access and responsive design
Frequent updates and strong community support
Cons:
Sharing outside the organization requires Premium
Dataset size and refresh limits on lower tiers
Best Use Cases: Finance, healthcare, retail, logistics, and real estate. Power BI excels in financial planning, sales trend analysis, shipment tracking, and market predictions.
3.Tableau
Tableau is known for its powerful data visualization and integration capabilities. It supports a wide range of cloud and on-premises data sources, including Salesforce, Google BigQuery, Hadoop, and AWS. Tableau’s drag-and-drop interface allows users to create interactive dashboards and complex visualizations without coding.
Handles large datasets, flexible blending, multi-source integration
Integration Features
Real-time connections, automated refresh, Salesforce Data Cloud integration
Innovation Focus
AI-driven tools, semantic layer, agentic AI
Collaboration & Sharing
Enterprise-grade sharing, embedded analytics, mobile optimization
Tableau’s suite includes Desktop, Server, Online, Public, and Prep for data cleaning. The platform’s AI-driven features, like Data Pro and Concierge, help users prepare and analyze data faster.
Pros:
Superior data visualization and dashboarding
Connects to diverse cloud and on-premises sources
AI-driven analytics and proactive monitoring
Strong collaboration and sharing features
Cons:
High and inflexible pricing, especially for large deployments
Performance issues with large dashboards
Limited scheduling and notification features
Requires IT support for setup and management
Best Use Cases: Businesses focused on advanced data visualization, geospatial analytics, and integration with Salesforce or other cloud platforms.
4.Looker
Looker, now part of Google Cloud, delivers modern saas reporting tools with a focus on real-time analytics and scalable data modeling. The platform uses a semantic layer to standardize business logic and supports direct connections to raw data sources, eliminating the need for ETL.
Extensive data connectors for cloud and SQL sources
Custom metrics and calculated fields
Machine learning integration for predictive analytics
Strong security and compliance (GDPR, HIPAA)
Mobile-friendly dashboards
Version history and audit trails
Looker’s cloud-based architecture supports easy deployment and enhanced security. Developers can build custom data experiences using the Extension Framework and LookML modeling language.
Seamless integration with Google Cloud and other data sources
Collaboration and version control
Cons:
High starting price and complex pricing model
Hidden costs for data queries and APIs
Less suitable for small teams
Best Use Cases: Enterprises needing scalable, secure, and customizable saas reporting tools for real-time analytics and advanced data modeling.
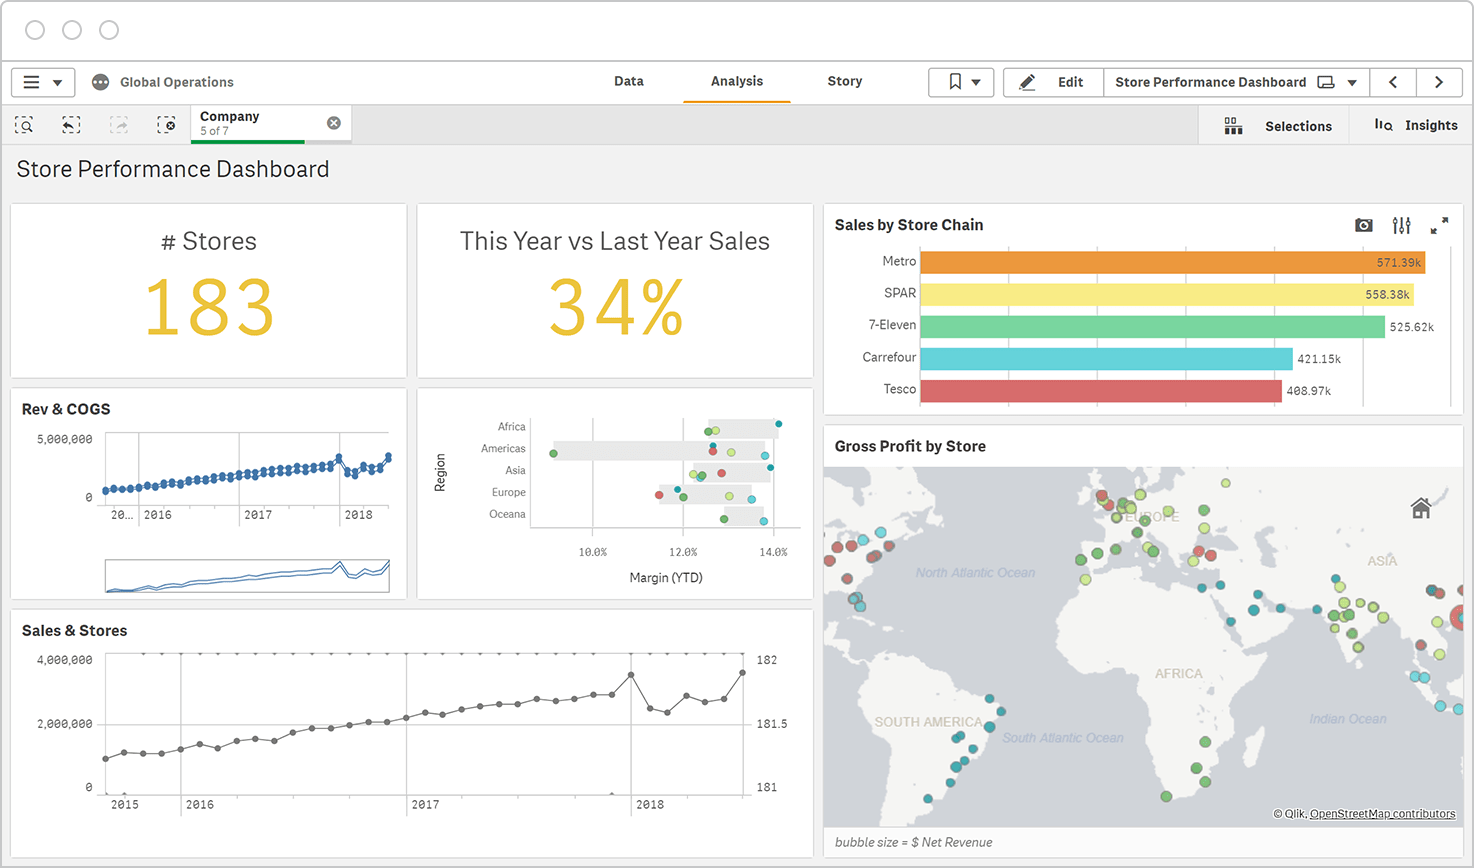
5.Qlik Sense
Qlik Sense is a flexible cloud reporting tool designed for enterprise scalability and integration. It features an associative engine for data discovery and supports a wide range of cloud and on-premises data sources. Qlik Sense offers real-time data replication, transformation, and blending through tools like Qlik Replicate and Qlik Compose.
Load balancing and containerization for performance
High availability and flexible licensing
Integration with Talend Data Fabric and other management tools
Advanced governance and security
Qlik Sense supports cloud-based workflows and can scale horizontally to meet the needs of global organizations. Its strong governance features make it a favorite for regulated industries.
Pros:
Enterprise-grade scalability and integration
Real-time data workflows and replication
Flexible deployment and licensing options
Strong security and governance
Cons:
Complex setup for small teams
Requires technical expertise for advanced features
Best Use Cases: Large enterprises needing scalable cloud reporting tools, real-time data integration, and strong governance.
6.Zoho Analytics
Zoho Analytics is a cloud-based saas reporting tool that offers robust data visualization and AI-powered insights. The platform integrates with over 500 data sources, including CRM and ERP systems, and provides customizable dashboards for trend analysis.
AI assistant Zia for natural language queries and predictive analytics
Collaboration tools with fine-grained access control
Geo-visualizations and advanced analytics
Scalable architecture for large data volumes
Cost-effective pricing with free and tiered plans
Cons:
Steep learning curve for new users
User interface complexity
Performance issues with large datasets
Customer support and documentation can be lacking
Subscription pricing may be costly for large teams
Mobile app experience is inadequate
Best Use Cases: Businesses seeking affordable saas reporting tools with strong data visualization, AI insights, and integration with cloud platforms.
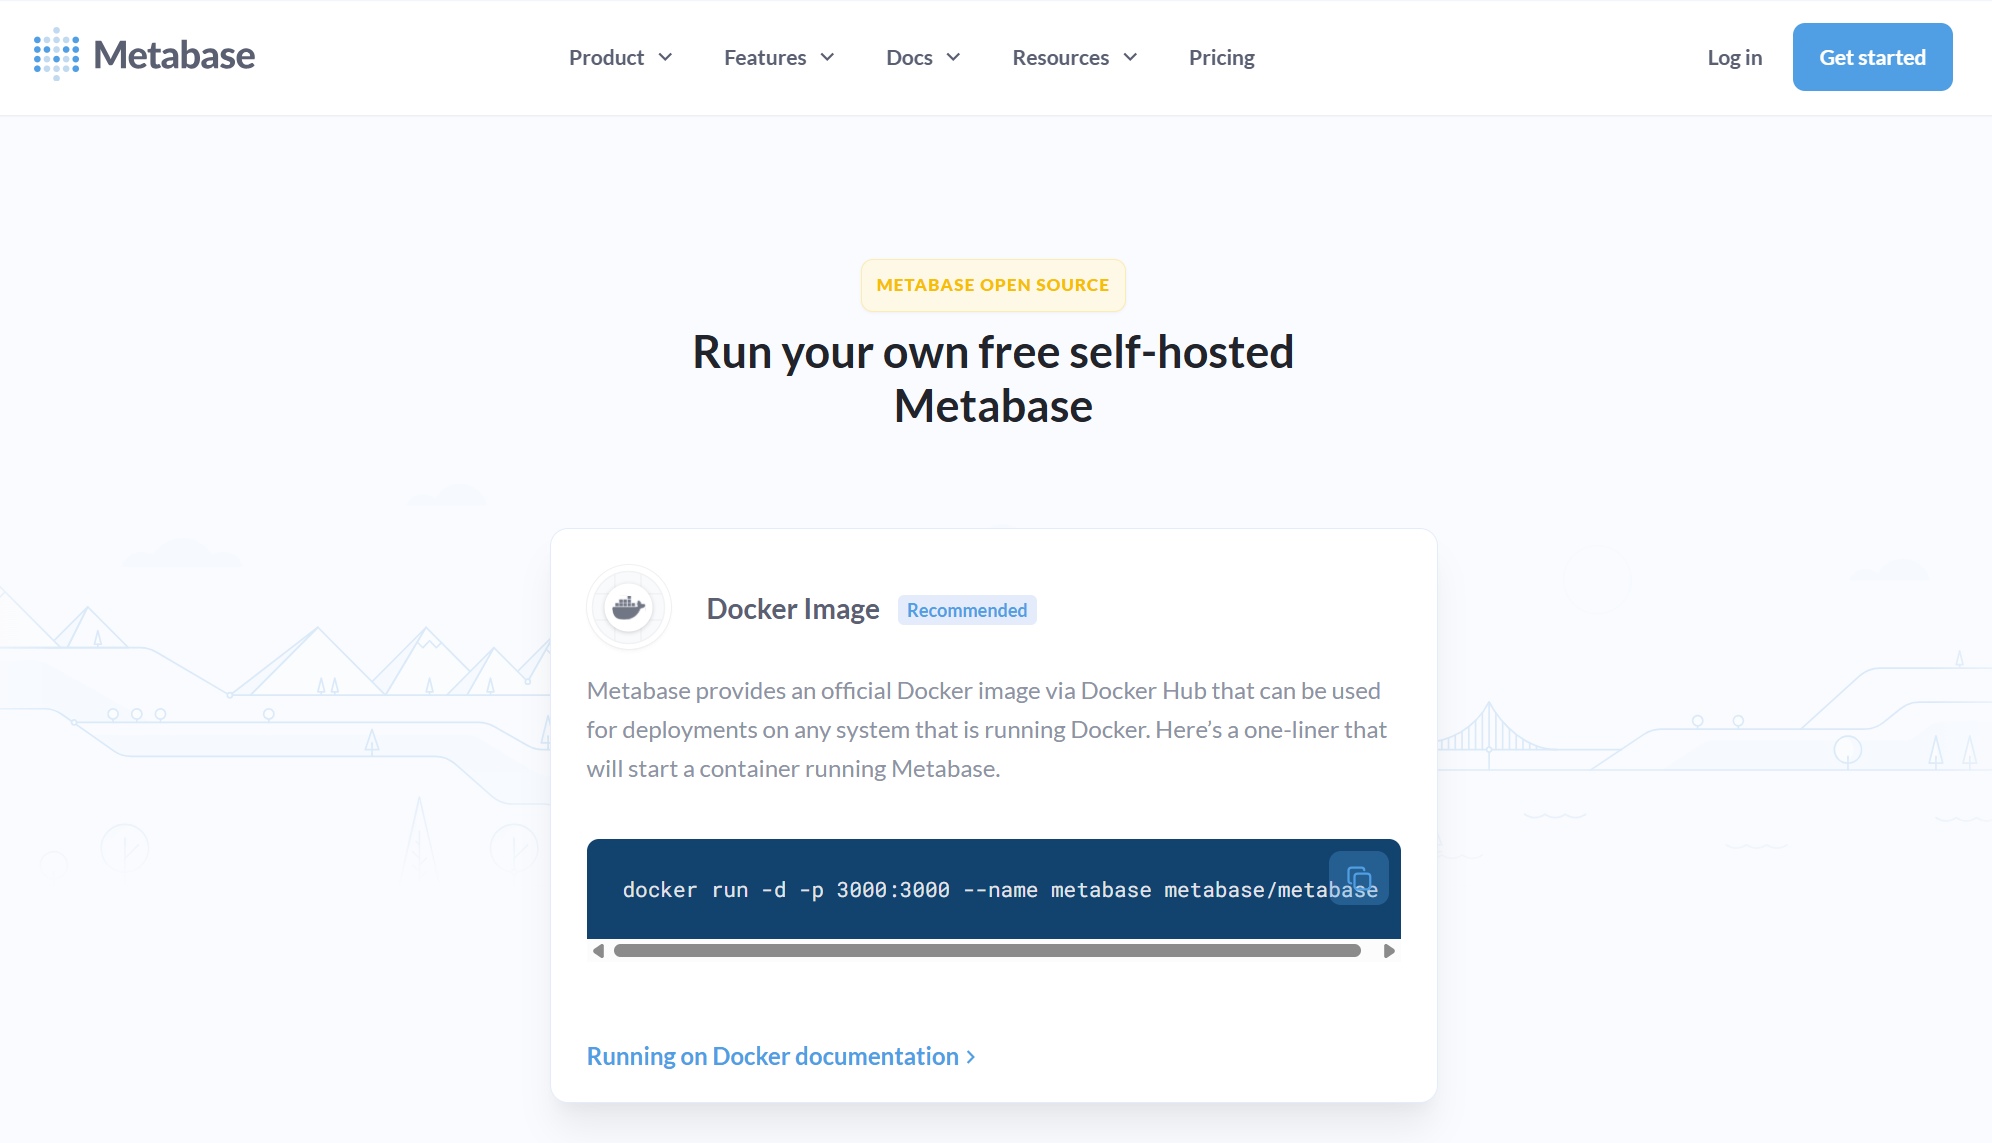
7.Metabase
Metabase is an open-source analytics platform that empowers users to create interactive dashboards and reusable data models without coding. It supports self-service business intelligence, allowing anyone to explore data, visualize results, and build reports using a visual query builder or SQL editor.
Metabase is ideal for organizations looking for open-source cloud reporting tools and saas reporting tools. It enables fast setup, easy dashboard creation, and empowers non-technical users to generate insights independently. Features like granular permissions, multi-tenant data segregation, and usage analytics support production-grade analytics.
Pros:
Open-source and free to use
Easy setup and user-friendly interface
Supports self-service BI and embedded analytics
Scales from startups to large enterprises
Cons:
Limited advanced features compared to enterprise tools
Performance may degrade with very large datasets
Best Use Cases: Startups, SaaS companies, and organizations needing open-source, self-service cloud reporting tools.
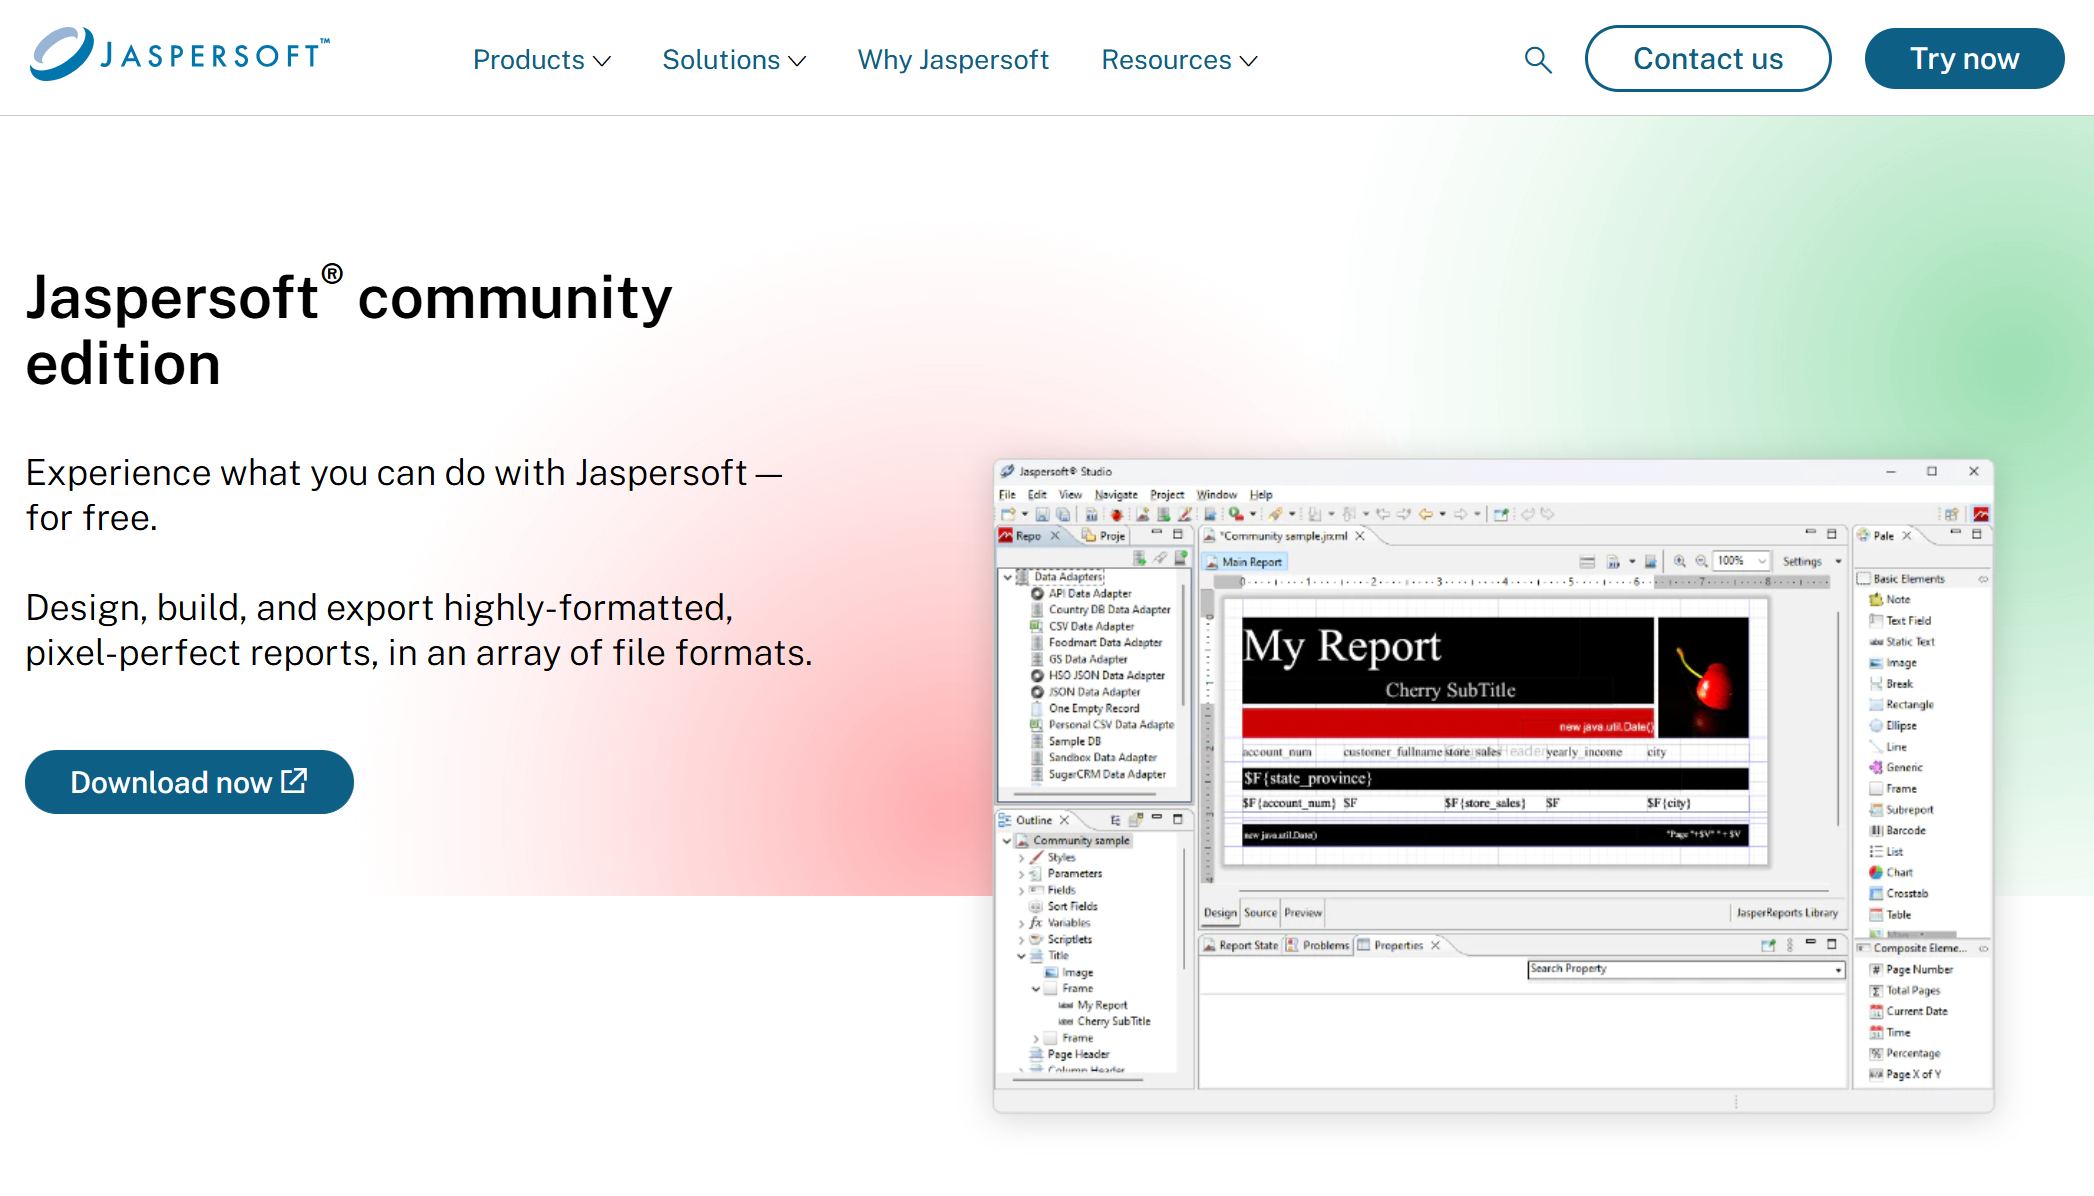
8.JasperReports
JasperReports is a cost-effective, open-source reporting platform with strong data integration and versatile functionality. It offers both a server and a library for embedding reporting into applications.
JasperReports supports cloud and on-premises deployments, making it suitable for a variety of reporting needs.
Pros:
Affordable and open-source
Strong data integration and export options
Flexible deployment and scheduling
Responsive support
Cons:
Steep learning curve for new users
Debugging and performance issues with complex reports
Best Use Cases: Organizations seeking a low-cost, open-source reporting solution with strong data integration and cloud deployment options.
9.Superset
Apache Superset is an open-source platform known for deep customization and enterprise-grade scalability. It supports large numbers of users and dashboards, with advanced security models for regulated industries. Superset’s plugin architecture allows custom visualizations and data transformations.
Requires technical expertise for setup and maintenance
Steep learning curve for non-technical users
Best Use Cases: Enterprises and SaaS providers needing customizable, scalable, and secure cloud reporting tools.
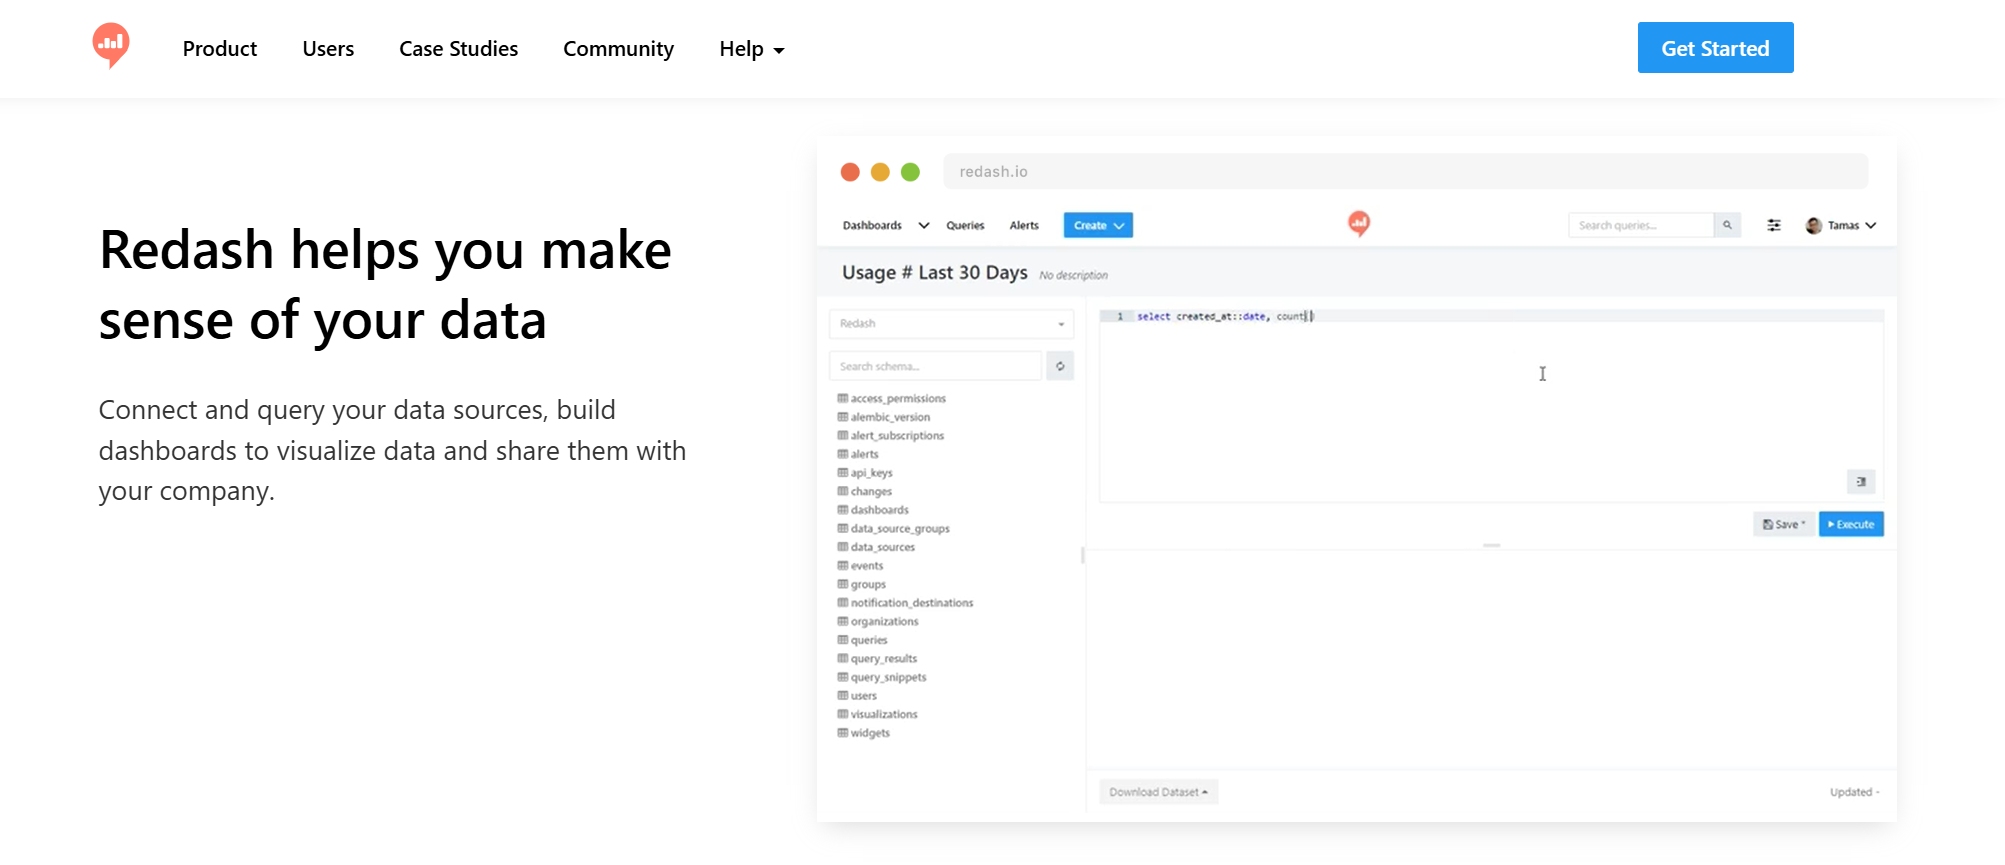
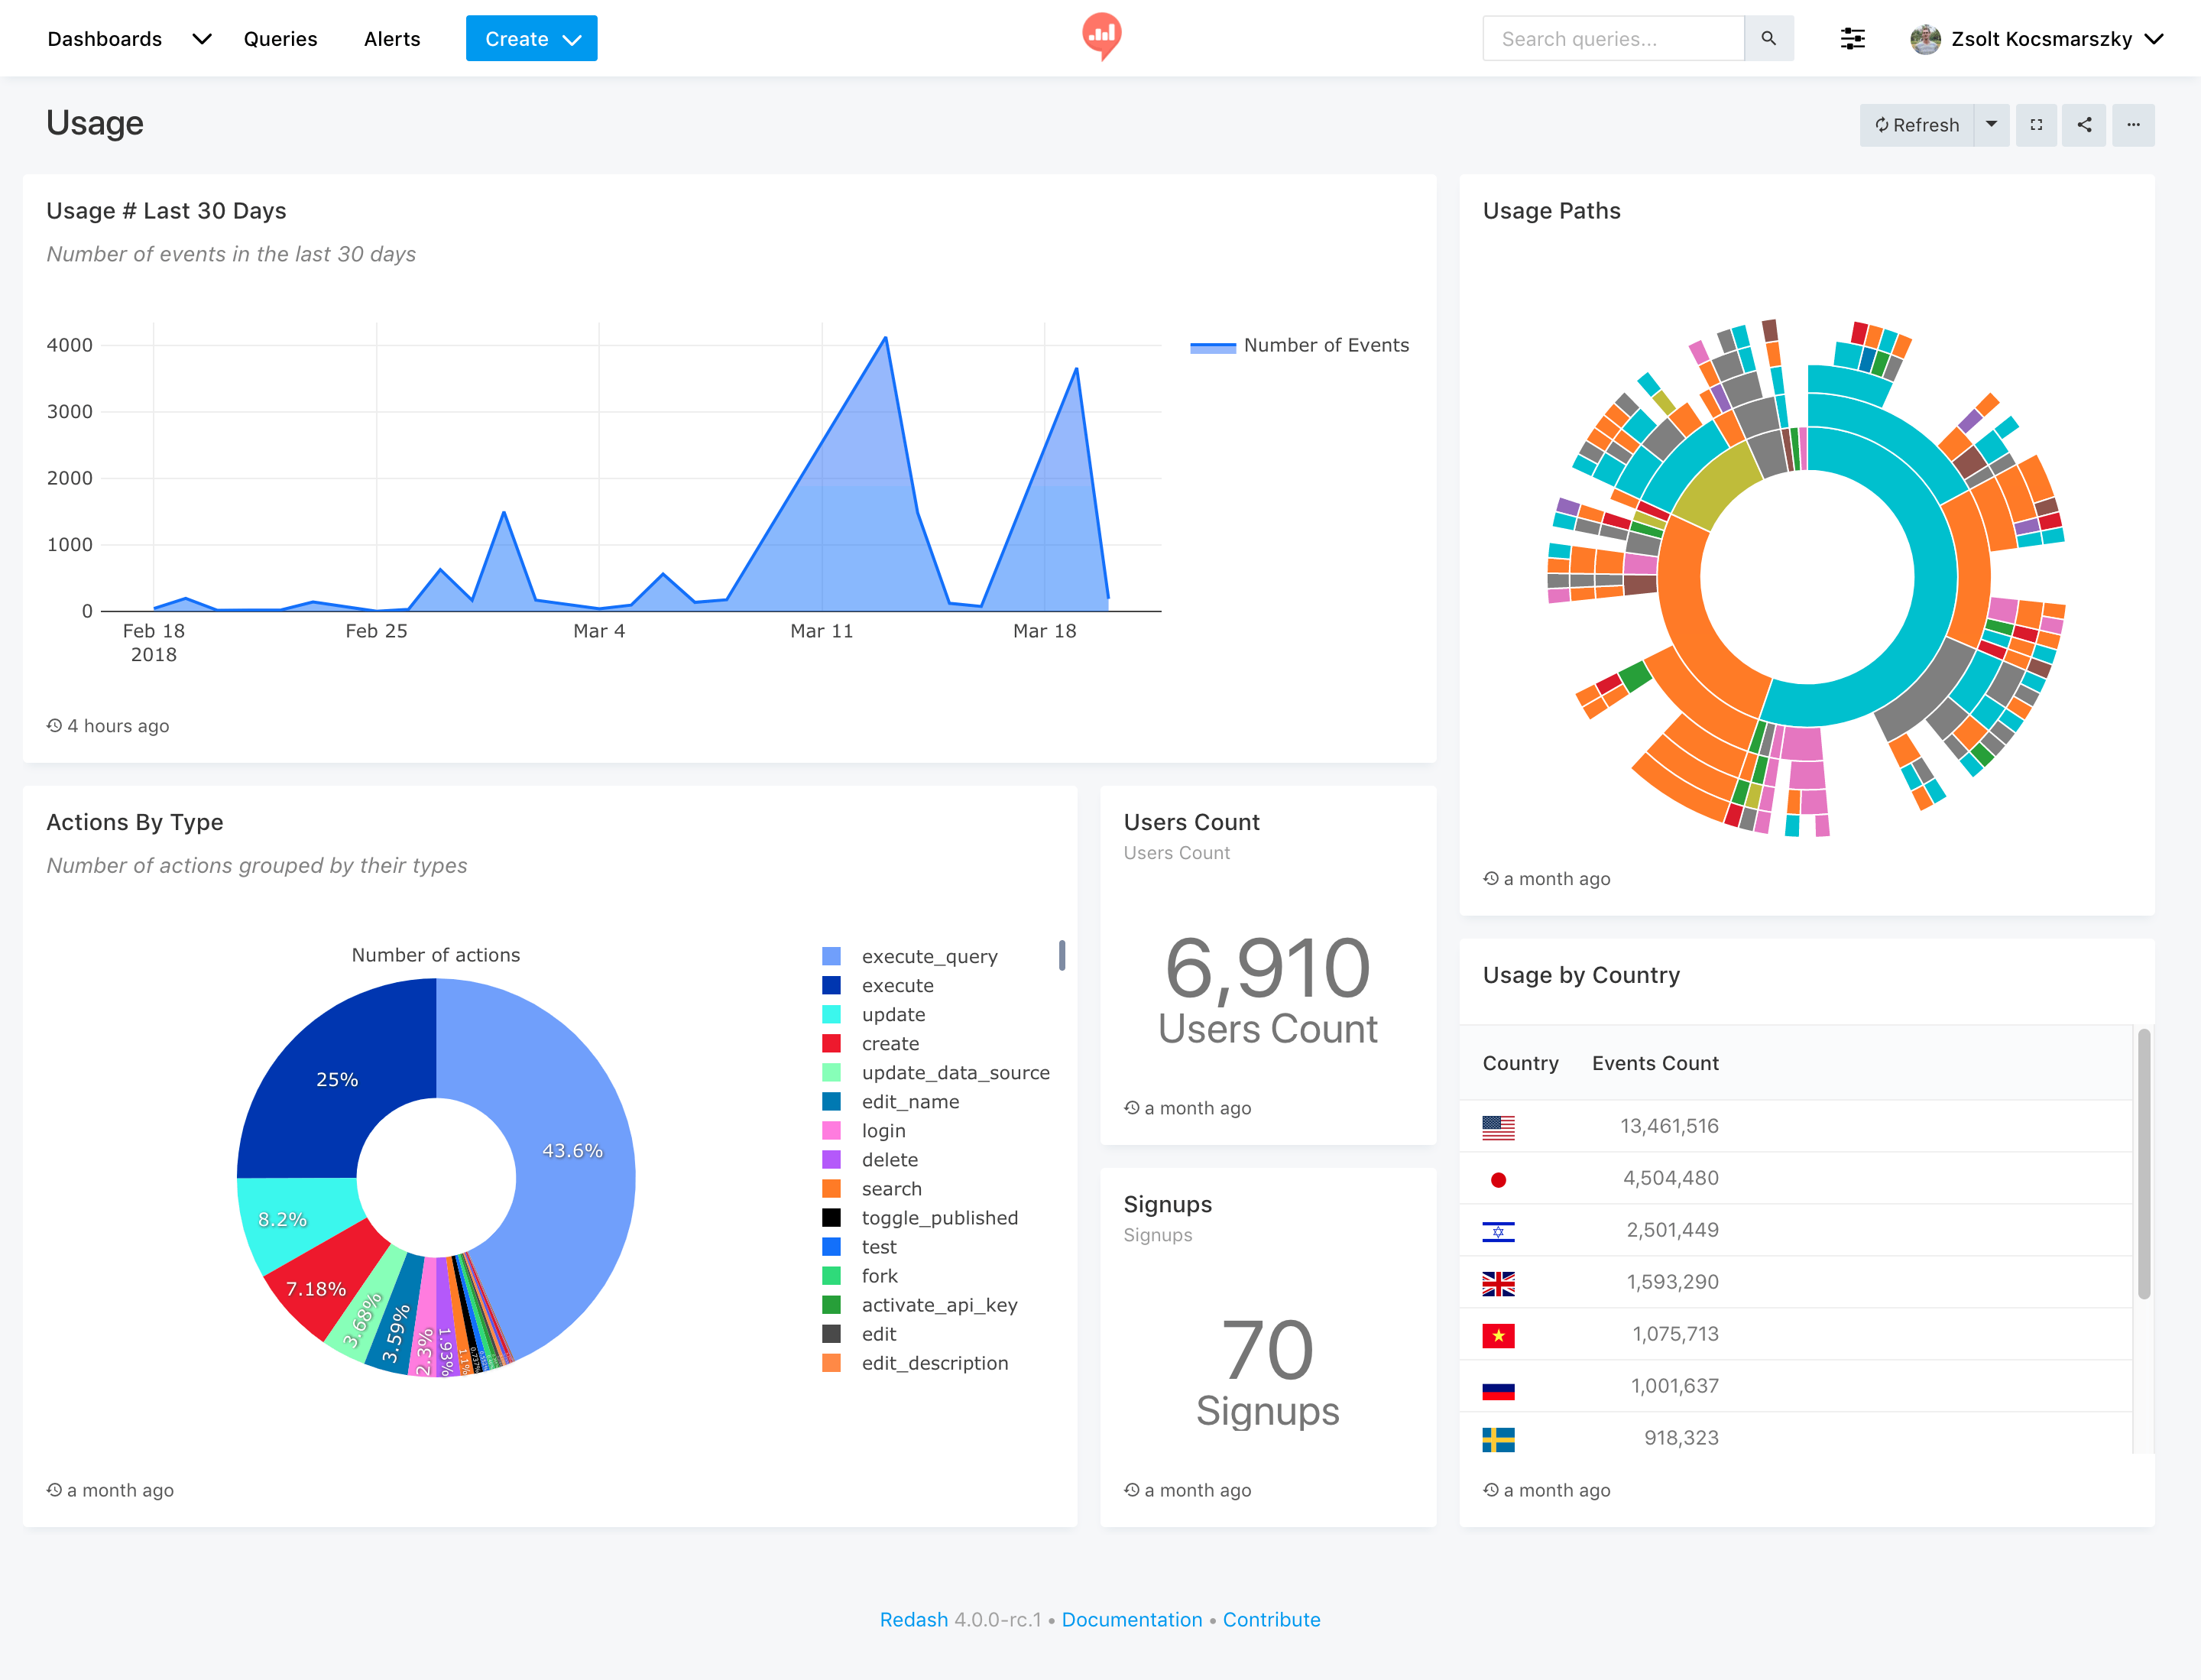
10.Redash
Redash is a simple and intuitive saas reporting tool that supports a wide range of data sources, including SQL, NoSQL, and REST APIs. It enables real-time collaboration and allows power users to write SQL queries for advanced analysis.
Simple interface for technical and non-technical users
Higher complexity during initial setup
Supports many data sources (SQL, NoSQL, REST APIs)
Limited visual customization options
Real-time collaboration features
No built-in ETL tooling
Power users can write SQL queries
Reliance on SQL may intimidate non-technical users
Pros:
Easy to use for both developers and business users
Supports a wide variety of cloud and on-premises data sources
Enables real-time collaboration on dashboards and reports
Cons:
Basic visualization options
No built-in ETL, requires external tools for data preparation
SQL knowledge needed for advanced features
Best Use Cases: Teams needing simple, collaborative saas reporting tools with broad data source support and real-time dashboards.
Database Reporting Tools Comparison Table
Features Overview
When businesses compare database reporting tools, they look for features that help them turn data into insights fast. Here are some of the most important criteria:
Advanced data visualization: Customizable dashboards make it easy to see trends and patterns.
Ad hoc reporting: Users can create custom reports without needing deep technical skills.
Robust security and compliance: Encryption and secure access controls keep data safe.
Seamless data integration: Tools connect to many sources, so teams get unified reporting.
Predictive analytics and AI: These features help forecast trends and support proactive decisions.
Collaboration tools: Real-time sharing, commenting, and permissions boost teamwork.
Self-serve data exploration: Search, filter, and drill down into data without IT help.
Performance: Fast response times, even as data and user numbers grow.
Tip: Choosing a tool with strong data integration and easy-to-use reporting features can save time and reduce errors.
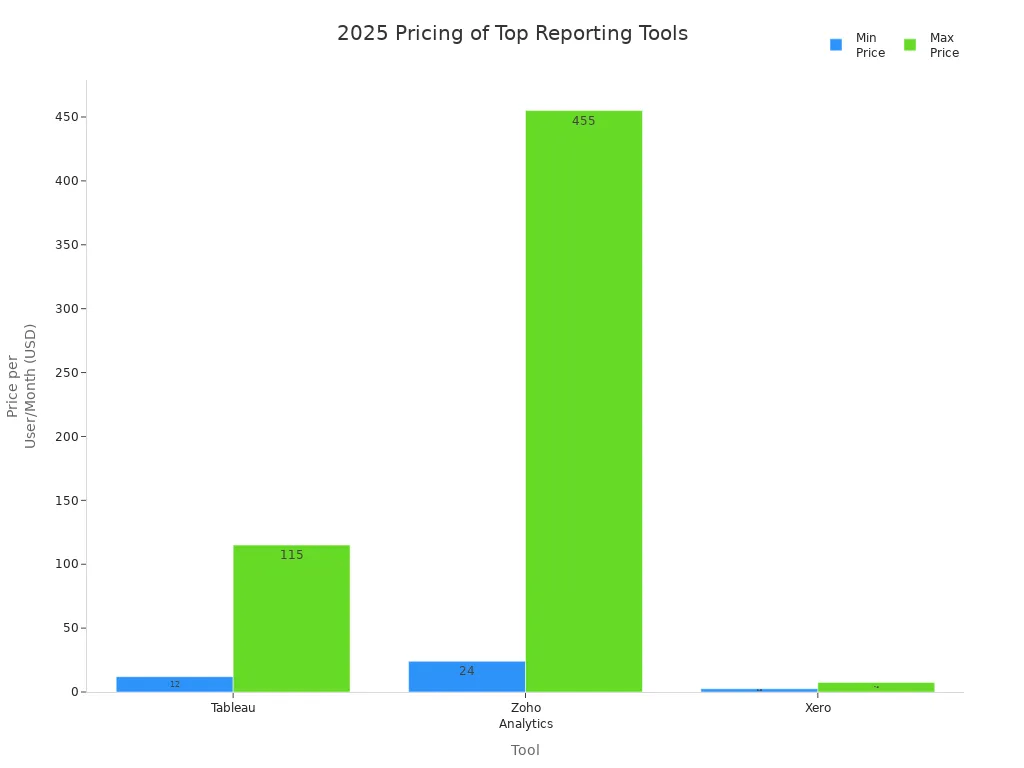
Pricing Snapshot
Pricing for database reporting tools in 2025 varies a lot. Some offer transparent monthly plans, while others use custom quotes for enterprise needs. Here’s a quick look at popular options:
Tool
Pricing Model
Price Range (per user/month)
Notes
Tableau
Tiered per-user pricing
$12 - $115
Plans vary by features
Zoho Analytics
Subscription tiers
$24 - $455
Custom pricing available
Xero
Promotional pricing
$2.50 - $7.50 CAD
Small business plans, free trial
Others (SaaS)
Custom quote
N/A
Contact sales for details
Many saas reporting tools let companies scale up or down as their data needs change. This flexibility helps businesses manage costs while getting the features they need.
Use Cases
Different reporting tools work best for different business needs. Here are some common use cases:
FineReport: Great for enterprises needing secure, scalable reporting and advanced data integration.
Power BI: Fits companies using Microsoft products and wanting easy cloud-based reporting.
Tableau: Best for teams focused on deep data visualization and interactive dashboards.
Looker: Ideal for saas businesses that need real-time analytics and strong modeling.
Zoho Analytics: Works well for small to mid-sized companies looking for affordable, all-in-one saas reporting.
Metabase and Superset: Good for startups and tech teams who want open-source, customizable reporting.
Redash: Perfect for teams that need simple, collaborative saas reporting with broad data source support.
Note: Always match the tool’s strengths to your team’s data skills and reporting goals.
Selecting the right database reporting tool can drive business growth and unlock new opportunities. Every company has unique needs, so readers should review the comparison table and key features before making a choice.
FineReport stands out for its flexibility and enterprise value. Next steps? Try a demo, explore free trials, or talk with your IT team to find the best fit.
Real-time insights to optimize production, logistics, and decisions.
FAQ
What is a database reporting tool?
A database reporting tool helps users turn raw data into clear reports and dashboards. They connect to different data sources and let teams see trends, track performance, and share insights.
Can FineReport connect to multiple data sources?
FineReport connects to hundreds of data sources, including cloud and on-premises databases. Users can merge data from different places and create unified reports without coding.
Is FineReport mobile-friendly?
FineReport works on smartphones and tablets. Users can view dashboards, reports, and KPIs anywhere. The mobile app supports real-time updates and interactive features.
How does FineReport help with data security?
FineReport uses enterprise-grade security. It controls user access, protects sensitive data, and supports secure sharing. Teams can set permissions for each report or dashboard.
Who uses FanRuan and FineReport?
Many industries use FanRuan-en and FineReport. Manufacturing, retail, finance, and government teams rely on these tools for reporting, analysis, and decision-making.