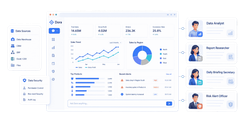
If you’re searching for contact center reporting software, you’re likely trying to answer a practical question: which platform will actually help your team monitor service levels, understand agent performance, spot customer experience problems, and make faster operational decisions.
For contact center leaders, reporting is no longer just about a wallboard showing calls in queue. The right software should support multiple reporting needs at once: real-time visibility for supervisors, historical analysis for operations managers, performance views for QA and coaching teams, and executive summaries for leadership. It should also fit the complexity of your environment, whether you run a small voice-heavy support desk or a large omnichannel operation spanning voice, chat, email, CRM, WFM, and QA systems.
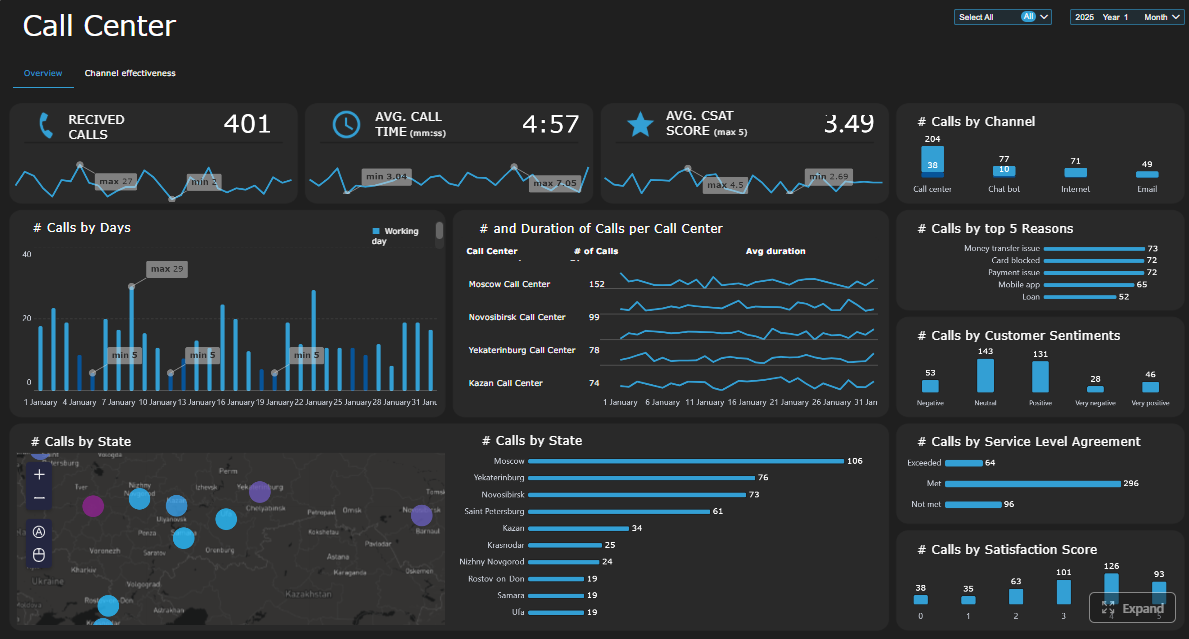 Click To Try The Dashboard
Key Elements of Good Contact Center Reporting Software
| Criteria | What to Look For |
|---|---|
| Real-time dashboards | Live queue, SLA, agent state, and workload visibility for supervisors |
| Historical reporting | Trends by day, week, month, queue, team, channel, and campaign |
| Custom reporting | Flexible report design, custom KPIs, drill-downs, and filtered views |
| Executive summaries | Readable service-level, cost, productivity, and customer outcome reporting |
| Omnichannel visibility | Unified reporting across voice, chat, email, messaging, and digital touchpoints |
| Coaching support | Agent scorecards, QA views, adherence trends, and performance insights |
| Integration readiness | CRM, WFM, QA, BI, and warehouse connectivity |
| Operational fit | A platform that matches your team size, reporting maturity, and admin resources |
What to Look for in Contact Center Reporting Software
Choosing contact center reporting software starts with clarity on the outcome you want. Some teams need better queue monitoring. Others need a deeper analytics layer that combines contact center data with CRM, QA, and workforce planning. The strongest choice depends less on feature lists and more on how reporting fits your operating model.
Define the reporting outcomes that matter most, from SLA visibility to agent performance and forecasting accuracy
Before comparing vendors, define the business questions your reports need to answer. Common priorities include:
- Are we meeting service-level targets by queue and time interval?
- Which agents or teams need coaching support?
- Where are handle times, transfers, or abandon rates rising?
- How accurate are staffing forecasts versus actual demand?
- Which channels create the most friction in the customer journey?
A platform can look impressive in a demo but still fall short if it cannot support the metrics your leadership team actually reviews every day.
Separate real-time dashboards from historical analysis, custom reporting, and executive-level summaries
A common mistake is treating all reporting as one category. In practice, contact centers usually need four layers:
- Real-time dashboards for supervisors managing queues and staffing during the shift
- Historical analysis for trends, root-cause reviews, and planning
- Custom operational reports for specific teams, workflows, or stakeholders
- Executive reporting for monthly or quarterly summaries across service, quality, and cost
Some tools are strongest in live operational monitoring. Others are better at analytics, warehousing, or executive presentation. The right fit depends on which of these layers matter most to your team.
Check data quality, role-based access, export options, and ease of building reports without analyst support
Even the most attractive dashboard has limited value if users do not trust the numbers or cannot access the report they need. Look closely at:
- Data refresh frequency and latency
- Historical retention limits
- Role-based permissions for supervisors, QA, managers, and executives
- Scheduled exports to PDF, Excel, email, or shared portals
- Self-service report building for operations users
- Auditability and governance for enterprise teams
These details often determine whether a reporting tool becomes part of daily operations or gets replaced by spreadsheets.
Evaluate how well each platform fits your team size, channel mix, and operational maturity
A smaller support team may prefer easy out-of-the-box reports and minimal admin work. A large enterprise contact center may need more governance, warehouse connectivity, and cross-system reporting. Your mix of voice, chat, messaging, CRM, WFM, QA, and AI tools also matters.
A tool that fits a single-site inbound center may not fit a distributed omnichannel operation with strict executive reporting needs.
7 Best Tools Compared by Reporting Depth and Operational Fit
Below is a practical comparison of seven common options and vendor categories that buyers evaluate for contact center reporting.
Tool 1: Best for integration-first reporting ecosystems
Best fit: FineReport
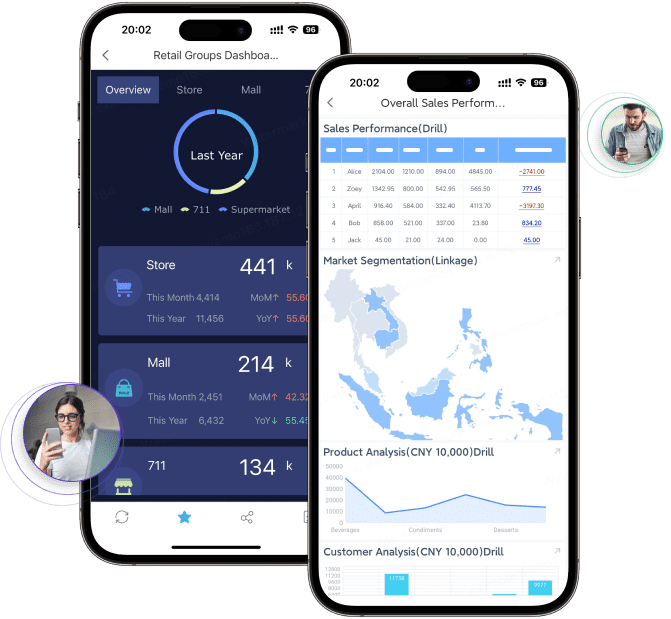
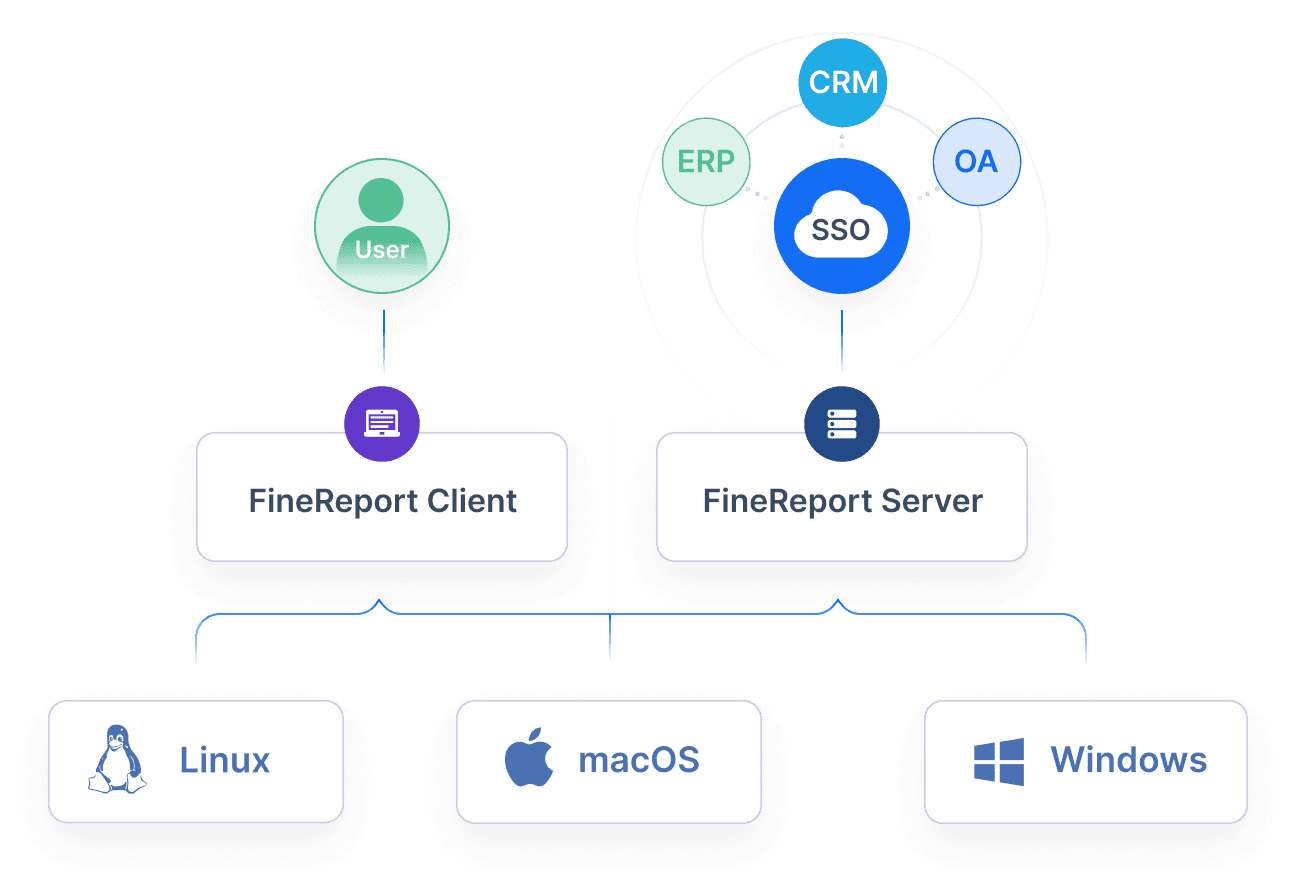
 FineReport is a strong choice for organizations that need integration-first reporting across contact center systems and enterprise data sources, especially when dashboards alone are not enough. It is particularly relevant for teams that need custom operational reports, pixel-perfect layouts, scheduled distribution, role-based report access, and report workflows that combine multiple systems.
Strengths in connecting CRM, WFM, QA, and BI tools for broader analysis
- Supports highly formatted, pixel-perfect reports for operational and executive use
- Suitable for paginated reports, printable reports, and recurring scheduled reporting
- Supports parameter queries so users can filter by team, queue, date, region, or supervisor
- Can combine dashboard-style views with structured tabular reporting
- Useful when teams need reporting from multiple systems such as CRM, ERP, WFM, QA, or warehouse sources
- Supports scheduled distribution and enterprise reporting governance
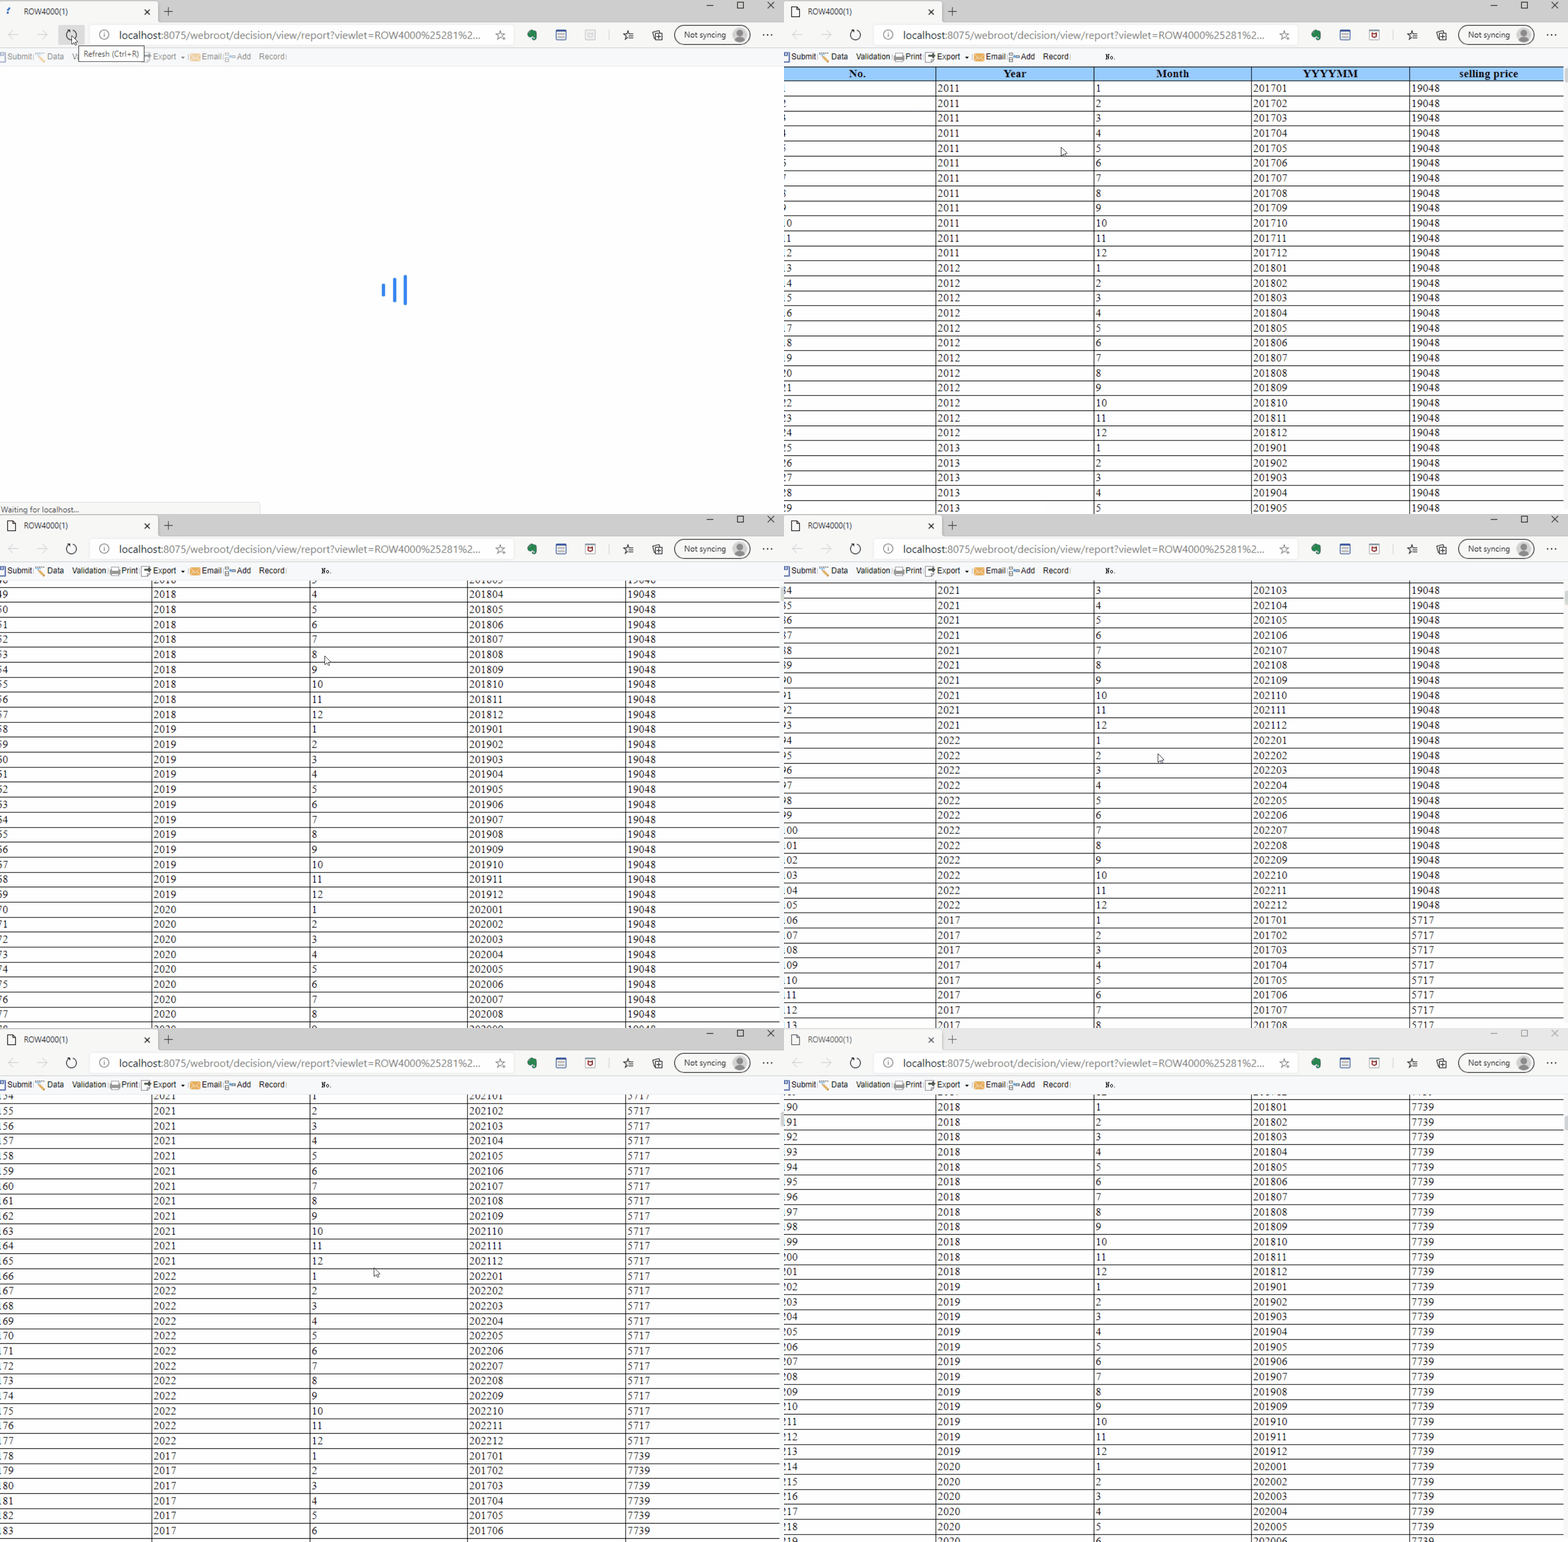
- Can also support data entry and form-based workflows when reporting processes require write-back or manual input
Trade-offs in dependency on third-party stack and technical resources
- Not a CCaaS platform itself
- Works best when organizations already know what reporting processes they need to standardize
- May require planning around data sources and report design
- More relevant for reporting-heavy environments than teams seeking only basic native dashboards
FineReport is especially relevant when contact center teams need a dedicated reporting platform layered on top of their operational stack.
Tool 2: Best for customizable dashboards and flexible analytics
Best fit: Microsoft Power BI
Power BI is a strong option for teams that want flexible analytics, customizable dashboards, and broad data connectivity. It is especially useful when contact center data needs to be combined with CRM, finance, workforce, or customer outcome data.
Strengths in report building, drill-down visibility, and cross-team sharing
- Highly flexible dashboard creation
- Strong drill-down and filtering capabilities
- Good fit for organizations already using Microsoft tools
- Useful for combining contact center metrics with broader business reporting
- Strong support for custom analytics models
Trade-offs in setup time, pricing complexity, or learning curve
- Often requires more data modeling and BI support than packaged contact center reports
- Not purpose-built for contact center operations workflows
- Real-time supervisory reporting may need additional architecture
- Can become difficult to govern as report usage grows
Power BI is often a good analytics layer, but some teams still need a more structured reporting tool for operational distribution, print-ready reports, or tightly formatted reporting workflows.
Tool 3: Best for omnichannel reporting across voice, chat, and digital
Best fit: NICE CXone
NICE CXone is commonly evaluated by larger contact centers that need omnichannel reporting across voice and digital channels within a broader cloud contact center platform.
Strengths in unifying channel data and surfacing customer journey trends
- Broad support for omnichannel contact center environments
- Strong operational visibility across queues and channels
- Often selected by enterprises looking for a full CX platform
- Useful for tracking service and interaction patterns across touchpoints
Trade-offs in customization limits or integration dependencies
- Reporting flexibility may vary depending on module and environment
- Advanced custom analysis may still require external BI tools
- Full value often depends on broader platform adoption
- Enterprise deployments can involve more implementation effort
For teams standardizing on a major CCaaS platform, NICE is often compelling. For highly customized reporting across external systems, many organizations still extend with BI or reporting software.
Tool 4: Best for workforce visibility and performance management alignment
Best fit: Calabrio ONE
Calabrio is frequently considered by teams that want reporting tied closely to workforce engagement, quality, and performance management.
Strengths in agent scorecards, adherence reporting, and coaching insights
- Strong workforce and agent performance visibility
- Useful scorecards for supervisors and team leads
- Good alignment with coaching and quality workflows
- Helps connect reporting to agent improvement activities
Trade-offs in advanced analytics depth or implementation effort
- Deep custom analytics may require added tooling
- Broader enterprise reporting needs can extend beyond native use cases
- User adoption can depend on training and process maturity
- Some organizations may need additional reporting layers for executives
Calabrio can be a practical choice when coaching, QA, and workforce management are central to the reporting strategy.
Tool 5: Best for enterprise-scale analytics and governance
Best fit: Tableau
 Tableau is widely used for enterprise analytics and executive reporting. It is strongest when teams need advanced visual exploration, governed data sources, and polished analytical dashboards across departments.
Strengths in security, custom data models, and executive reporting
- Strong visual analytics and exploration
- Good enterprise governance capabilities
- Useful for executive reporting and broader operational analysis
- Well suited for organizations with mature data teams
Trade-offs in cost, admin overhead, or speed to value
- Can require analyst resources for robust report development
- Less focused on paginated operational reporting
- Not designed specifically for contact center workflows
- Distribution of highly formatted recurring reports may require additional tooling
Tableau is a solid fit for enterprise analytics teams, but operations leaders should confirm whether it also covers recurring day-to-day reporting needs.
Tool 6: Best for fast deployment and easy operational reporting
Best fit: Intermedia Contact Center Reporting
 Intermedia is often attractive for teams that want quick access to operational dashboards and standard contact center reports without heavy BI work.
Strengths in out-of-the-box dashboards and supervisor usability
- Prebuilt queue, agent, and call summary reporting
- Easy for supervisors to consume
- Historical dashboards can support everyday monitoring
- Export and sharing features are useful for routine operations
Trade-offs in advanced customization or long-term scalability
- Less flexible than a full BI platform for complex custom reporting
- May depend on the surrounding platform ecosystem
- Advanced enterprise analytics needs may outgrow native reporting
- Cross-system analytics can require external tools
This type of platform works well when simplicity and speed matter more than deep analytics customization.
Tool 7: Best for AI-assisted insights and anomaly detection
Best fit: Verint or AI-driven contact center analytics platforms
 AI-assisted analytics tools are gaining attention for surfacing patterns, identifying performance anomalies, and helping teams find issues faster across conversations and operations.
Strengths in trend discovery, alerting, and proactive issue identification
- Can surface hidden trends in large interaction volumes
- Useful for spotting anomalies, compliance issues, or emerging service problems
- Often integrates with speech or interaction analytics
- Helps managers move from reactive to proactive reviews
Trade-offs in explainability, model tuning, or premium add-ons
- AI findings still need human interpretation
- Explainability may vary by feature
- Advanced functions can be packaged as premium modules
- Not every team needs this level of sophistication
These tools are most useful when you already have enough interaction data volume to benefit from automated pattern detection.
Side-by-Side Comparison Criteria That Matter Most
Quick Comparison Table
| Tool | Best for | Dashboarding | Pixel-perfect reporting | Paginated reports | Data entry/forms | Scheduling and distribution | Enterprise deployment | Ease of use | Recommended users |
|---|---|---|---|---|---|---|---|---|---|
| Power BI | Flexible analytics and custom dashboards | Strong | Limited for formal reporting | Limited | No native operational focus | Available, but not its main strength | Strong | Moderate | Analytics teams, operations with BI support |
| NICE CXone | Omnichannel contact center reporting | Strong | Limited in comparison to dedicated reporting tools | Limited | Not a primary use case | Good within platform workflows | Strong | Moderate | Enterprise CCaaS environments |
| Calabrio ONE | Workforce and performance visibility | Good | Limited | Limited | Not a primary use case | Good for WEM-related reporting | Strong | Moderate | QA, WFM, and coaching-focused teams |
| Tableau | Enterprise analytics and executive dashboards | Strong | Limited for highly formatted reports | Limited | No | Available through ecosystem options | Strong | Moderate to advanced | Data teams and enterprise analytics groups |
| Intermedia | Fast operational reporting | Good | Basic | Basic | No | Good for routine operational distribution | Mid-market | Easier | Supervisors and smaller operations teams |
| Verint / AI analytics tools | AI-assisted insight discovery | Good | Limited | Limited | No | Varies by module | Strong | Moderate | Larger teams with advanced analytics needs |
| FineReport | Structured enterprise reporting and multi-system operational reporting | Good | Strong | Strong | Supported | Strong | Strong | Moderate | Teams needing governed, scheduled, formatted reporting |
Reporting depth
When evaluating contact center reporting software, reporting depth matters more than the number of charts shown in a demo.
Look for differences in:
- Standard dashboards versus custom report design
- Ability to define custom metrics
- Drill-down from high-level KPI to agent or interaction detail
- Historical trend depth and retention
- Support for print-ready or board-ready reporting
- Whether reports can blend contact center and enterprise data
A platform may offer strong real-time dashboards but weak structured reporting. Another may provide deep executive summaries but limited supervisor views.
Operational fit
Operational fit is about whether the tool matches how your team works.
- SMB teams often value quick setup and easy supervisor dashboards
- Mid-market teams often need better customization and cross-functional reporting
- Enterprise teams often need governance, security, role-based access, and integration with multiple systems
This is why the “best” tool varies so much between organizations.
Analytics and coaching support
If your primary goal is performance improvement, review how each platform supports:
- Agent scorecards
- QA visibility
- Coaching workflows
- Trend analysis over time
- Alerts for service or compliance risk
- Root-cause visibility by team, queue, or interaction type
Platforms closer to workforce engagement tend to do well here, while BI tools may require more design work to deliver the same experience.
Integration and total cost
Many reporting decisions are really integration decisions. Ask how well the platform connects with:
- CRM
- WFM
- QA and speech analytics
- Data warehouses
- Existing BI tools
- Export and scheduled distribution channels
Also consider implementation effort, admin overhead, and the cost of needing a second reporting layer later.
How to Choose the Right Platform for Your Team
The right platform depends on what your team is trying to improve first.
For teams focused on service levels and daily operations
Prioritize:
- Real-time visibility
- Queue monitoring
- SLA alerts
- Clear supervisor workflows
- Fast report access during the shift
In these cases, native contact center reporting tools may be enough, especially for smaller or mid-sized teams.
For teams focused on agent performance improvement
Look for:
- Agent scorecards
- QA-linked reporting
- Adherence and productivity visibility
- Coaching workflows
- Trend reporting by individual and team
If reporting is tightly connected to workforce engagement, platforms like Calabrio or Verint-related ecosystems may be worth closer review.
For teams building a broader analytics stack
Favor platforms with:
- Strong APIs
- Warehouse connectivity
- Flexible semantic or data modeling
- Dashboard and custom reporting support
- Cross-system reporting across CRM, WFM, QA, and finance
This is where Power BI, Tableau, or a dedicated reporting layer like FineReport can become more valuable.
Questions to ask before committing
Before signing a contract, ask vendors:
- How fresh is the data in dashboards and reports?
- What are the limits on custom metrics and custom report layouts?
- How much historical data is retained?
- Can supervisors and managers build reports without technical help?
- How are reports scheduled and distributed?
- Can the platform combine contact center data with CRM, QA, or warehouse data?
- What support is provided during rollout and adoption?
Practical Recommendations for Evaluating Contact Center Reporting Software
- Map reporting by role, not just by feature. Supervisors, QA leads, operations managers, and executives need different report formats and refresh speeds.
- Separate dashboard requirements from formal reporting requirements. A strong dashboard tool is not always strong at scheduled, formatted, recurring reporting.
- Test one real operational workflow. For example, can the tool support a daily SLA report, an agent coaching report, and a monthly executive summary without manual spreadsheet work?
- Check whether cross-system reporting is native or custom. Many contact center reporting gaps only appear after teams try to blend CRM, QA, and WFM data.
- Plan for scale early. A simple reporting layer may work now, but as channels, teams, and executive expectations grow, governance and customization matter more.
When FineReport Is a Good Fit for Contact Center Reporting
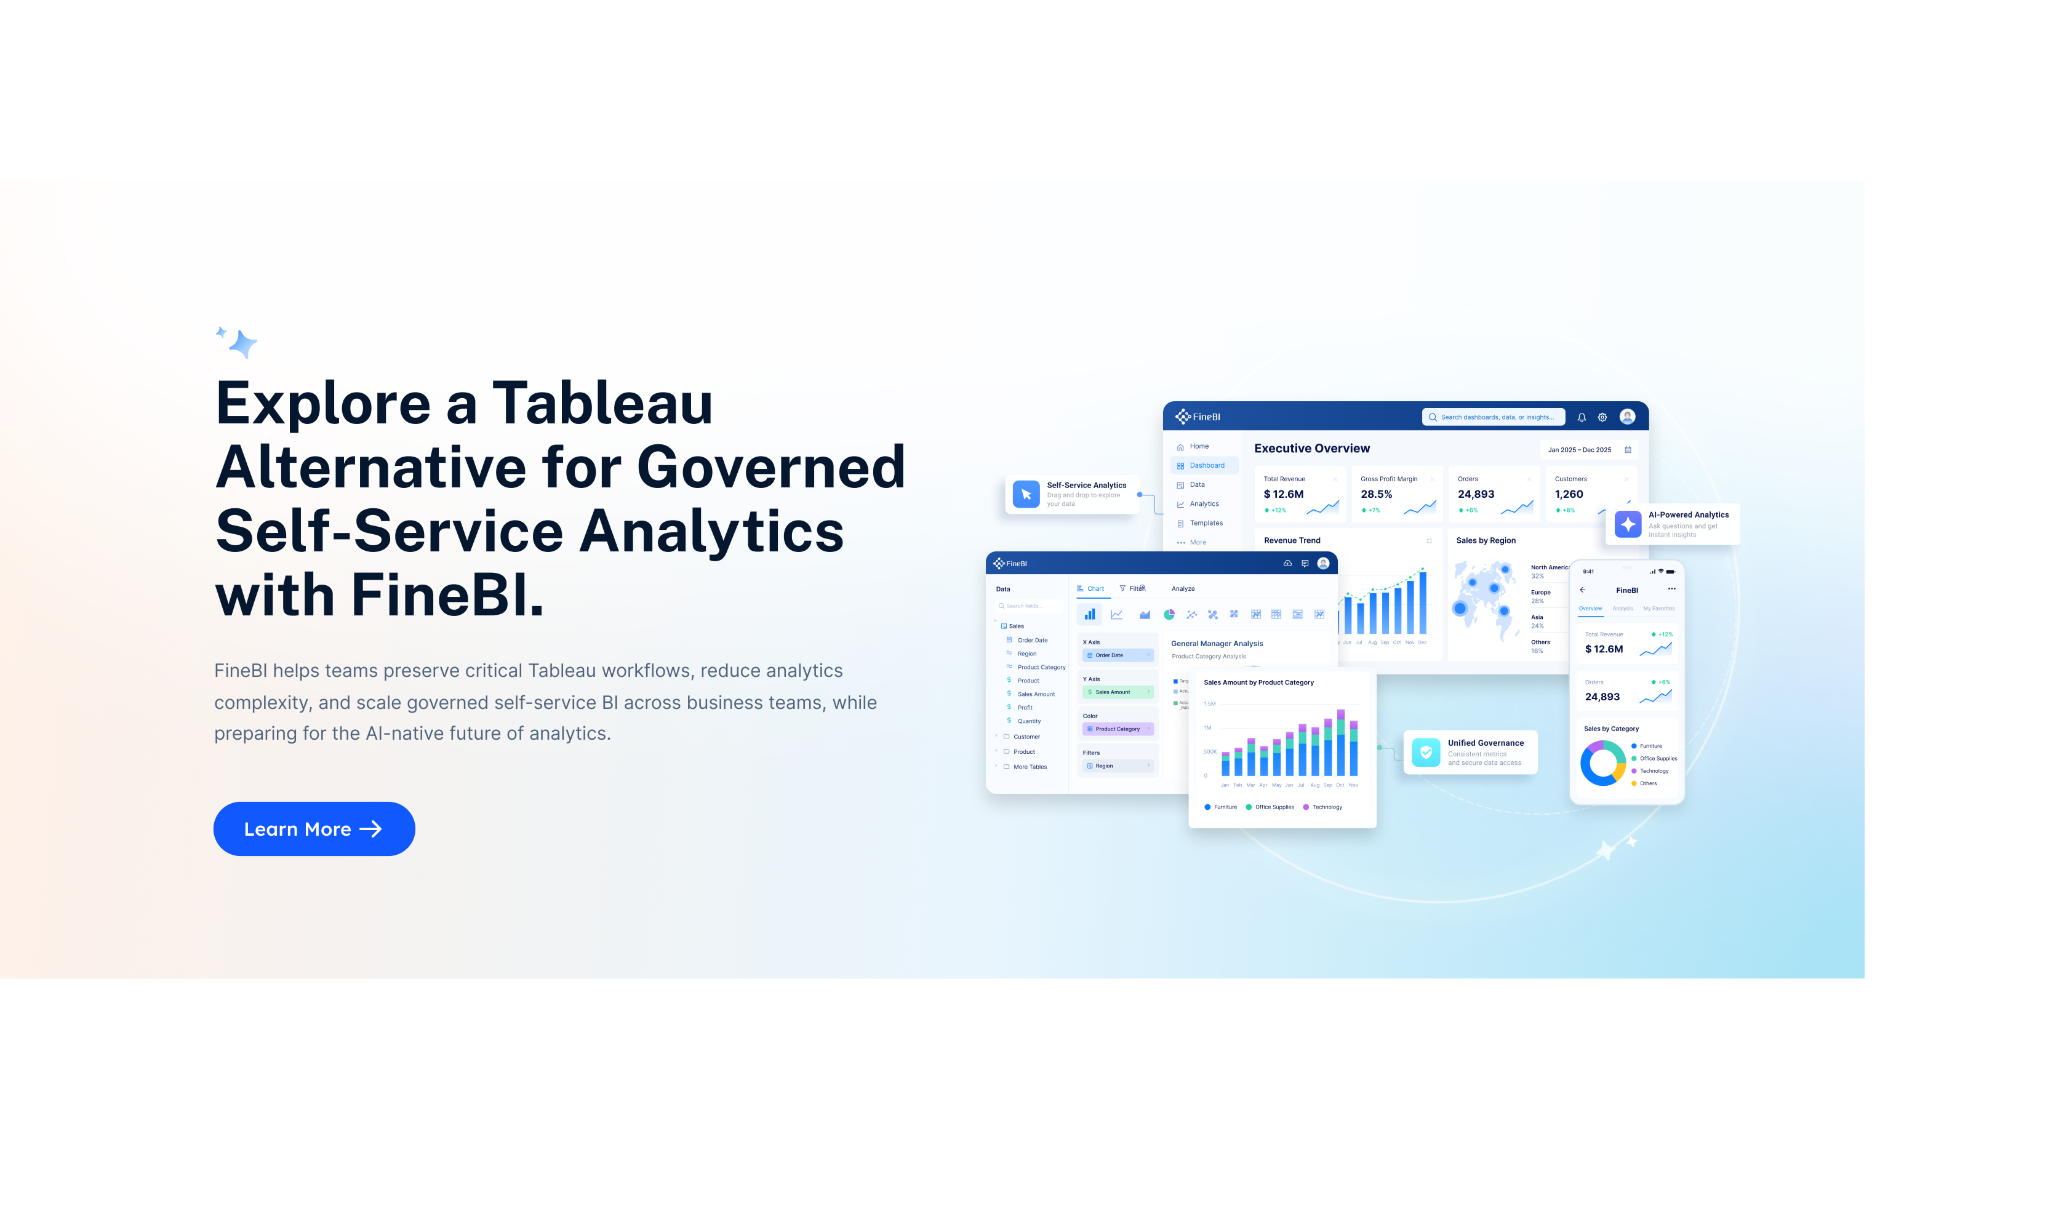
Tools like Tableau and Power BI are widely used for visualization and BI analysis, while contact center suites like NICE, Calabrio, and Intermedia provide native operational reporting inside their own ecosystems. But teams with more complex reporting workflows may also need a dedicated enterprise reporting platform like FineReport.
FineReport is especially relevant when your contact center needs go beyond standard dashboards and into structured operational reporting. For example:
- Daily SLA and queue reports distributed automatically to managers
- Executive-ready weekly or monthly reports with fixed layouts
- Parameterized reports by business unit, region, queue, or supervisor
- Combined reporting from contact center, CRM, QA, WFM, and enterprise systems
- Printable, paginated reports for audit, review, or management meetings
- Form-based workflows when teams need reporting plus manual data input
These use cases are common in larger service organizations where reporting supports not only visibility, but also accountability and recurring management processes.
FineReport also makes sense when teams want to combine dashboard-style KPI monitoring with pixel-perfect reports in the same reporting environment. That can be useful in contact centers where supervisors need quick visuals, while directors and executives need structured summaries with consistent formatting.

Get Ready-to-Use Dashboard and Report Templates in Fine Gallery
Final Verdict: Which Tool Fits Which Use Case
There is no single winner for every contact center. The best contact center reporting software depends on what kind of reporting your team relies on most.
- Best overall choice for balanced reporting depth and usability: A platform like Power BI is often a strong all-around option if your team has some BI capability and wants flexible analytics.
- Best option for advanced analytics-heavy environments: Tableau or AI-driven analytics environments can be a good fit for enterprises prioritizing deep exploration and analytical storytelling.
- Best fit for fast-growing teams that need quick implementation: Native reporting options like Intermedia can work well when speed and simplicity matter more than deep customization.
- Best choice for organizations that rely on deep integrations and custom reporting: FineReport is a practical fit when your reporting needs extend across systems and require structured, scheduled, highly formatted operational reporting.
The key takeaway is simple: start with your reporting workflow, not the vendor demo. If your priority is live queue management, choose a tool optimized for operational monitoring. If your priority is executive reporting, cross-system governance, or formal report distribution, make sure the platform can support those requirements without pushing your team back into spreadsheets.
FAQs
Contact center reporting software helps teams monitor service levels, queue activity, agent performance, and customer experience metrics. It turns operational data into dashboards and reports that support faster decisions.