For many small business owners, a cash crunch does not begin when the bank balance looks low. It usually starts earlier, in the balance sheet. That is why Balance Sheet Analysis should be a monthly discipline rather than a once-a-year exercise for tax filing or lender requests.
A profit and loss statement can show that revenue is growing and margins appear acceptable. Yet the business may still be moving toward strain because customers are paying slowly, inventory is building too quickly, debt obligations are rising, or owner withdrawals are quietly reducing the cushion. A regular balance sheet review helps identify those issues before they become urgent.
This article explains what to review every month, what the numbers mean, and how to turn a simple financial review into practical decisions that protect cash flow.
What balance sheet analysis is
Balance Sheet Analysis is the process of reviewing a company’s balance sheet to understand its financial position at a specific point in time. Unlike the income statement, which covers performance over a period, the balance sheet is a snapshot. It shows what the business owns, what it owes, and what remains for the owner after liabilities are considered.
At its most basic, the balance sheet follows this formula:
Assets = Liabilities + Equity
That equation matters because it reveals how the business is being financed. If assets are increasing, the next question is whether that growth is being funded by cash generated from operations, borrowed money, or additional owner investment.
For a small business, balance sheet analysis is not an academic exercise. It is a practical way to answer questions such as:
Can the business cover near-term obligations?
Is working capital getting tighter?
Are receivables collecting too slowly?
Is debt becoming harder to support?
Is growth improving the business, or putting pressure on cash?
When reviewed monthly, the balance sheet becomes an early-warning tool.
Why monthly balance sheet analysis matters for small business cash flow
Monthly review is important because cash flow problems often build gradually. They do not always show up first in sales reports or profit margins.
How the balance sheet helps you spot pressure before it shows up in the bank account
A business can appear stable while hidden pressure builds in several places:
Accounts receivable may be rising faster than sales, meaning more revenue is trapped in unpaid invoices.
Inventory may be accumulating, tying cash up in stock that is not moving quickly enough.
Accounts payable may be increasing because the company is delaying supplier payments to preserve cash.
Short-term debt may be growing to cover operating needs.
By the time the bank account reflects the problem, management options are often narrower and more expensive. A monthly balance sheet analysis allows owners to see the pressure points early and respond with better timing.
The link between liquidity, debt, and day-to-day operating decisions
Liquidity is not just a finance concept. It affects daily decisions across the business:
whether to reorder inventory now or wait,
whether to extend credit to a customer,
whether to hire,
whether to take an owner draw,
whether to invest in equipment,
whether to renegotiate supplier terms.
If short-term liquidity is weakening, even profitable businesses can struggle to meet payroll, taxes, rent, or loan payments. Debt adds another layer of pressure because principal and interest commitments reduce future flexibility.
Monthly balance sheet analysis connects these obligations to operating reality.
Common warning signs owners miss when they only review the profit and loss statement
Owners who focus mainly on revenue, gross profit, and net income can miss critical signs such as:
profits increasing while cash declines,
sales growth requiring more receivables and inventory than expected,
high owner draws reducing retained equity,
debt building faster than the business’s ability to service it,
payables stretching beyond normal supplier terms.
The profit and loss statement answers, “Did the business earn money?”
The balance sheet helps answer, “Can the business sustain itself financially?”
Balance Sheet Analysis: the key sections every owner should review
A sound monthly review starts with understanding what the statement is showing.
A simple explanation of what a balance sheet shows at a point in time
A balance sheet reports the company’s financial position as of a specific date, such as the last day of the month. It does not summarize the entire month’s activity in the same way as an income statement. Instead, it shows the ending balances of assets, liabilities, and equity.
That point-in-time view is valuable because many cash flow risks are balance-based rather than profit-based.
The three core components: assets, liabilities, and equity
The three core sections are straightforward:
Section
What it includes
Why it matters
Assets
Cash, receivables, inventory, equipment, prepaid expenses, other resources
Shows what the business controls and may use to generate cash or operations
How these sections connect to the other core financial statements
A balance sheet should never be read in isolation.
The income statement explains why retained earnings may have increased or decreased through profit or loss.
The cash flow statement explains how cash changed over the period even when profit and balance sheet totals moved in different directions.
For example, a profitable month may still result in lower cash if:
receivables increased,
inventory purchases were heavy,
debt principal was repaid,
equipment was purchased,
owner distributions were large.
This is why monthly financial review works best when all three statements are aligned. Many small businesses use reporting platforms to bring these views together more clearly; tools such as FineReport can help organize monthly dashboards, variance tracking, and management visuals when the accounting data becomes too cumbersome to review manually.
What the numbers can tell you about financial health
The value of Balance Sheet Analysis comes from interpretation, not just reading totals.
Whether the business can cover short-term obligations
The first question is whether the company has enough near-term resources to meet near-term obligations.
Focus on:
cash and cash equivalents,
accounts receivable likely to be collected soon,
inventory that can realistically convert to sales,
current liabilities due within 12 months.
Two practical indicators are:
Working capital = Current assets - Current liabilities
Current ratio = Current assets / Current liabilities
A positive working capital position and a reasonable current ratio generally indicate better short-term flexibility. However, quality matters. A high current ratio does not help much if a large part of current assets consists of slow-moving inventory or overdue receivables.
Whether growth is being funded by cash, debt, or owner contributions
Growth can be financed in several ways:
internally generated cash,
additional loans or credit lines,
owner contributions,
delayed payments to suppliers.
Each has different implications.
If assets are growing because receivables and inventory are expanding while debt and payables also rise, the business may be growing in a way that increases future cash pressure. If growth is supported by healthy retained earnings and stable collections, the picture is stronger.
How to make a balance sheet analysis each month without getting overwhelmed
Owners often avoid monthly review because they expect it to be time-consuming or overly technical. In practice, a focused process can be efficient.
Start with cash and cash equivalents, then move to receivables, payables, and debt
A practical monthly sequence is:
Cash and cash equivalents
Review ending cash, restricted cash if any, and changes from prior months.
Accounts receivable
Check total balance, aging, large overdue customers, and whether growth aligns with sales trends.
Inventory
Review total inventory, obsolete stock, and whether purchases are outrunning sales.
Accounts payable
Examine supplier balances, due dates, and whether payment timing reflects strategy or stress.
Short-term and long-term debt
Review upcoming payments, covenant requirements, and interest burden.
Equity and owner activity
Confirm distributions, capital contributions, and retained earnings movement make sense.
This order keeps attention on the items most likely to affect liquidity.
Compare this month with prior months to identify unusual swings
A single month rarely tells the full story. Trend review is more useful than isolated figures.
Compare the current balance sheet with:
the prior month,
the same month last year if seasonality matters,
monthly averages where useful.
This helps answer whether a change is normal, temporary, or part of a developing pattern.
A simple trend table can be highly effective:
Line Item
This Month
Last Month
3 Months Ago
Trend Note
Cash
$42,000
$58,000
$71,000
Declining steadily
Accounts Receivable
$126,000
$110,000
$94,000
Growing faster than sales
Inventory
$89,000
$76,000
$72,000
Build-up needs explanation
Accounts Payable
$67,000
$52,000
$49,000
Supplier obligations rising
Short-Term Debt
$30,000
$20,000
$10,000
Increased reliance on borrowing
Even without advanced ratio analysis, this type of comparison can reveal pressure quickly.
Check whether balances match what is happening operationally in sales, inventory, and expenses
Numbers should connect to operational reality.
Ask whether the balance sheet reflects what actually happened in the business:
If sales increased, did receivables rise proportionately?
If purchasing slowed, why is inventory still climbing?
If expenses were cut, why are accrued liabilities higher?
If cash is down, which operating change explains it?
When balances do not match operations, there may be either a business issue or an accounting issue.
Questions to ask when a line item changes sharply
Large month-to-month changes deserve explanation before decisions are made.
Is the change seasonal, one-time, or part of a larger trend?
Some movements are normal:
inventory builds before a peak season,
receivables rise after a strong sales month,
tax liabilities increase at quarter-end.
Others may be one-off events:
a major equipment purchase,
an insurance prepayment,
a delayed customer payment,
a debt refinance.
The most important category is recurring trend movement. If payables rise every month and cash falls every month, that pattern deserves action.
Does the movement improve cash flow or create future pressure?
Not every increase is bad and not every decrease is good.
For example:
A temporary increase in inventory may support a profitable seasonal opportunity.
A drop in payables may reflect strong cash management.
A rise in receivables may be acceptable if collections remain disciplined.
A sharp increase in short-term debt may solve today’s problem while worsening next quarter’s pressure.
The key is whether the change strengthens or weakens future flexibility.
Is there a bookkeeping issue that needs correction before decisions are made?
Balance Sheet Analysis is only useful when records are accurate. Before reacting, confirm whether unusual figures result from:
duplicate entries,
unapplied customer payments,
unrecorded loan balances,
incorrect cutoff timing,
misclassified expenses or assets,
inventory valuation errors.
A wrong number can lead to the wrong action. Monthly review should include a basic data-quality check.
The monthly balance sheet analysis checks that help prevent a cash crunch
Certain checks are especially effective for identifying early strain.
Review working capital and short-term liquidity
Working capital is one of the clearest monthly indicators of cash resilience.
Measure whether current assets are enough to cover current liabilities
Start with these core measures:
Working capital = Current assets - Current liabilities
Current ratio = Current assets / Current liabilities
Quick ratio = (Cash + Receivables + Near-cash assets) / Current liabilities
The quick ratio is useful because it removes inventory, which may not convert to cash quickly.
A simple interpretation guide:
Metric
What it suggests
Working capital improving
Near-term flexibility may be strengthening
Working capital shrinking
Liquidity cushion may be tightening
Current ratio below comfort range
Short-term obligations may be pressuring the business
Quick ratio weak
Too much reliance on inventory or future collections
These are not universal pass-fail metrics. Industry, seasonality, and business model matter. Still, the monthly direction is highly informative.
Watch for shrinking cash reserves, rising payables, or slow collections
A potential cash crunch often shows a recognizable pattern:
cash reserves decline,
receivables age lengthens,
inventory remains high,
payables increase,
debt usage rises.
One signal alone may not be alarming. Several moving together usually are.
Examine accounts receivable, inventory, and accounts payable
These three balances often explain why cash pressure develops despite acceptable profits.
Identify overdue customer balances that delay cash coming in
Accounts receivable should be reviewed beyond the headline total.
Look at:
aging by customer,
concentration risk from large accounts,
disputed invoices,
average collection time,
recent deterioration in payment behavior.
A useful metric is Days Sales Outstanding (DSO), which estimates how long it takes to collect receivables. If DSO rises steadily, the business may be financing its customers.
Important owner questions include:
Which customers are consistently late?
Are payment terms too loose?
Are invoices being sent promptly and accurately?
Is collections follow-up disciplined?
Look for excess or slow-moving inventory tying up cash
Inventory can quietly absorb significant cash. High inventory may reflect preparedness, but it may also indicate overbuying, weak forecasting, obsolete items, or slowing sales.
Review:
turnover by product category,
slow-moving stock,
obsolete inventory,
seasonal stock build-up,
differences between accounting inventory and physical counts.
If inventory rises while sales do not, that is often a warning sign. Cash may be locked in stock that is not converting efficiently.
Make sure supplier payment timing is intentional, not reactive
Accounts payable deserves careful review because it can be either a management tool or a stress signal.
Healthy payable management means:
using agreed credit terms effectively,
preserving supplier relationships,
timing disbursements intentionally,
avoiding unnecessary early payment.
Unhealthy payable growth usually looks different:
chronic late payments,
supplier complaints,
tighter vendor terms,
reactive payment decisions based only on available cash.
A business that depends on delaying suppliers just to stay current may be closer to a cash squeeze than the income statement suggests.
Track debt, owner draws, and equity changes
Cash strain is not always operational. It can also come from financing and owner decisions.
Review upcoming loan obligations and interest burdens
Debt review should include:
current portion of long-term debt,
line of credit usage,
interest expense trend,
refinancing dates,
covenant requirements,
balloon payments or step-ups.
Questions to ask:
Can the business meet scheduled payments from operations?
Is short-term debt being used for long-term needs?
Is interest cost rising faster than earnings capacity?
Debt can support growth, but it also reduces flexibility when collections slow or margins tighten.
Monitor whether owner withdrawals are weakening the company’s cushion
In small businesses, owner draws and distributions can have a major impact on balance sheet strength.
Even profitable companies can become financially fragile if owner withdrawals:
outpace profits,
reduce working capital,
force greater borrowing,
leave insufficient reserves for taxes or slow periods.
A monthly review should compare owner withdrawals with actual profitability and cash generation, not just with short-term bank balances.
Confirm equity changes make sense relative to profits and distributions
Equity should move in a way that is consistent with the story of the business.
If equity is declining, possible causes include:
net losses,
excessive owner draws,
prior-period corrections,
debt-funded operations without retained profit support.
If equity is growing, confirm that it comes from real retained earnings or owner contributions rather than timing or classification issues.
5 things to know about your balance sheet analysis before making decisions
Before acting on a monthly review, keep these five principles in mind.
1. Cash on hand does not equal financial strength if liabilities are rising faster
A healthy bank balance can create false comfort. If payables, taxes due, short-term debt, and other obligations are growing faster, the apparent strength may be temporary.
The real question is not simply how much cash the business has today, but what claims already exist against that cash.
2. Profitability does not always mean the business is liquid
Accrual profit and cash availability are different. A company can report profit while struggling to pay bills if:
customers have not paid,
inventory has absorbed cash,
debt service is heavy,
prepaids or fixed asset purchases increased.
This is one of the most common reasons owners are surprised by cash strain.
3. Fast sales growth can increase cash pressure when receivables and inventory expand
Growth is often assumed to solve financial issues. In reality, growth can intensify them.
When sales rise quickly, the business may need to fund:
more receivables,
more inventory,
more payroll,
more delivery or fulfillment costs.
Without disciplined working capital management, rapid growth can create more pressure than stability.
4. Balance sheet trends matter more than one isolated month
One month may reflect timing noise. Three to six months often reveal the real story.
Trend analysis helps distinguish:
a normal seasonal build,
a temporary disruption,
a worsening collection issue,
a structural dependence on debt,
a recurring drain from owner distributions.
This is why monthly consistency matters more than occasional deep review.
5. Clean, accurate records are essential for useful analysis
No analysis is better than the underlying accounting records.
A disciplined monthly close should include:
bank and loan reconciliations,
receivable aging review,
payable reconciliation,
inventory adjustments where needed,
proper classification of debt and owner activity.
If the close process is weak, Balance Sheet Analysis will be unreliable. As reporting needs grow, standardized dashboards and exception alerts can improve visibility; in that context, FineReport may be useful for consolidating monthly financial views and supporting a more structured review workflow.
Turning review into action: a practical monthly balance sheet analysis for owners
The value of Balance Sheet Analysis lies in what happens next. A review should lead to clear actions, not just observations.
Build a simple review checklist and reporting routine
A repeatable routine reduces missed signals and improves decision quality.
Choose a consistent review date each month
Use the same timing every month, ideally after the books are closed and reconciled. Consistency improves comparability and reduces rushed interpretation.
For example:
close books by the 5th business day,
review financials by the 7th business day,
assign follow-up actions immediately afterward.
Use the same comparisons, ratios, and notes every time
A standardized format makes monthly review more efficient.
A practical checklist may include:
cash balance and 3-month trend,
current ratio and working capital,
receivables total and aging,
DSO trend,
inventory level and turnover concerns,
payables trend and overdue supplier balances,
debt balances and next 90-day obligations,
owner draws and equity movement,
unusual changes needing explanation.
Flag thresholds that trigger follow-up action
Predetermined thresholds help owners respond faster and more objectively.
Examples include:
Trigger
Follow-up action
Cash reserve falls below 30 days of operating expenses
Freeze discretionary spending and update cash forecast
Receivables over 60 days exceed target
Escalate collections and review customer credit terms
Inventory rises above planned range
Pause purchasing on slow-moving items
Payables age beyond supplier terms
Rebuild payment plan and contact key vendors
Debt service coverage tightens
Review refinancing or repayment restructuring options
This turns the balance sheet into a management tool rather than a static report.
Decide what to do when warning signs appear
A good review process also defines the operational response.
Speed up collections and tighten customer payment terms
When receivables are the issue, practical actions include:
invoicing immediately upon delivery or milestone completion,
following up on overdue balances on a set schedule,
requiring deposits or partial prepayment,
reducing credit exposure for chronically late customers,
offering prompt-payment incentives selectively.
The goal is not only to collect faster, but to reduce the chance that future sales create additional strain.
Reduce unnecessary inventory purchases or operating spend
If working capital is tightening, preserve cash where possible.
Possible actions:
slow reorder frequency,
reduce safety stock where justified,
clear obsolete inventory,
defer nonessential purchases,
pause low-return marketing or discretionary overhead.
The purpose is not broad cost cutting for its own sake, but targeted preservation of liquidity.
Rework debt payments or strengthen the cash reserve plan
When debt is pressuring cash flow, owners should evaluate:
extending amortization periods,
refinancing short-term obligations,
consolidating high-cost debt,
negotiating covenant flexibility early,
setting a minimum cash reserve policy.
The earlier these discussions happen, the more options typically remain available.
Conclusion
For small business owners, Balance Sheet Analysis is one of the most practical ways to prevent a cash crunch before it becomes a crisis. It reveals whether the company has enough liquidity, whether growth is consuming cash, whether debt is manageable, and whether owner decisions are strengthening or weakening the financial cushion.
A monthly review does not require complex modeling. It requires consistency, clean records, and attention to a few high-impact areas:
cash,
receivables,
inventory,
payables,
debt,
equity.
When reviewed together and compared over time, these balances tell the real story behind the business’s financial health. Owners who make this review part of their monthly routine are better positioned to act early, preserve flexibility, and make decisions from evidence rather than pressure.
FAQs
Focus on cash, accounts receivable, inventory, accounts payable, short-term debt, and owner equity. These areas usually reveal early signs of pressure before a cash shortage becomes obvious.
Profit does not always mean cash is available. Money can get tied up in unpaid customer invoices, excess inventory, debt payments, or owner draws.
The most common starting points are working capital, current ratio, quick ratio, and debt-to-equity. They help show whether the business can cover near-term obligations and how much leverage is building.
Slow collections keep cash locked in receivables, while rising inventory ties money up in stock that is not selling quickly enough. Both can weaken liquidity even when sales look healthy.
A monthly review is usually the best cadence for most small businesses. It gives owners enough frequency to spot trends early and make adjustments before cash pressure becomes urgent.
Product Trial
FineReport
Pixel-perfect reports · Interactive dashboards · Easy data entry · Digital twins
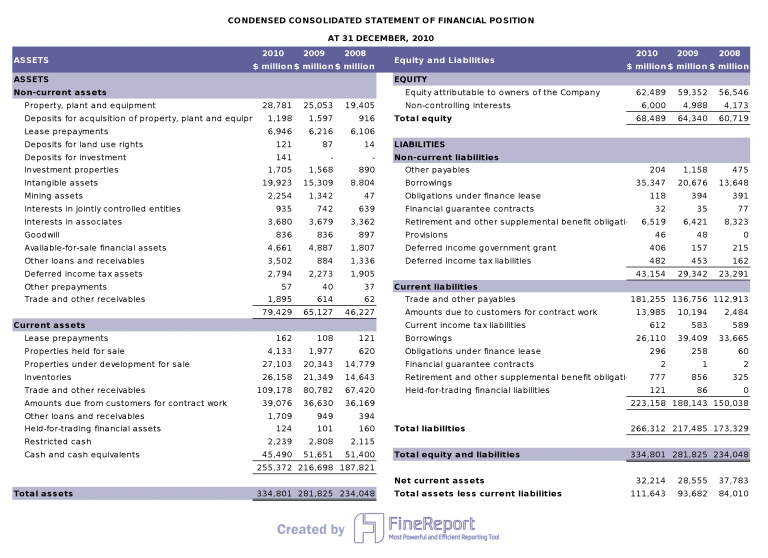 A Balance Sheet Created by


