A weekly report keeps your manager informed about progress, risks, and next steps without requiring a meeting. A clear format saves you time writing and saves your manager time reading. This guide provides a ready-to-use template, a complete example you can send today, KPI guidance, writing tips, and how to automate the process when manual reporting no longer scales.
What Is a Weekly Report?
A weekly report is a structured update that summarizes what you accomplished, what metrics changed, what problems emerged, and what you plan to do next. It serves three purposes:
Accountability: Documents progress against goals and commitments.
Visibility: Surfaces risks and blockers before they escalate.
Alignment: Ensures your manager and team share the same understanding of priorities and status.
Weekly reports differ from monthly reports in scope and cadence. Monthly reports summarize trends and strategic outcomes; weekly reports focus on tactical execution and immediate next steps. Both are essential layers of management reporting, but confusing the two leads to either too much detail or too little.
Use this template as your starting point. Adapt section names and depth to match your team's expectations, but keep the logical flow consistent:
Section
What to Include
Example
Summary
Main progress and overall status
Completed 85% of the Q2 dashboard rollout
Key achievements
Important wins this week
Finished sales data integration and validated KPI logic
KPI update
Numbers that show progress
Revenue, conversion rate, delivery progress, open issues
Risks and blockers
Problems that need attention
Data from one region is delayed
Next week plan
Planned actions
Complete testing and prepare manager review
Support needed
Decisions or resources required
Confirm dashboard access for regional managers
This six-section structure covers everything a manager needs to know in under two minutes of reading. If your organization requires additional sections (e.g., budget status, team capacity), add them after "KPI update" and before "Risks and blockers" to maintain the narrative arc: what happened → what it means → what could go wrong → what comes next.
Get More Free Ready-to-use Templates in Fine Gallery
Weekly Report Example to Send Your Manager
Below is a complete, copy-ready example formatted as an email. Adapt the project name, metrics, and details to your situation:
Subject: Weekly Report – Sales Dashboard Project
Hi [Manager Name],
Here is this week's progress update.
Summary: The sales dashboard project is on track. We completed data validation for three regions and prepared the first version of the KPI overview.
Key achievements:
Connected sales and customer data sources.
Validated revenue and conversion metrics.
Built the first dashboard layout for regional managers.
KPI update:
Data sources connected: 3/4 (75%)
Metrics validated: 12/15 (80%)
Open issues: 2 (down from 5 last week)
Risks: The APAC data source is still delayed, which may affect next week's testing timeline.
Next week: We will complete APAC data validation, refine the dashboard layout, and prepare the review version for stakeholder feedback.
Support needed: Please confirm whether regional managers should receive weekly automated dashboard summaries, and if so, which KPIs they should see by default.
Thanks, [Your Name]
This example works because it is scannable, specific, and action-oriented. Every section contains concrete information rather than vague statements like "made good progress" or "working on it." For more complex projects, attach supporting dashboards or spreadsheets rather than expanding the email body.
Beyond the template structure, these principles determine whether your report is useful or ignored:
Lead with status, not activity: Your manager cares about outcomes, not hours spent. "Completed data validation for 3 regions" is better than "Spent 20 hours on data validation."
Quantify whenever possible: Replace "improved performance" with "reduced page load time from 4.2s to 2.8s." Numbers are unambiguous and comparable across weeks.
Name risks explicitly: Hidden risks become crises. State what could go wrong, how likely it is, and what mitigation is in place or needed.
Specify asks clearly: "Need feedback" is vague. "Please approve the revised KPI definitions by Friday EOD so we can proceed with UAT" is actionable.
Keep it concise: Aim for 300–500 words in the body. Attachments handle detail; the report handles decisions and awareness.
Maintain consistent formatting: Use the same template every week. Consistency reduces cognitive load for both writer and reader.
Weekly Report KPIs and Metrics
The right KPIs depend on your role and project, but effective weekly KPIs share three traits: they are measurable, tied to a goal, and comparable over time.
KPI Category
Example Metrics
What They Signal
Progress
% milestones completed, tasks closed vs. planned
Whether the project is on schedule
Quality
Defect count, validation pass rate, error rate
Whether deliverables meet standards
Efficiency
Cycle time, resource utilization, backlog size
Whether the team is working sustainably
Risk
Open issues, blocker age, dependency delays
Whether problems are growing or shrinking
Business impact
Revenue, conversion rate, customer satisfaction
Whether work is translating to outcomes
Avoid vanity metrics that look impressive but do not inform decisions. If a KPI would not change any action when it moves up or down, remove it from the weekly report. For teams building dashboards to track these metrics continuously, self-service BI dashboards allow business users to monitor KPIs without waiting for IT-generated reports.
Weekly Report Writing Tips
Write the summary last: You cannot accurately summarize until you have documented achievements, KPIs, and risks. Draft the body first, then distill.
Use bullet points, not paragraphs: Managers scan reports; they do not read them. Bullets make scanning possible.
Separate facts from interpretation: State what happened, then state what it means. Mixing the two makes it hard to distinguish evidence from opinion.
Link to source data: When referencing a metric, link to the dashboard or spreadsheet where it lives. This builds trust and saves follow-up questions.
Review before sending: Check for accuracy, completeness, and tone. A report with errors undermines the credibility of the content.
Schedule writing time: Block 15–30 minutes at the same time each week. Procrastinated reports are rushed reports.
Solicit feedback periodically: Ask your manager quarterly whether the format still serves their needs. Requirements evolve; your template should too.
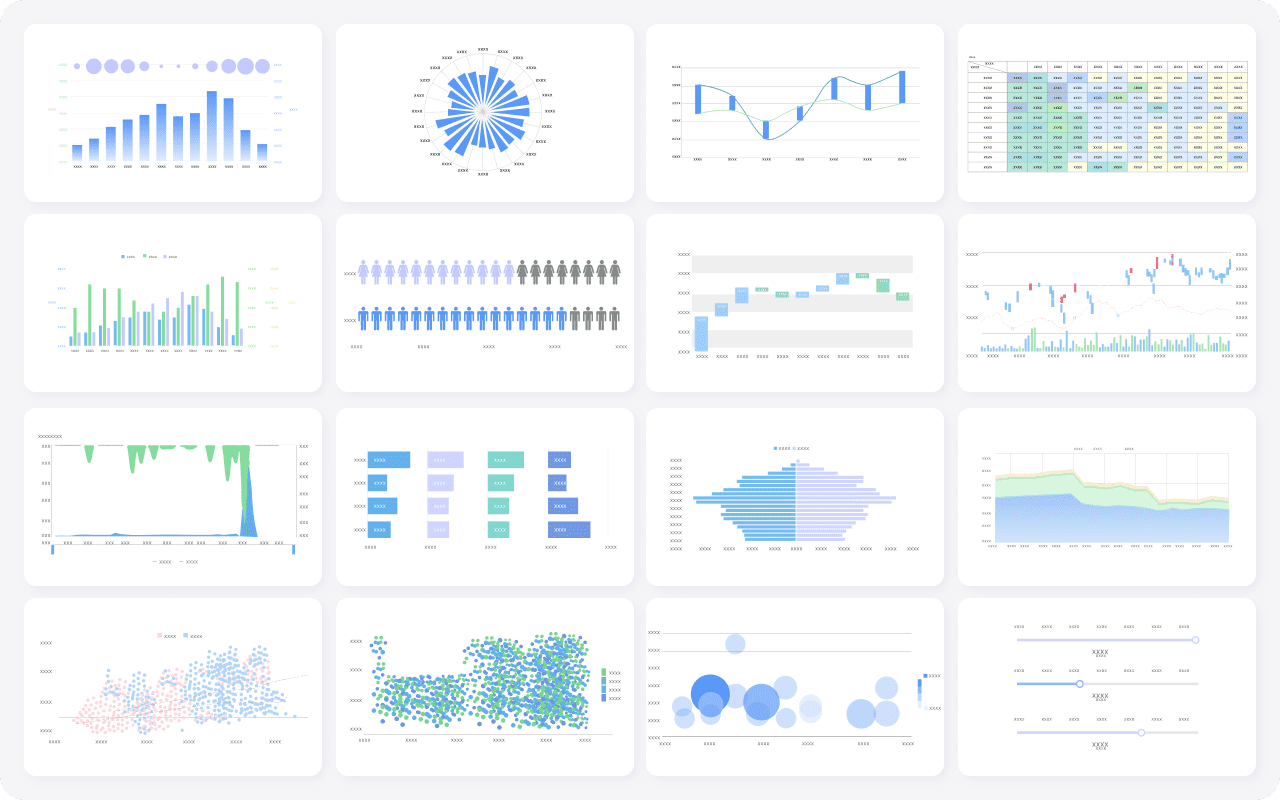
FineReport's Multiple Charts For Data Visualization
For teams exploring dedicated tools beyond manual document creation, our comparison of report generation tools covers options across the automation spectrum.
From Manual Weekly Reports to Automated Reporting
Manual weekly reports work when you have one project, one audience, and simple metrics. They break down when:
You manage multiple projects or teams and spend hours each week collecting updates.
Data lives in multiple systems (CRM, ERP, project management, finance) and must be manually consolidated.
Different stakeholders need different views of the same underlying data.
Report quality varies depending on who writes it and how much time they had.
Automated reporting software like FineReport addresses these problems by connecting directly to source systems via data integration, applying standardized templates, scheduling recurring delivery, and enforcing consistent formatting and permissions. The weekly report shifts from a writing task to a configuration task: define the data sources, design the template once, and let the system generate and distribute it on schedule.
Automation does not eliminate the need for human judgment. Risks, context, and forward-looking plans still require input. But it eliminates the repetitive collection and formatting work that consumes most of the time spent on manual weekly reports.
How Dora Automates Weekly Briefings and Management Reports
A weekly report format helps teams organize progress, KPIs, risks, and next steps. But when the same report must be created every week, manual writing becomes slow and inconsistent.
Dora, FanRuan's enterprise Data Agent, can work on top of trusted FineBI and FineReport assets to generate scheduled briefings, retrieve dashboard data, summarize KPI changes, detect anomalies, and push follow-up tasks to the right owners. Instead of manually collecting screenshots and rewriting the same report, teams can use Dora to turn governed BI assets into weekly management-ready summaries.
Manual weekly report
FineReport automated report
Dora weekly briefing
Manually collect updates
Pull data from governed sources
Generate narrative summaries from BI assets
Copy charts into documents
Schedule recurring reports
Explain KPI changes in natural language
Write risks by hand
Standardize report templates
Detect anomalies and push alerts
Send emails manually
Deliver reports automatically
Send owner-specific briefings and follow-ups
Example Dora prompt: "Generate this week's sales performance briefing for each regional manager, including revenue, target achievement, top risks, and next actions."
Dora works best when the underlying data infrastructure is already in place. FineDataLink ensures clean, integrated source data; FineBI and FineReport provide governed dashboards and report templates; Dora adds the AI layer that converts those assets into natural-language briefings and proactive insights. Without that foundation, AI-generated summaries risk hallucinating on unreliable data.
Real-time insights to optimize production, logistics, and decisions.
FAQ
How do you write a weekly report format that impresses your boss every time?
You start by using clear templates. Section your reports for easy reading. Focus on updates, completion, and good report structure. Use a step-by-step guide for each update.
What should you include in a weekly report format that impresses your boss every time?
Always include weekly updates, progress toward completion, and key updates. Good report templates help you track updates, highlight completion, and show your boss clear updates.
Can I use a weekly sales business template or a weekly project status report for my updates?
Yes, you can use these templates for your updates. They help you write a report, track completion, and deliver good report updates every week.