
If you are searching for an alternative to Supermetrics, you are probably trying to solve one of a few practical problems: rising reporting costs, limited connector flexibility, slower-than-expected refresh workflows, or the need to move beyond spreadsheet-based marketing reporting.
For agencies, in-house marketers, ecommerce teams, and analysts, Supermetrics is still a well-known option for pulling marketing data into tools like Google Sheets, Looker Studio, and BI platforms. But in 2026, the market has matured. Teams now expect more than simple connector-based extraction. They want better control over data destinations, cleaner transformation workflows, stronger governance, and increasingly, AI-assisted analytics and dashboard creation.
This guide compares the best Supermetrics alternatives for 2026 by pricing logic, connector breadth, ease of setup, destinations, scalability, and use case fit so you can choose a platform that matches your reporting stack without switching twice.
Quick Comparison Table
| Tool | Best for | Ease of use | Data destinations | Transformation depth | BI/dashboarding fit | Learning curve | Recommended users |
|---|---|---|---|---|---|---|---|
| FineBI | Teams that want self-service BI after marketing data is centralized | High | BI platform, enterprise data sources | Moderate to strong for analysis workflows | Strong | Low to moderate | Business users, analysts, operations, marketing teams |
| Funnel | Enterprise marketing reporting | Moderate | Warehouses, BI tools, dashboards | Strong | Strong | Moderate | Large brands, agencies, multi-source reporting teams |
| Porter | Simple marketer reporting | High | Looker Studio, Sheets | Light | Moderate | Low | SMB marketers, freelancers, small agencies |
| Windsor.ai | Attribution-focused marketing teams | Moderate | Sheets, BI tools, warehouses | Moderate | Moderate to strong | Moderate | Performance marketers, ecommerce teams |
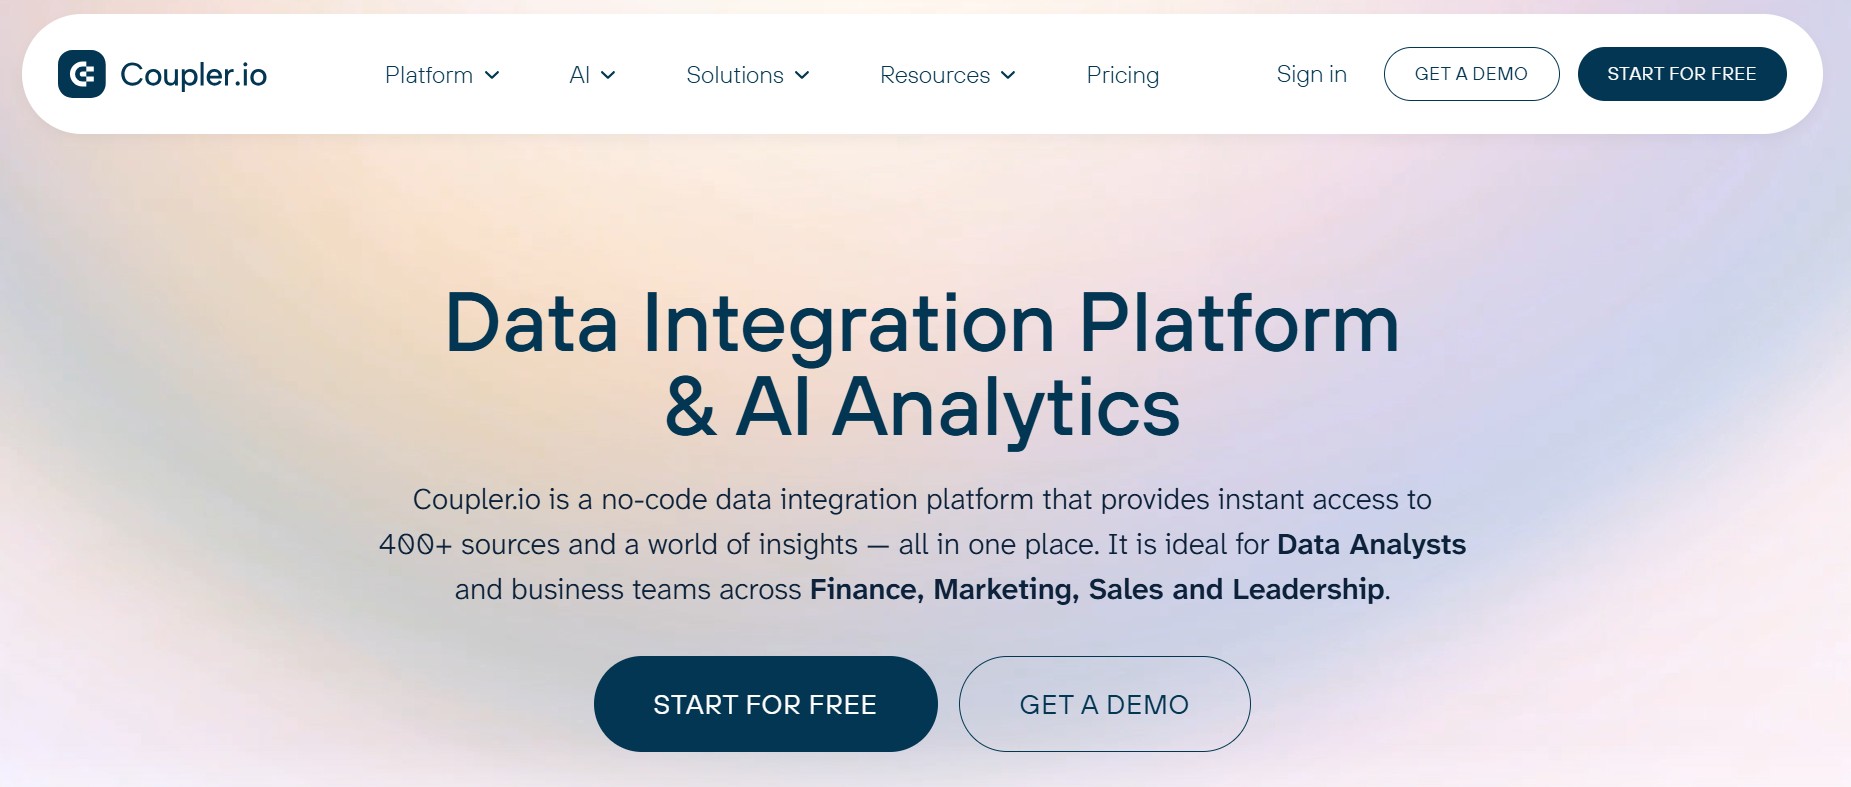
| Coupler.io | No-code imports and lightweight automation | High | Sheets, Excel, BI tools, warehouses | Light to moderate | Moderate | Low | Small teams, analysts, spreadsheet-heavy users |
| Adverity | Enterprise governance and standardization | Moderate | Warehouses, BI tools | Strong | Strong | Higher | Enterprises, data teams, governed marketing orgs |
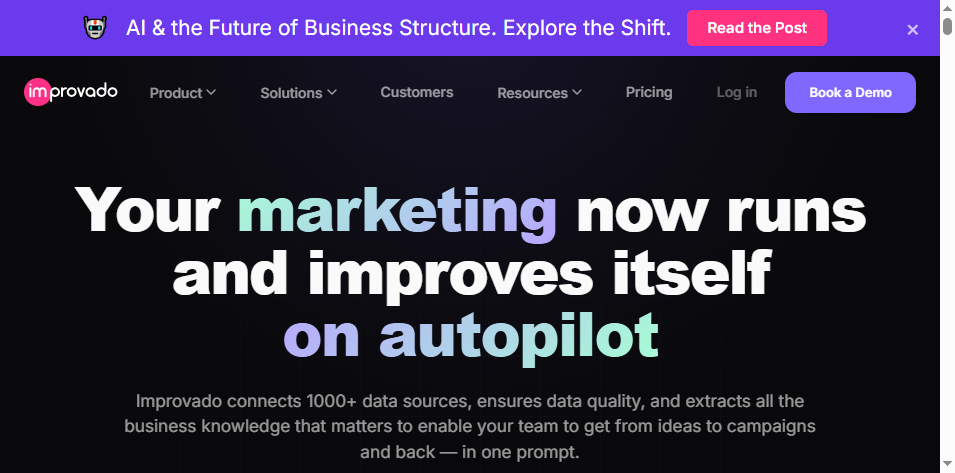
| Improvado | Enterprise marketing intelligence | Moderate | Warehouses, BI tools, reporting environments | Strong | Strong | Higher | Large marketing organizations |
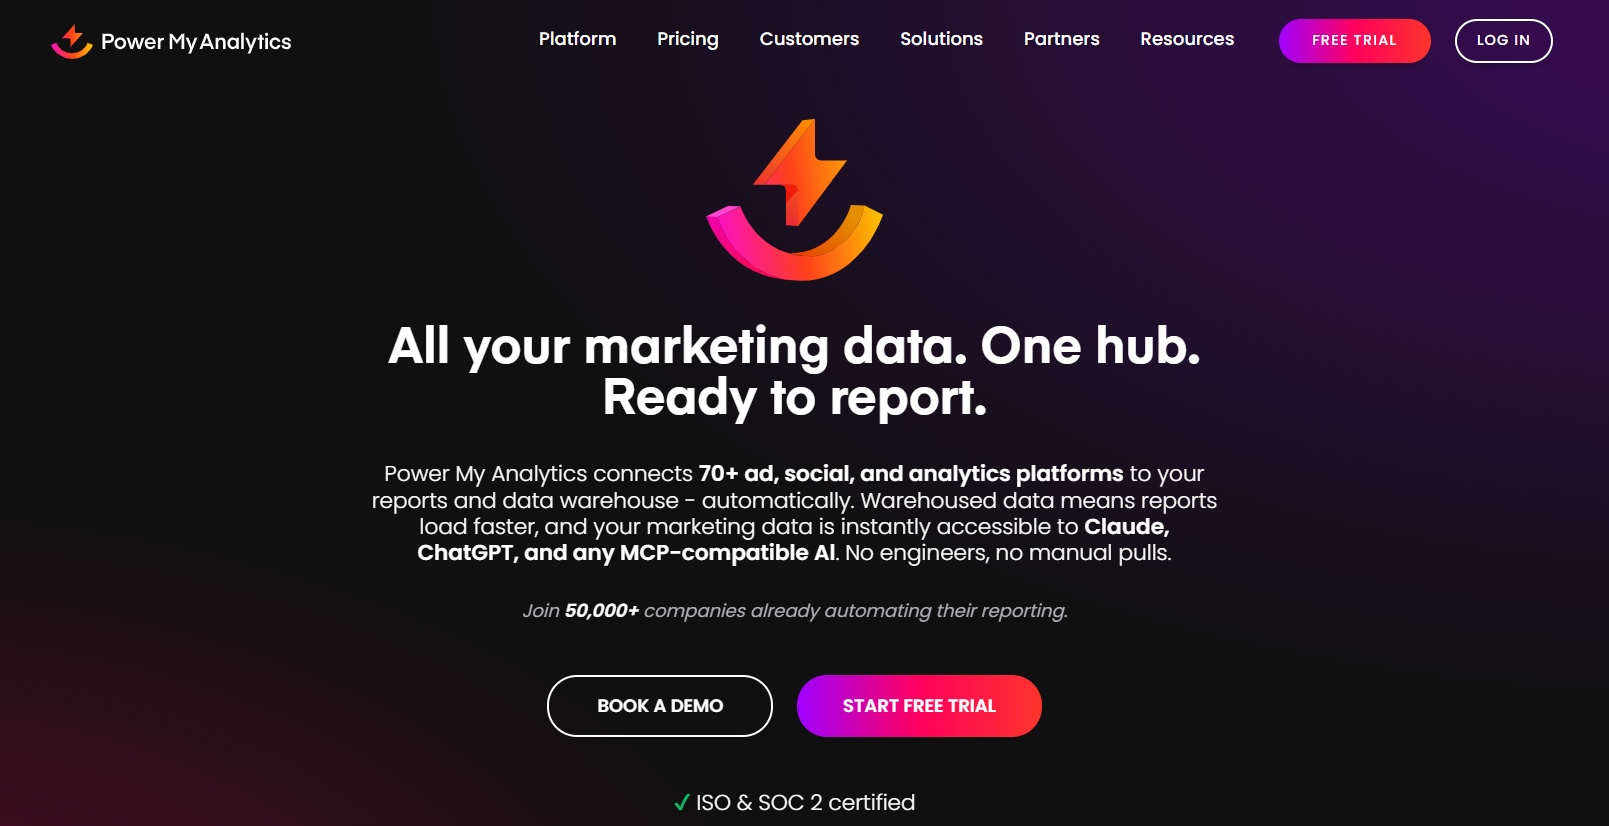
| Power My Analytics | Predictable SMB reporting workflows | High | Spreadsheets and dashboards | Light | Moderate | Low | Agencies and SMB teams |
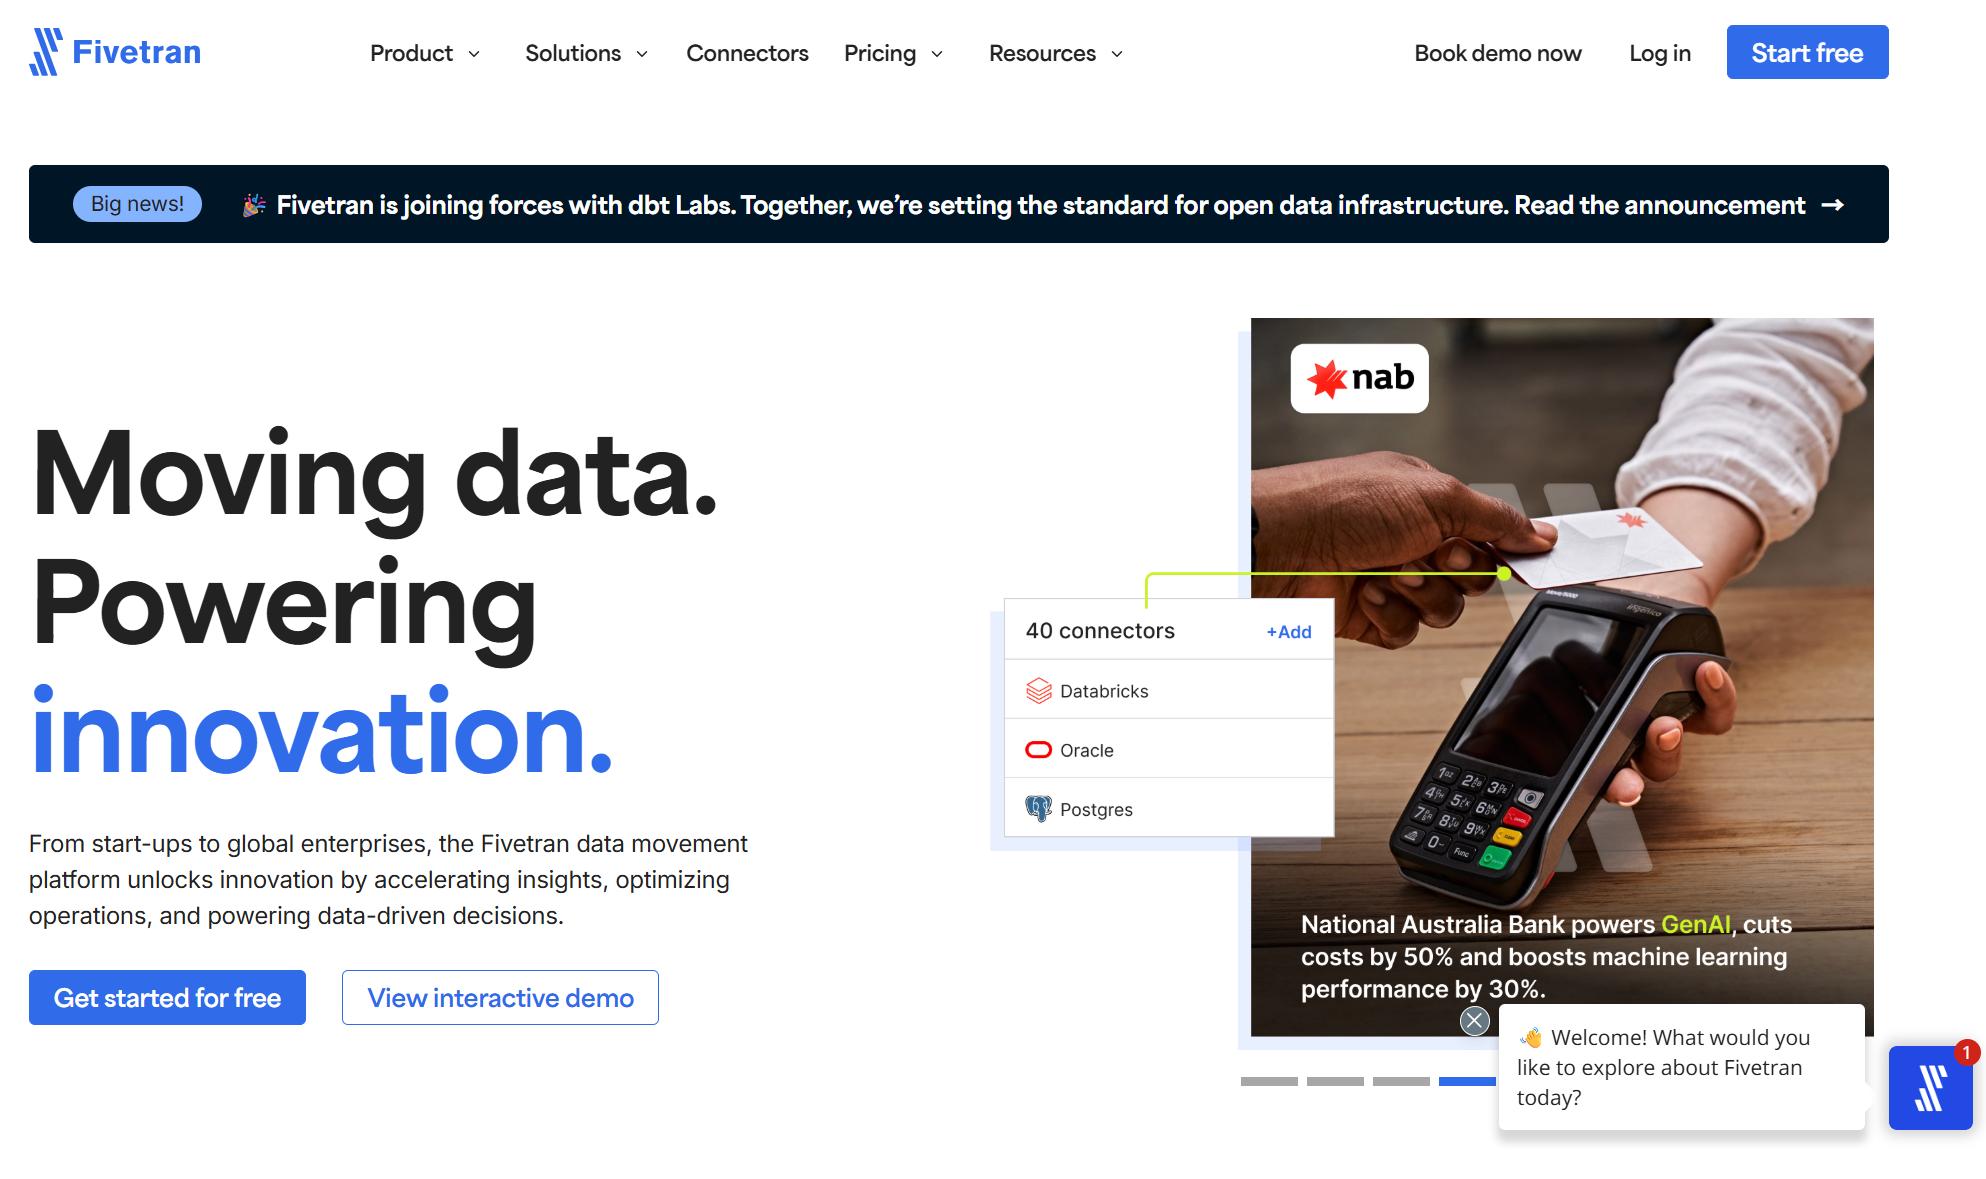
| Fivetran | Warehouse-first ELT | Moderate | Warehouses, lakes, databases | Strong with warehouse modeling | Limited native reporting focus | Moderate to high | Technical data teams |
| Airbyte | Open-source flexibility | Moderate | Warehouses, databases, custom stacks | Flexible but technical | Limited native reporting focus | High | Engineering-led teams |
| Dataslayer | Spreadsheet and PPC reporting | High | Sheets, dashboards | Light | Moderate | Low | Agencies, advertisers, PPC teams |
Why look for an alternative to Supermetrics in 2026?
Many teams do not replace Supermetrics because it is unusable. They replace it because their reporting needs outgrow a connector-first approach.
Common reasons teams switch: pricing changes, connector limits, refresh frequency, governance needs, and support expectations
Here are the most common triggers behind the search for a better option:
- Pricing complexity: costs can increase as you add destinations, accounts, connectors, or advanced workflows
- Connector fit: a tool may cover major ad platforms but still miss niche channels, ecommerce systems, or warehouse-friendly outputs
- Refresh expectations: some teams need more frequent or more dependable updates for operational reporting
- Governance requirements: larger organizations need permission controls, standardized metrics, and auditable workflows
- Support expectations: when reporting pipelines break, response quality matters as much as features
For small teams, the concern is usually value. For larger teams, it is often scalability and operational reliability.
What has changed in 2026: more ETL options, warehouse-first reporting, and AI-assisted dashboard workflows
The BI and marketing analytics stack in 2026 looks different from even a few years ago:
- More tools now support multi-destination delivery
- Warehouse-first reporting is more common for advanced attribution and blended performance analysis
- AI is increasingly used to help users explore metrics, build dashboards, summarize trends, and answer business questions faster
- Teams expect business users, not just technical specialists, to participate in analytics workflows
This shift matters because many organizations no longer want just a connector. They want a workflow that goes from raw campaign data to analysis-ready dashboards and decisions.
Who this comparison is for: agencies, in-house marketers, analysts, and ecommerce teams
This guide is especially relevant if you are one of these groups:
- Agencies managing multiple accounts and recurring client reports
- In-house marketing teams blending paid media, web, CRM, and ecommerce performance
- Analysts building repeatable reporting pipelines across tools
- Ecommerce teams tracking blended ROAS, product performance, and channel contribution
How we compared the best options
A good alternative to Supermetrics is not just the cheapest tool or the one with the biggest connector list. The right choice depends on your workflow.
Comparison criteria: pricing model, connector coverage, ease of setup, data freshness, destinations, and scalability
We used these practical criteria:
- Pricing model: flat-rate, usage-based, destination-based, or quote-based
- Connector coverage: depth across ad platforms, analytics, ecommerce, CRM, and supporting sources
- Ease of setup: whether marketers can use it independently or whether technical support is needed
- Data freshness: scheduled updates, frequency options, and operational reliability
- Destinations: spreadsheets, BI tools, warehouses, databases, and downstream analytics environments
- Scalability: whether the tool still works well as accounts, users, reports, and governance needs expand
Evaluation lens by use case: spreadsheet reporting, BI dashboards, data warehouses, and agency client reporting
Different categories solve different problems:
- Spreadsheet reporting tools are useful for quick wins and low-maintenance reporting
- BI-friendly tools matter when you need dashboards, drill-down, and self-service analysis
- Warehouse-first tools are best when modeling, governance, and data engineering are central
- Agency reporting tools need template speed, multi-account handling, and client-friendly outputs
What “better value” means for different team sizes and reporting maturity
“Better value” changes depending on the team:
- For a small team, it may mean affordable plans and fast setup
- For a growing marketing team, it may mean easier cross-channel analysis and fewer manual fixes
- For a larger organization, it may mean governance, consistency, and lower long-term maintenance
In other words, a low monthly starting price does not automatically mean lower total cost of ownership.
11 best Supermetrics alternatives for 2026 compared
1) FineBI
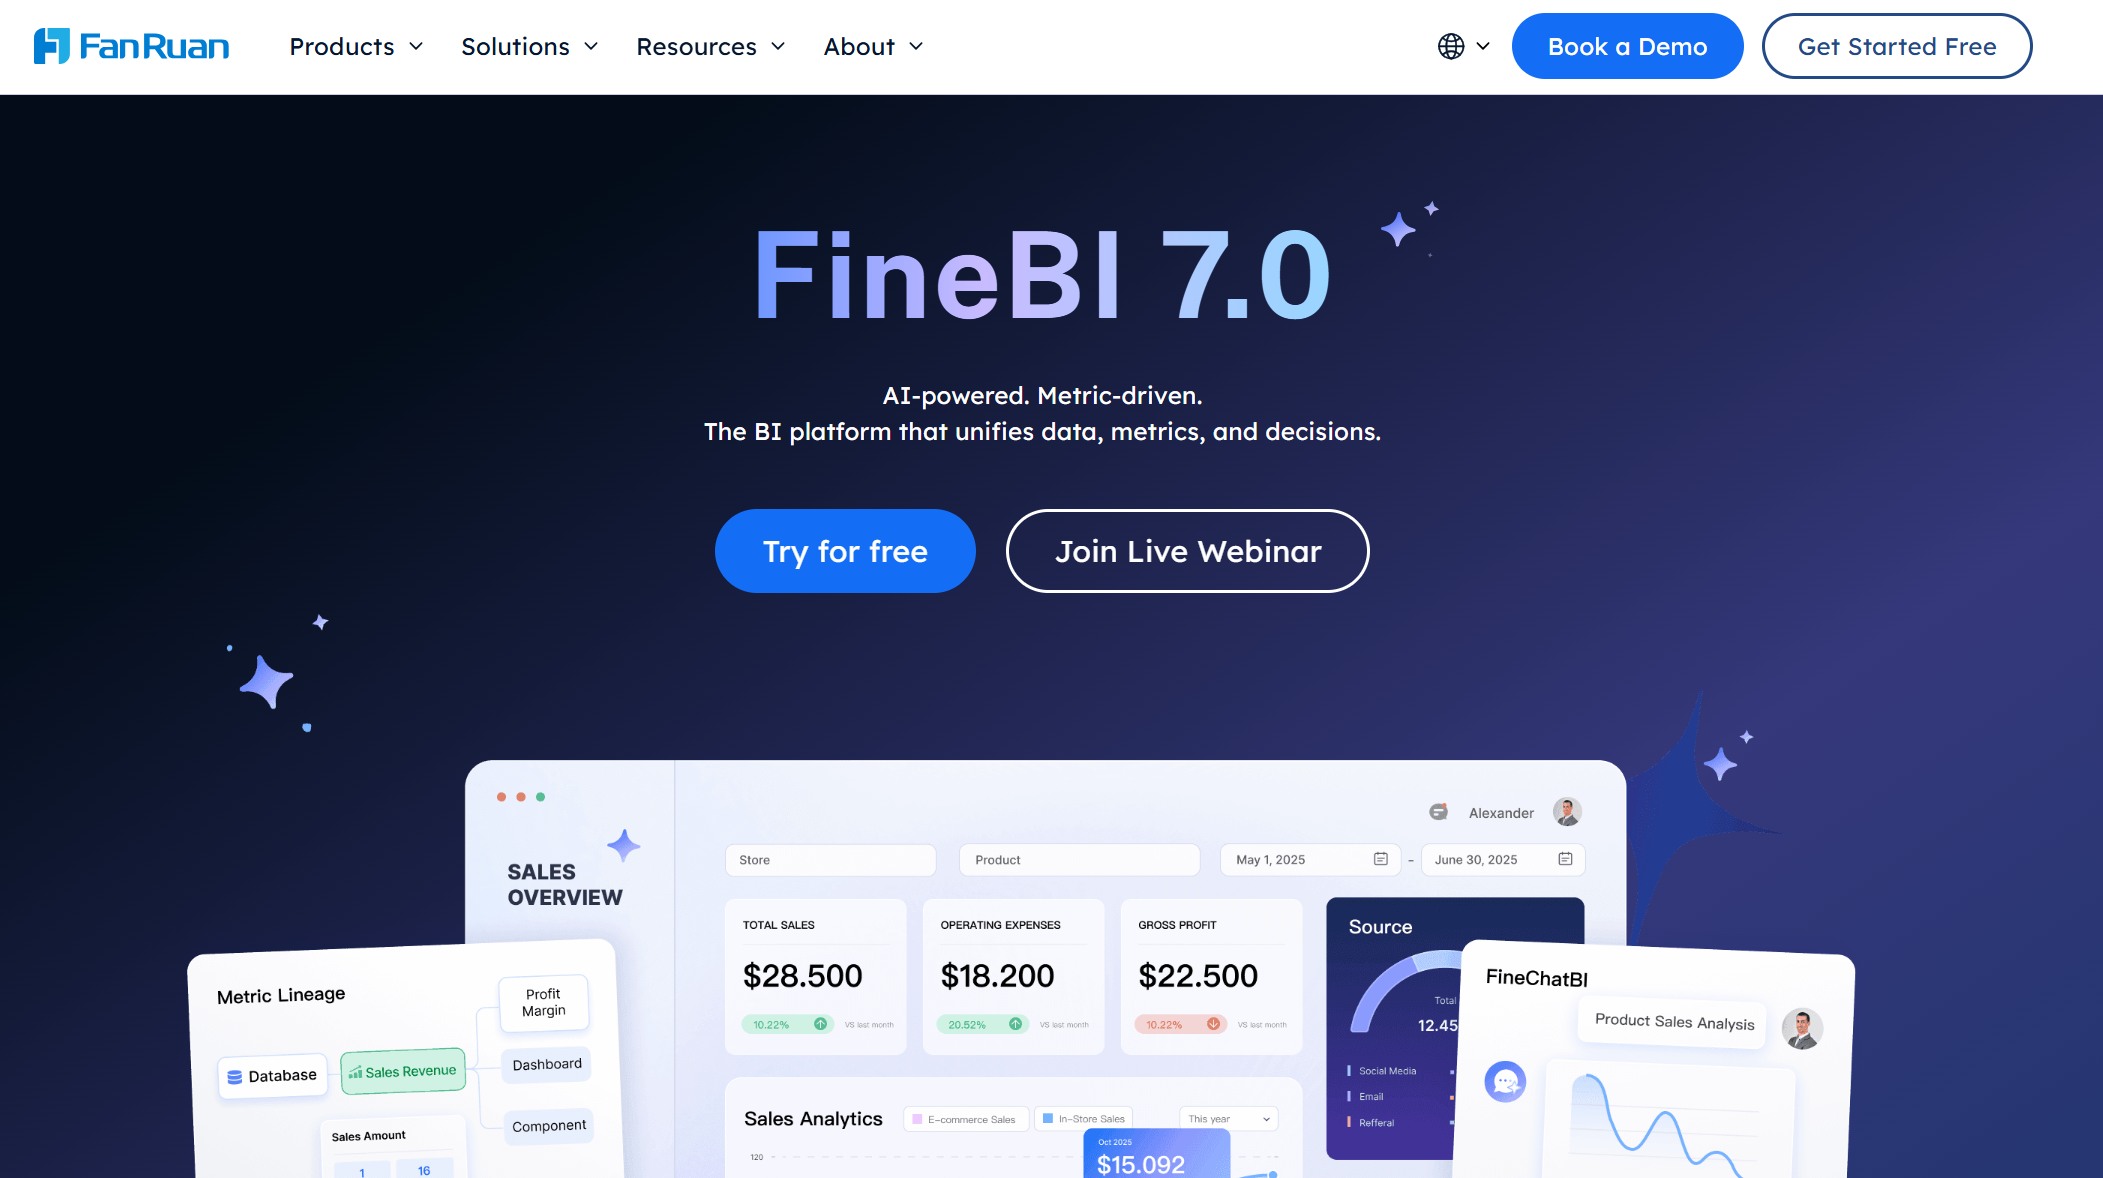 Website: https://www.fanruan.com/en/finebi
Best for: teams that need a more business-user-friendly path from centralized marketing data to interactive self-service dashboards and AI-assisted analysis
FineBI is not a direct one-to-one replacement for a marketing connector tool in the same way as Funnel or Coupler.io. Instead, it becomes highly relevant when your real problem is no longer just extracting data, but turning marketing and business data into dashboards that non-technical teams can actually use.
For organizations already collecting data from multiple platforms, FineBI provides a self-service BI environment for:
- Interactive dashboard creation
- Drag-and-drop visual analysis
- Drill-down exploration
- Team-wide dashboard sharing
- Enterprise data connectivity
- Faster iteration for business reporting needs
What makes FineBI especially relevant as a Supermetrics alternative is that many teams eventually discover the connector is only one part of the problem. The harder part is enabling marketers, operations leaders, and analysts to explore performance without depending on technical teams for every dashboard revision.
When paired with Dora, FineBI also adds an AI-powered layer for analytics workflows. That means teams can move from static dashboard consumption toward more conversational and guided analysis, such as:
- Asking questions about KPI changes in natural language
- Speeding up insight discovery from dashboards
- Helping business users interpret trends more quickly
- Supporting more accessible analytics across non-technical teams
This makes FineBI + Dora a practical option for companies that want not only data access, but also broader business adoption of BI.
Tradeoffs: FineBI is strongest when your challenge includes BI adoption, self-service dashboards, and multi-team analytics. If you only need a lightweight connector for pushing one ad platform into a spreadsheet, a simpler ETL tool may be enough.
2) Funnel
 Website: https://funnel.io/
Best for: enterprises and multi-source marketing reporting
Funnel is commonly chosen by organizations that need to consolidate marketing data from many channels and standardize reporting across teams or regions.
Strengths:
- Broad connector library
- Strong support for multi-source reporting
- Flexible outputs into BI and warehouse environments
- Helpful for teams that want a more centralized marketing data hub
Tradeoffs:
- Higher price point for smaller teams
- Onboarding can feel heavier than lighter reporting tools
- Better fit for teams with more mature reporting processes
Funnel is often a good fit for larger brands and agencies that want to move beyond fragile spreadsheet workflows.
3) Porter
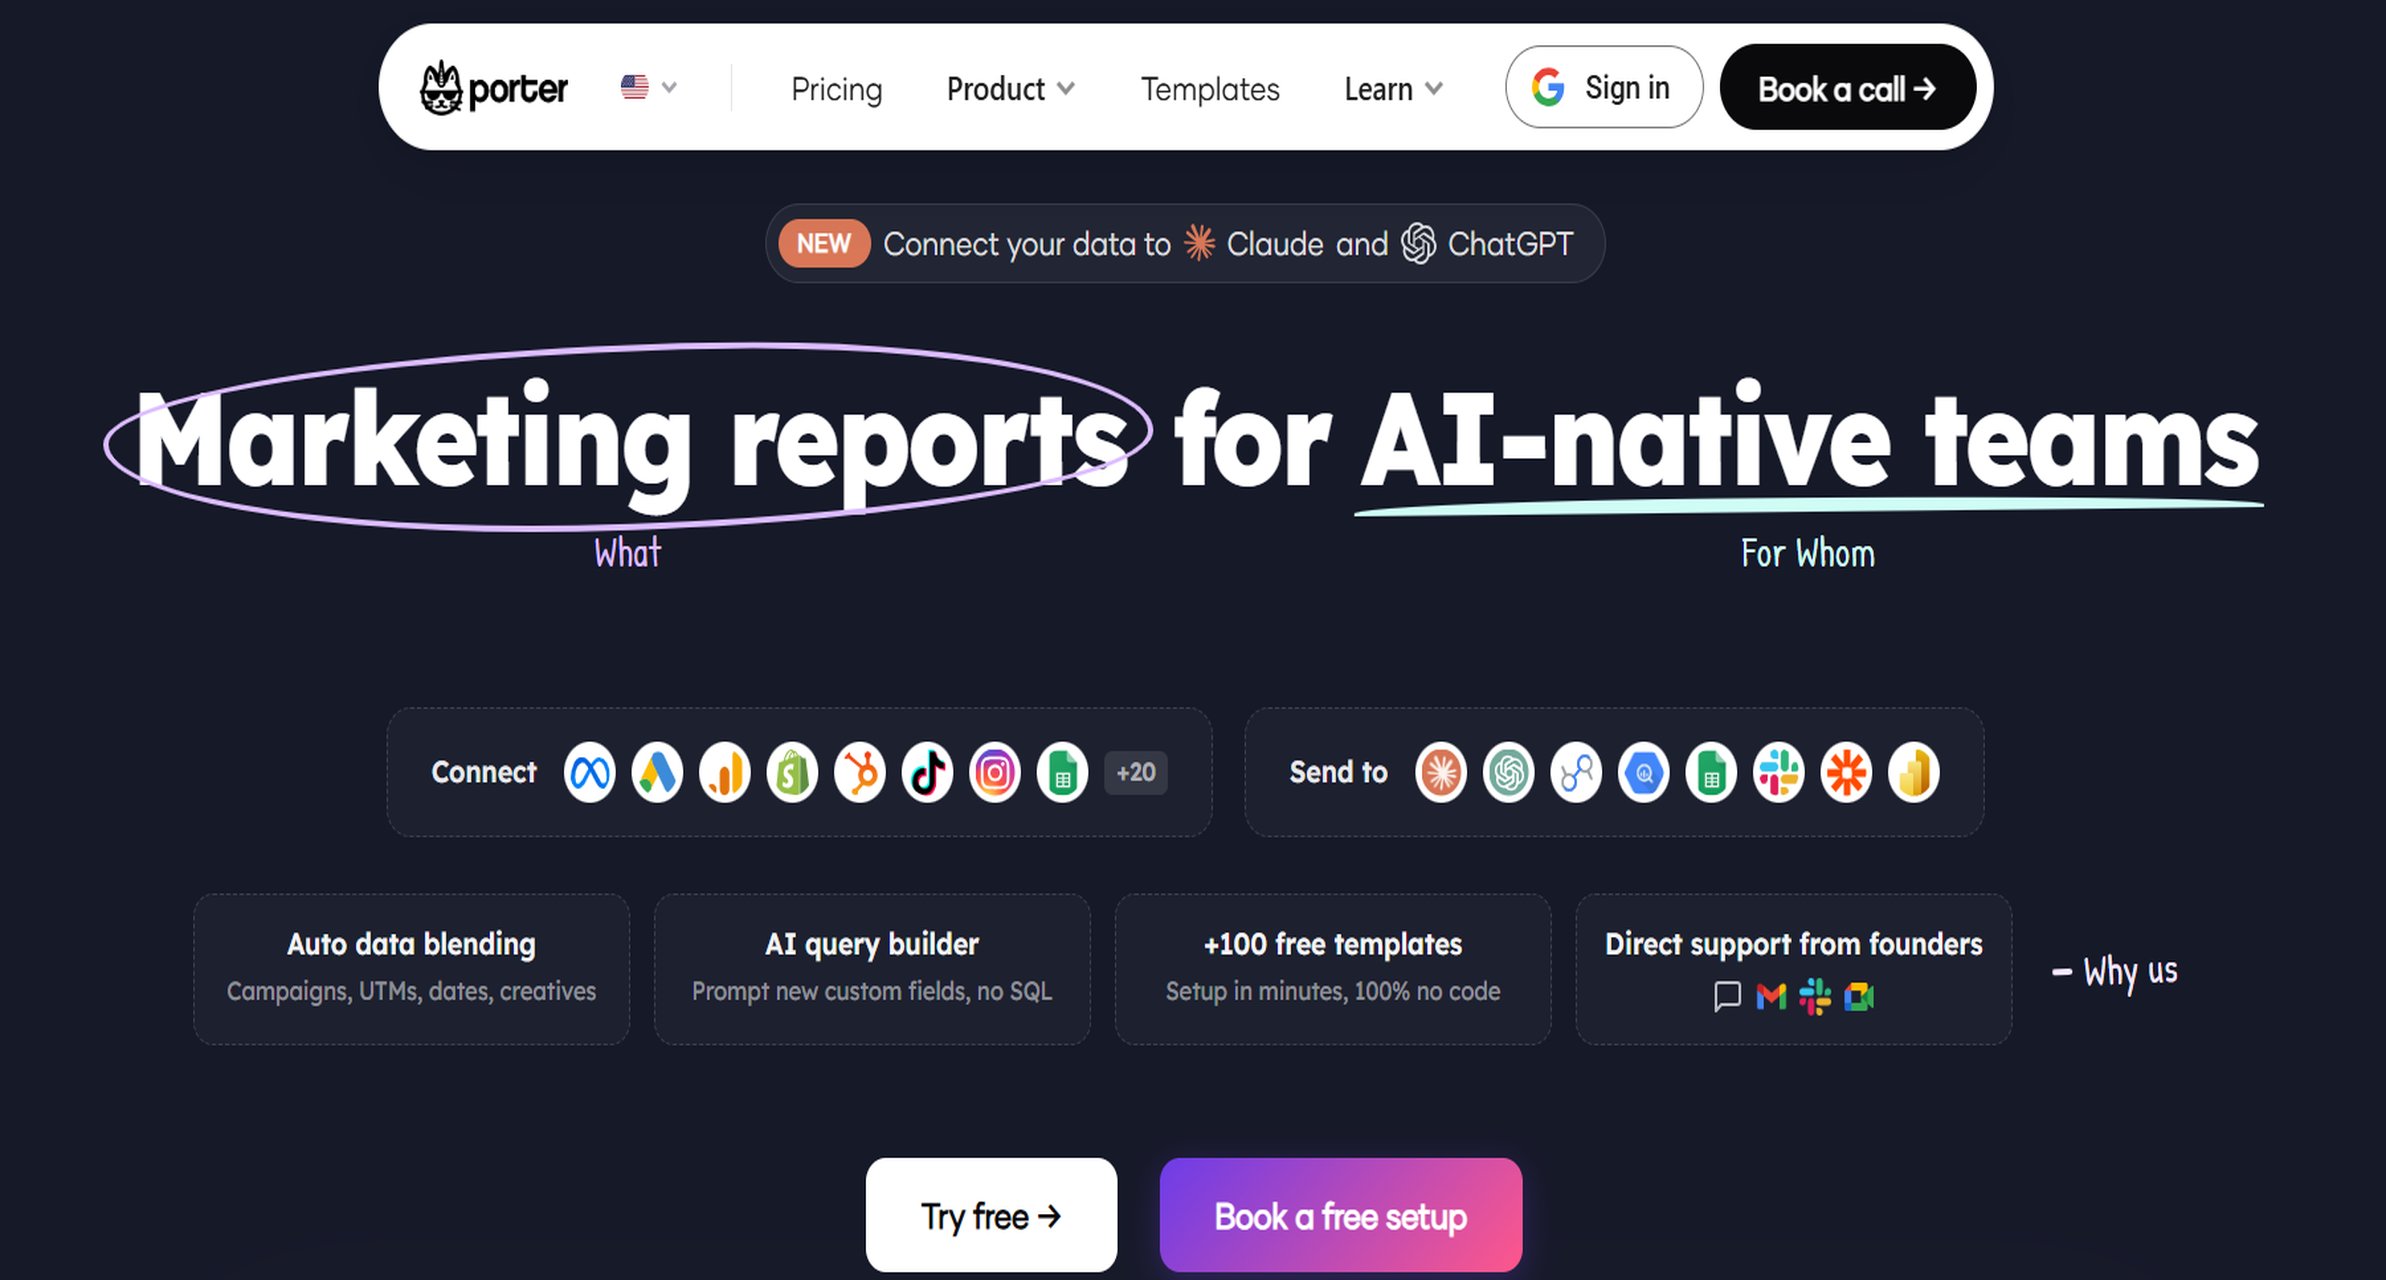 Website: https://portermetrics.com/en/home/
Best for: marketers who want simple reporting in Looker Studio and spreadsheets
Porter is aimed at users who want quick setup and practical templates without dealing with a technical implementation.
Strengths:
- Easy to use
- Accessible pricing
- Template-friendly for recurring marketing reports
- Useful for Looker Studio and spreadsheet workflows
Tradeoffs:
- Less depth for advanced transformation needs
- Narrower fit for warehouse-heavy architectures
- Better for simple reporting than enterprise governance
For freelancers, small agencies, and startup marketers, Porter can be a practical, low-friction option.
4) Windsor.ai
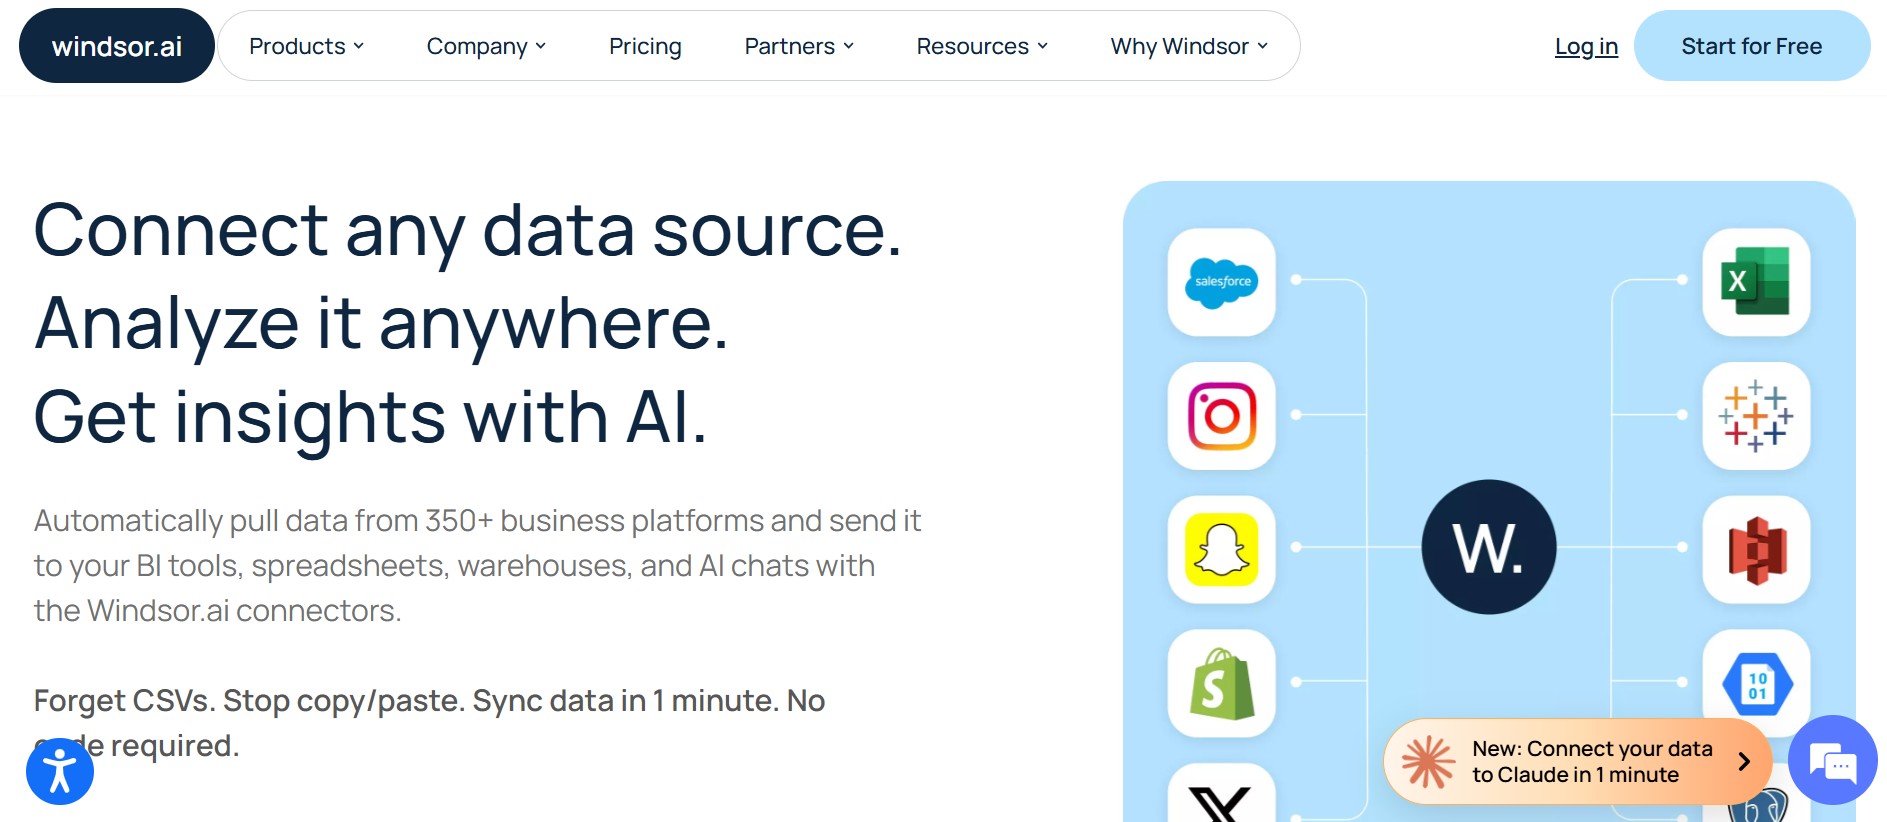 Website: https://windsor.ai/
Best for: performance marketers needing attribution and broad ad-platform coverage
Windsor.ai is often considered by teams that care about both connector breadth and attribution-oriented workflows.
Strengths:
- Broad ad-platform connector coverage
- Attribution support
- Flexible destinations across BI and warehouse tools
- Useful for cross-channel performance teams
Tradeoffs:
- User experience may vary depending on plan and workflow complexity
- Advanced needs may require more hands-on management
- Support expectations can differ by subscription level
For ecommerce and paid media teams, Windsor.ai is often attractive when attribution depth matters more than simple spreadsheet export.
5) Coupler.io
 Website: https://www.coupler.io/
Best for: no-code data imports into Sheets, Excel, and BI tools
Coupler.io is a straightforward option for automating data imports without building a heavy analytics stack.
Strengths:
- No-code setup
- Affordable plans for many teams
- Fast deployment
- Useful across spreadsheets, lightweight BI, and simple warehouse workflows
Tradeoffs:
- Fewer advanced governance capabilities
- Lighter transformation depth than enterprise data platforms
- Better for operational automation than full-scale marketing intelligence
This makes Coupler.io a good match for lean teams that want dependable automation without much complexity.
6) Adverity
 Website: https://www.adverity.com/
Best for: large organizations that need data governance and transformation at scale
Adverity is designed for teams where governance, standardization, and data quality controls are serious priorities.
Strengths:
- Enterprise-focused transformation and standardization
- Strong governance controls
- Extensibility for large-scale environments
- Suitable for organizations with complex data rules
Tradeoffs:
- Premium pricing
- Longer implementation cycles
- Often requires more technical coordination
Adverity is usually not the first choice for small teams, but it can be a sensible option for large organizations with formal analytics structures.
7) Improvado
 Website: https://improvado.io/
Best for: enterprise marketing intelligence and cross-channel normalization
Improvado is commonly positioned for organizations that need broad marketing data ingestion plus normalization across channels.
Strengths:
- Extensive connector support
- Strong transformation layer
- Managed-service style options
- Enterprise marketing intelligence orientation
Tradeoffs:
- Can be more platform than smaller teams need
- Implementation may be heavier than simple reporting tools
- Better suited to mature analytics organizations
If your reporting environment involves many brands, channels, and custom definitions, Improvado may be worth evaluating.
8) Power My Analytics
 Website: https://www.powermyanalytics.com/
Best for: agencies and SMBs focused on predictable reporting workflows
Power My Analytics is often used by agencies and smaller teams that want familiar spreadsheet and dashboard integrations.
Strengths:
- Easy to understand
- Familiar workflow style
- Good fit for repeatable client reporting
- Practical for teams that do not need heavy transformation
Tradeoffs:
- Less customizable for complex architectures
- More limited for advanced governance or warehouse-centric use cases
- Best when requirements are stable and relatively simple
For agency teams that prioritize repeatability over complexity, this can be a workable option.
9) Fivetran
 Website: https://www.fivetran.com/
Best for: warehouse-first teams that want reliable ELT infrastructure
Fivetran is a strong choice when the reporting stack is led by engineering or data teams and the warehouse is the center of analytics.
Strengths:
- Reliable pipeline infrastructure
- Good governance readiness
- Scales well in technical environments
- Strong for raw data movement into warehouse systems
Tradeoffs:
- Not purpose-built for marketer-friendly reporting
- Usually requires downstream modeling and BI work
- Less suitable if business users need direct, low-code reporting workflows
If your team already operates in Snowflake, BigQuery, Redshift, or similar platforms, Fivetran is often a logical candidate.
10) Airbyte
 Website: https://airbyte.com/
Best for: technical teams that want open-source flexibility
Airbyte is a flexible choice for organizations that want deployment control and customization.
Strengths:
- Open-source ecosystem
- Connector flexibility
- Deployment control
- Good fit for engineering-led teams
Tradeoffs:
- Requires more technical ownership
- Maintenance burden can be higher
- Not designed primarily for marketer self-service
Airbyte can be compelling for technical teams, but it is rarely the easiest route for business-side reporting users.
11) Dataslayer
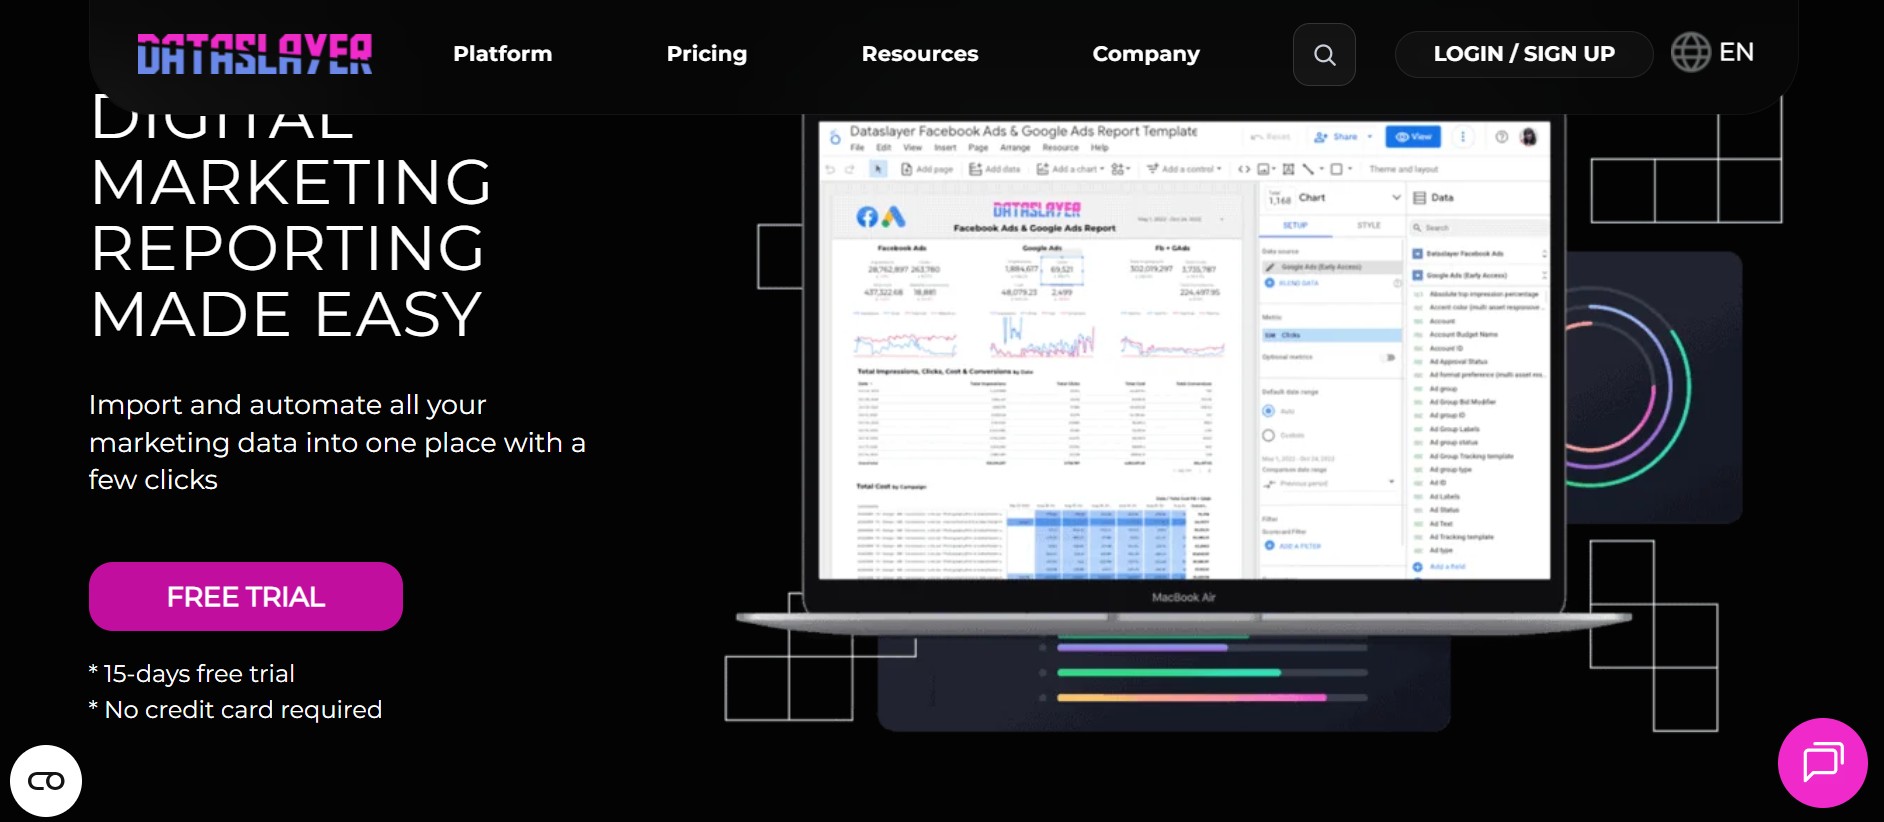 Website: https://www.dataslayer.ai/
Best for: agencies and advertisers working heavily in spreadsheets and dashboards
Dataslayer focuses on practical reporting workflows for PPC and advertising users.
Strengths:
- Familiar spreadsheet-style reporting
- Useful PPC-focused connectors
- Approachable pricing
- Easy for agencies and advertisers to adopt
Tradeoffs:
- Narrower fit for enterprise modeling
- Lighter governance capabilities
- Best when reporting complexity stays moderate
For PPC reporting teams, Dataslayer can be a good operational tool, especially when simplicity matters.
Supermetrics vs. competitors by use case
The right alternative depends more on workflow fit than feature count.
Best choice for agencies
Agencies usually care most about:
- Multi-account management
- Fast client report templates
- Margin-friendly pricing
- Dashboard outputs clients can understand easily
Good fits often include:
- Porter for simple client reporting
- Power My Analytics for repeatable SMB workflows
- Dataslayer for PPC-heavy agency reporting
- Funnel for larger agencies with more complex consolidation needs
If the agency also wants to deliver more interactive analytics internally, FineBI becomes relevant on the BI side after data is centralized.
Best choice for ecommerce and in-house marketing teams
These teams usually prioritize:
- Ad platform depth
- Blended ROAS reporting
- Product or SKU-level visibility
- Dependable daily refreshes
- Cross-source analysis beyond one ad channel
Strong candidates include:
- Windsor.ai for attribution-oriented marketing teams
- Funnel for multi-source reporting maturity
- Coupler.io for lean no-code automation
- FineBI + Dora when the team also needs business-friendly dashboard exploration and AI-assisted insight discovery
Best choice for BI and warehouse-first teams
For more mature analytics organizations, the key factors are:
- Transformation flexibility
- Governance and permissions
- Warehouse compatibility
- Total cost of ownership
- Ability to separate ingestion from analysis
Best fits often include:
- Fivetran for warehouse-first ELT
- Airbyte for customizable technical stacks
- Adverity for enterprise governance
- Improvado for enterprise marketing normalization
- FineBI as the downstream self-service BI layer for business consumption
Best choice for small teams on a budget
Smaller teams need:
- Fast setup
- Clear pricing
- Essential connectors
- Low maintenance
- Minimal implementation effort
Best candidates usually include:
- Porter
- Coupler.io
- Power My Analytics
- Dataslayer
If the team expects reporting needs to expand into broader business dashboards, it is also worth evaluating whether a self-service BI layer such as FineBI will be needed later.
How to choose the right platform and avoid switching twice
The most expensive reporting tool decision is the one you have to redo six months later.
Match the tool to your reporting stack: Sheets, Looker Studio, Power BI, Tableau, or a data warehouse
Start with where your team actually works today:
- If your team lives in Google Sheets, prioritize simplicity and connector stability
- If your team builds dashboards in Looker Studio, choose a tool with easy template workflows
- If your organization uses Power BI or Tableau, consider whether the tool supports efficient BI delivery
- If your stack is warehouse-first, prioritize pipeline reliability and transformation flexibility
- If your business users need direct dashboard exploration, prioritize self-service BI capabilities, not just data delivery
This is where FineBI often enters the conversation. Tools like Supermetrics, Funnel, or Fivetran may help move the data, but business teams still need an intuitive place to analyze it.
Check hidden costs: extra accounts, refresh frequency, API quotas, seats, and managed onboarding
Before choosing any alternative to Supermetrics, review:
- Extra connector charges
- Additional source account pricing
- Destination-based pricing
- User seat limits
- Faster refresh cost tiers
- Managed onboarding or service fees
- API quota-related limitations
The cheapest starting plan can become expensive once real usage begins.
Validate migration risk: field mapping, historical data continuity, dashboard rebuild effort, and support responsiveness
Migration risk is often underestimated. Ask these questions:
- Will key fields map cleanly from your current reports?
- Can you preserve historical performance continuity?
- How much dashboard rebuilding is required?
- How responsive is support when a connector fails?
- Can business users adapt quickly?
A trial is useful, but only if you test a real workflow.
Use a short trial checklist before committing: must-have connectors, sample reports, refresh tests, and stakeholder adoption
A simple evaluation checklist should include:
- Connect your top 3 must-have data sources
- Rebuild 1 or 2 high-value reports
- Test refresh timing and consistency
- Validate key metrics against source platforms
- Check whether business stakeholders can actually use the outputs
Practical recommendations before you choose
Here are five consultant-style recommendations that can help you avoid a poor-fit decision:
-
Choose for your next stage, not just your current report.
If your team is growing, avoid tools that solve only today’s spreadsheet need. -
Separate connector needs from analytics adoption needs.
Many teams think they need a new connector tool when they actually need a better BI experience for business users. -
Test one operational dashboard and one executive dashboard.
This reveals whether the tool works for both detailed monitoring and stakeholder communication. -
Check governance early if multiple teams will use the data.
Permissions, shared definitions, and standard metrics become important faster than many teams expect. -
Evaluate AI features carefully.
AI-assisted analytics is useful when it helps users ask better questions and interpret data faster, not just summarize charts superficially.
When FineBI is a good fit as an alternative to Supermetrics
Tools like Supermetrics, Funnel, and Coupler.io are widely used in the marketing data workflow. But teams that need a more business-user-friendly, self-service BI platform may also consider FineBI.
FineBI is especially relevant when your challenge is no longer only extracting data from ad and analytics platforms, but also:
- Making dashboards easier for business users to build and explore
- Reducing reliance on technical teams for every reporting change
- Enabling drill-down and interactive analysis across marketing and business data
- Supporting dashboard sharing across departments
- Connecting enterprise data into one analysis environment
In practice, this means FineBI often works well for organizations that have already solved some level of data integration but still struggle with the last mile of analytics adoption.
FineBI’s core strengths for marketing and BI teams
FineBI supports a self-service approach through:
- Drag-and-drop dashboard creation
- Interactive filtering and drill-down
- Business-friendly visual analysis
- Enterprise data connectivity
- Reusable dashboards for teams and departments
- Faster iteration for reporting and KPI monitoring
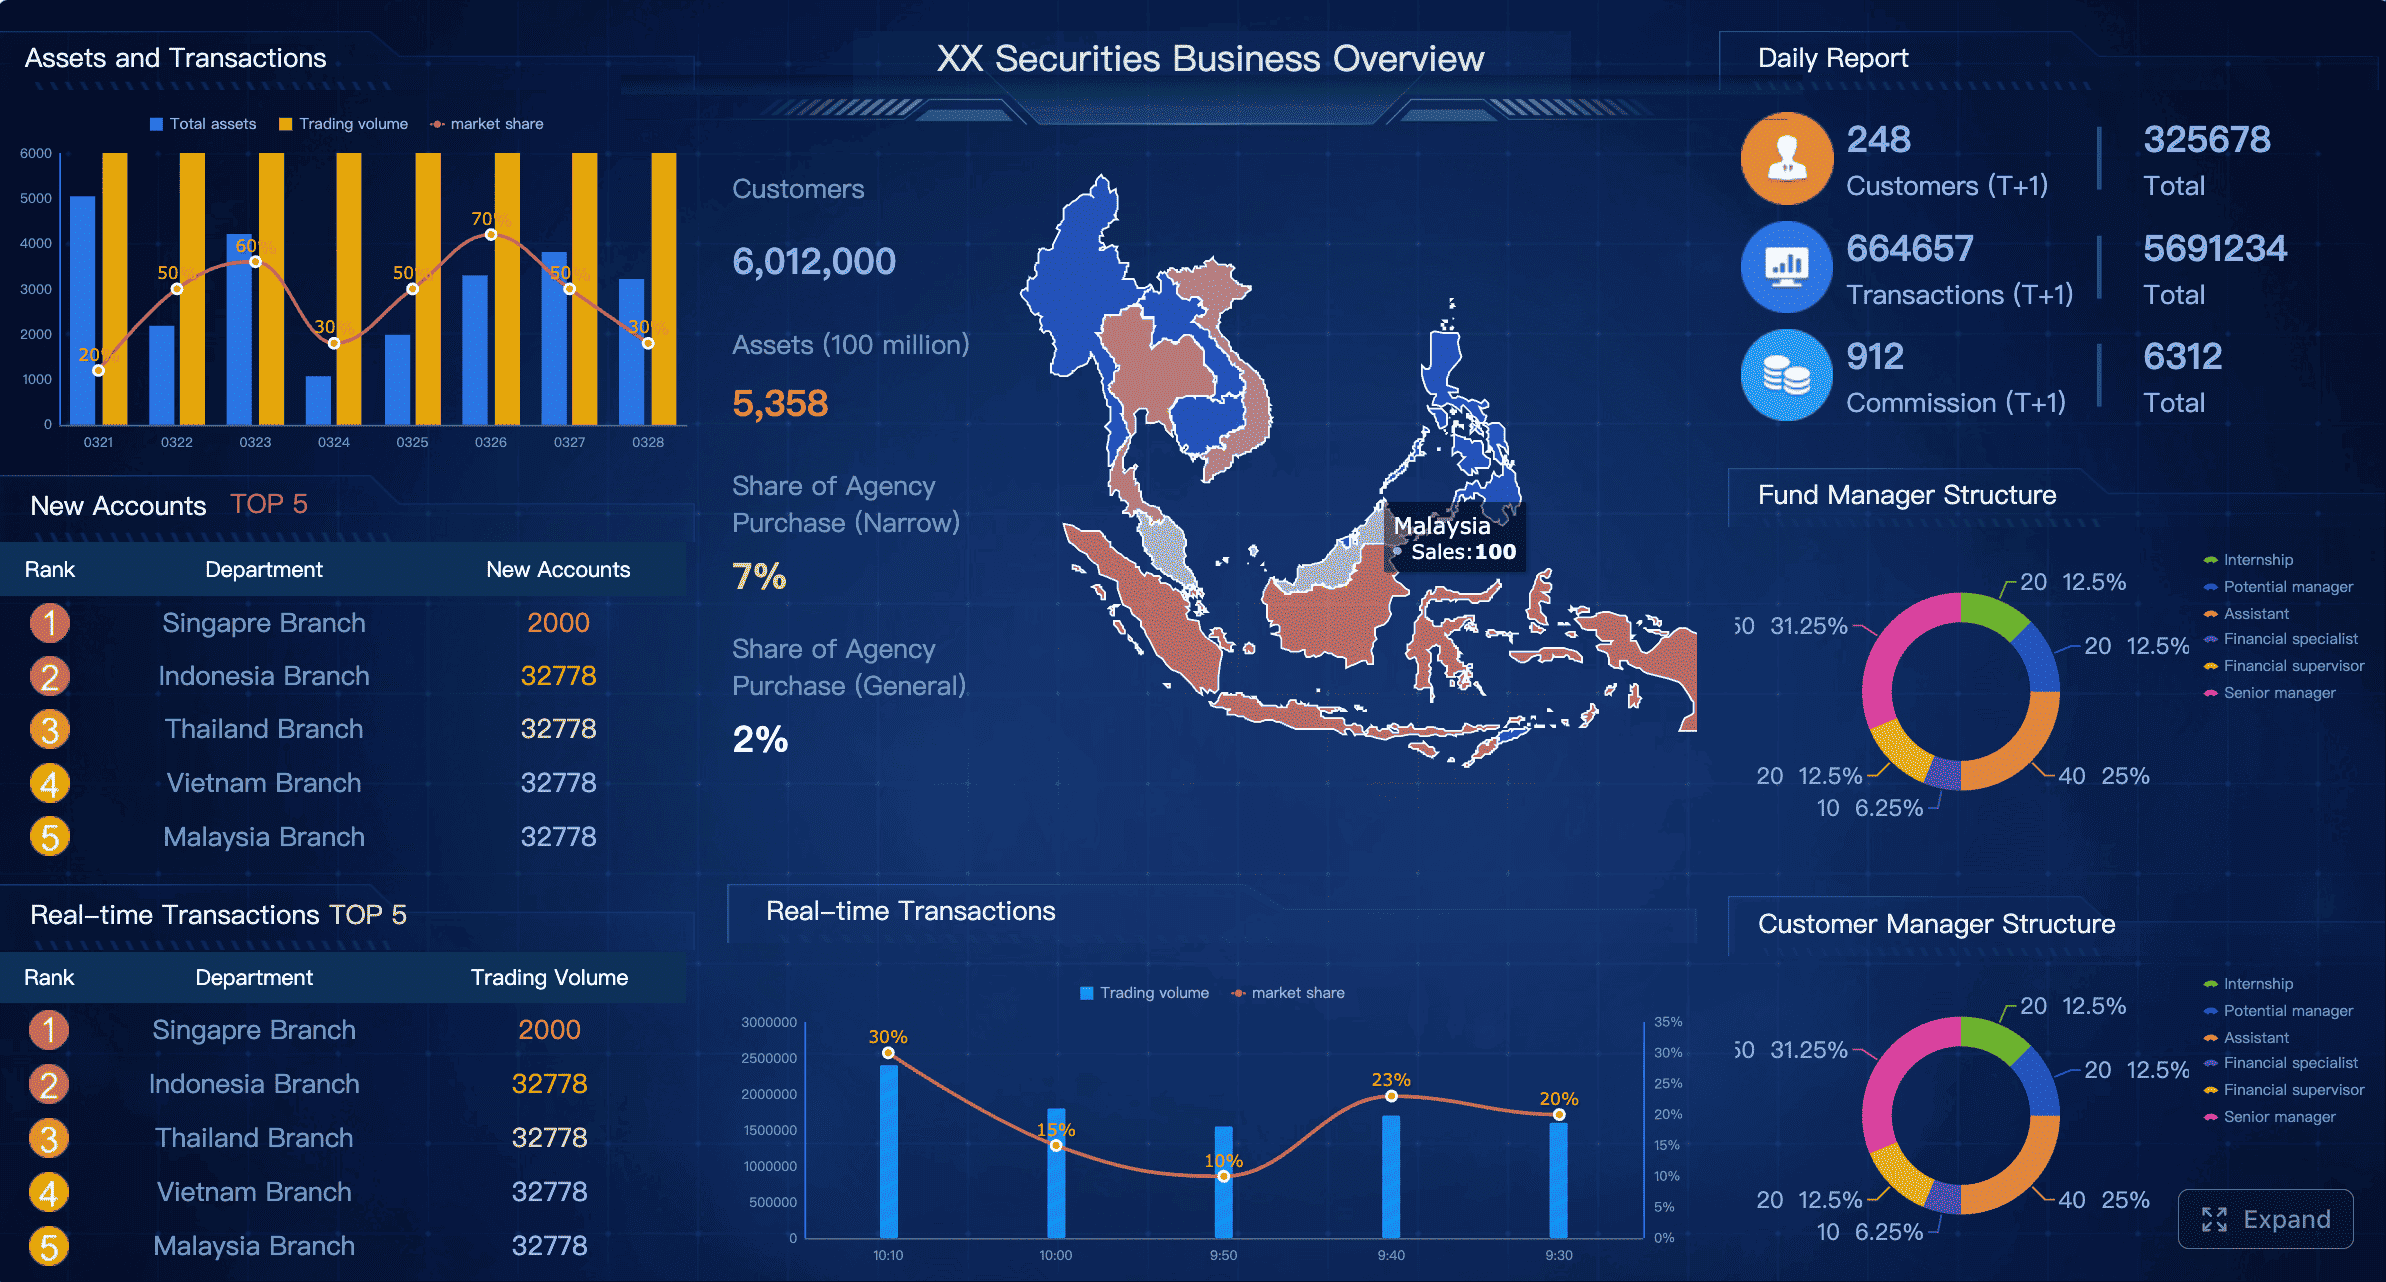
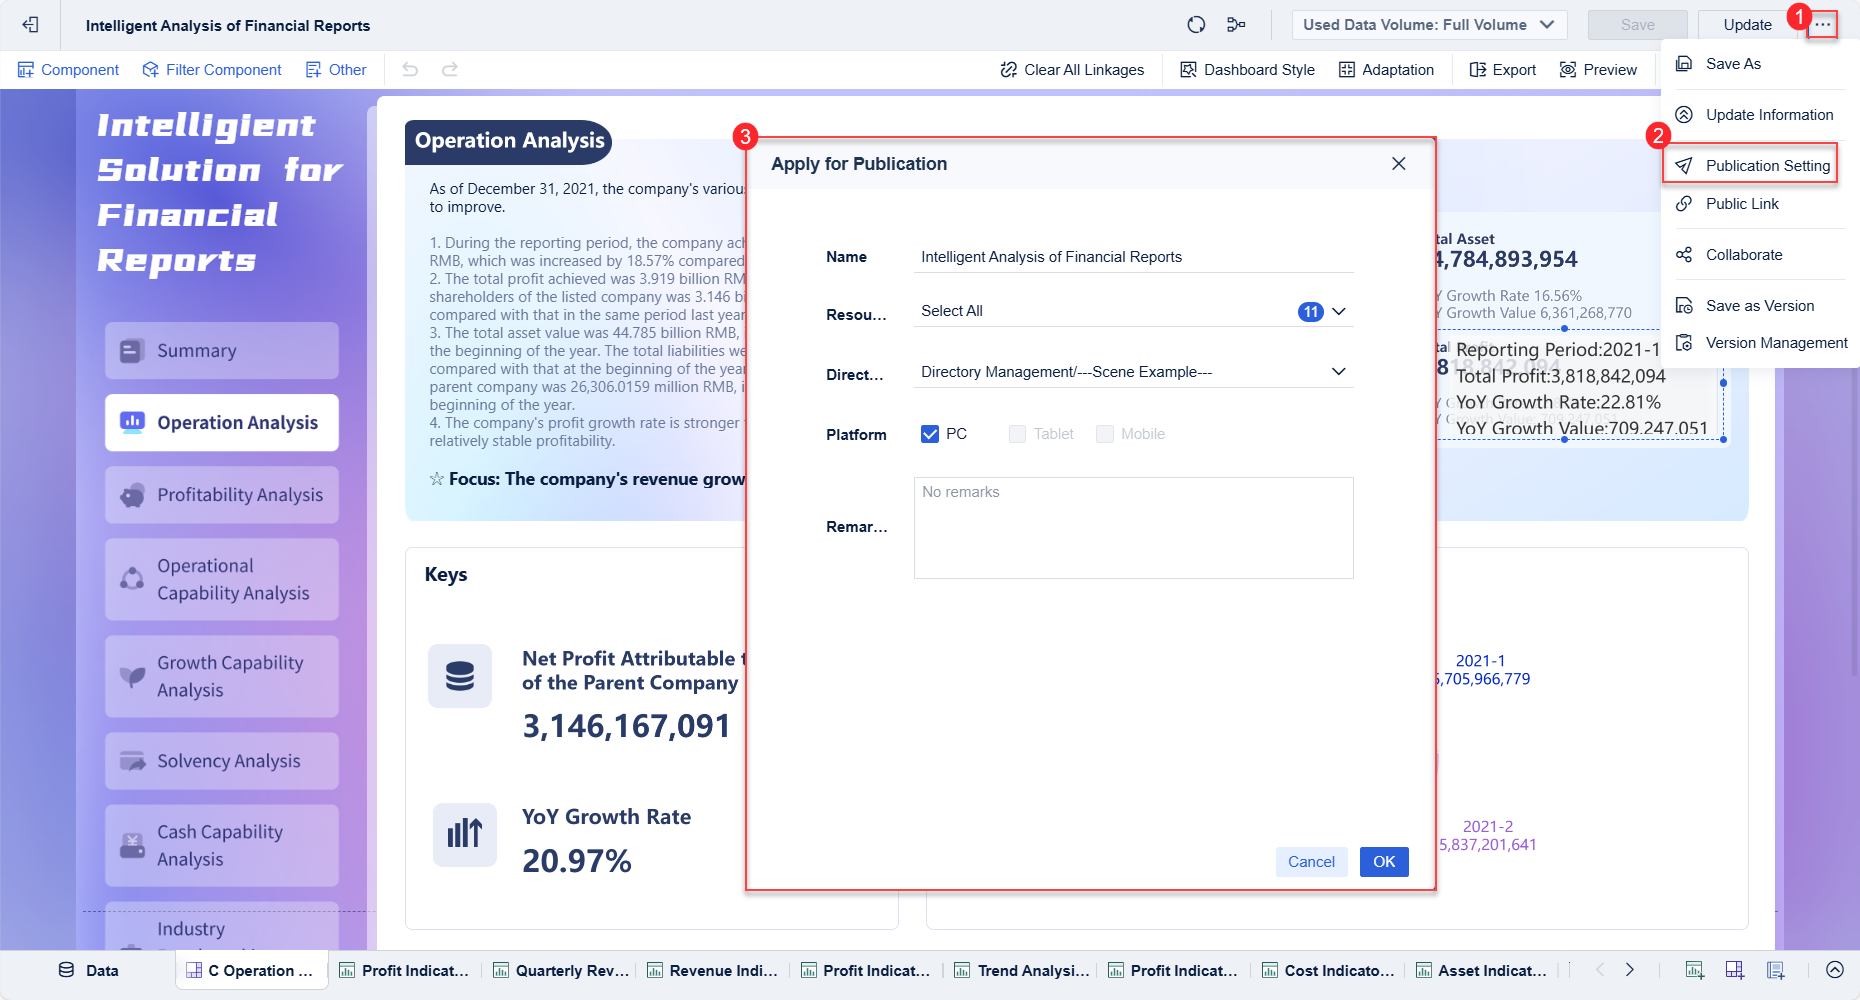 Dashboard Sharing
This is useful for marketing teams that need to compare channel performance, campaign trends, ecommerce metrics, and business outcomes in one place without heavy dependency on technical specialists.
How Dora enhances FineBI with AI-powered analytics
After the core BI layer, Dora adds a valuable AI-powered dimension.
With Dora, FineBI becomes more than a reporting interface. It can help users:
- Ask natural-language questions about dashboard trends
- Speed up insight discovery
- Interpret KPI changes with less manual exploration
- Lower the barrier for non-technical users to engage with data
That combination is increasingly important in 2026 because many organizations want AI to support analysis workflows, not replace them. FineBI + Dora fits that need by helping users move from dashboards to understanding more quickly.

Ask Dora in Natural Language Now →
Where FineBI fits in the stack
A practical way to think about FineBI is this:
- Use connector or pipeline tools to collect and centralize data
- Use FineBI to turn that data into self-service dashboards
- Use Dora to make analysis more accessible and AI-assisted
That makes it a strong option for teams that want to mature from marketing data delivery into broader business intelligence.
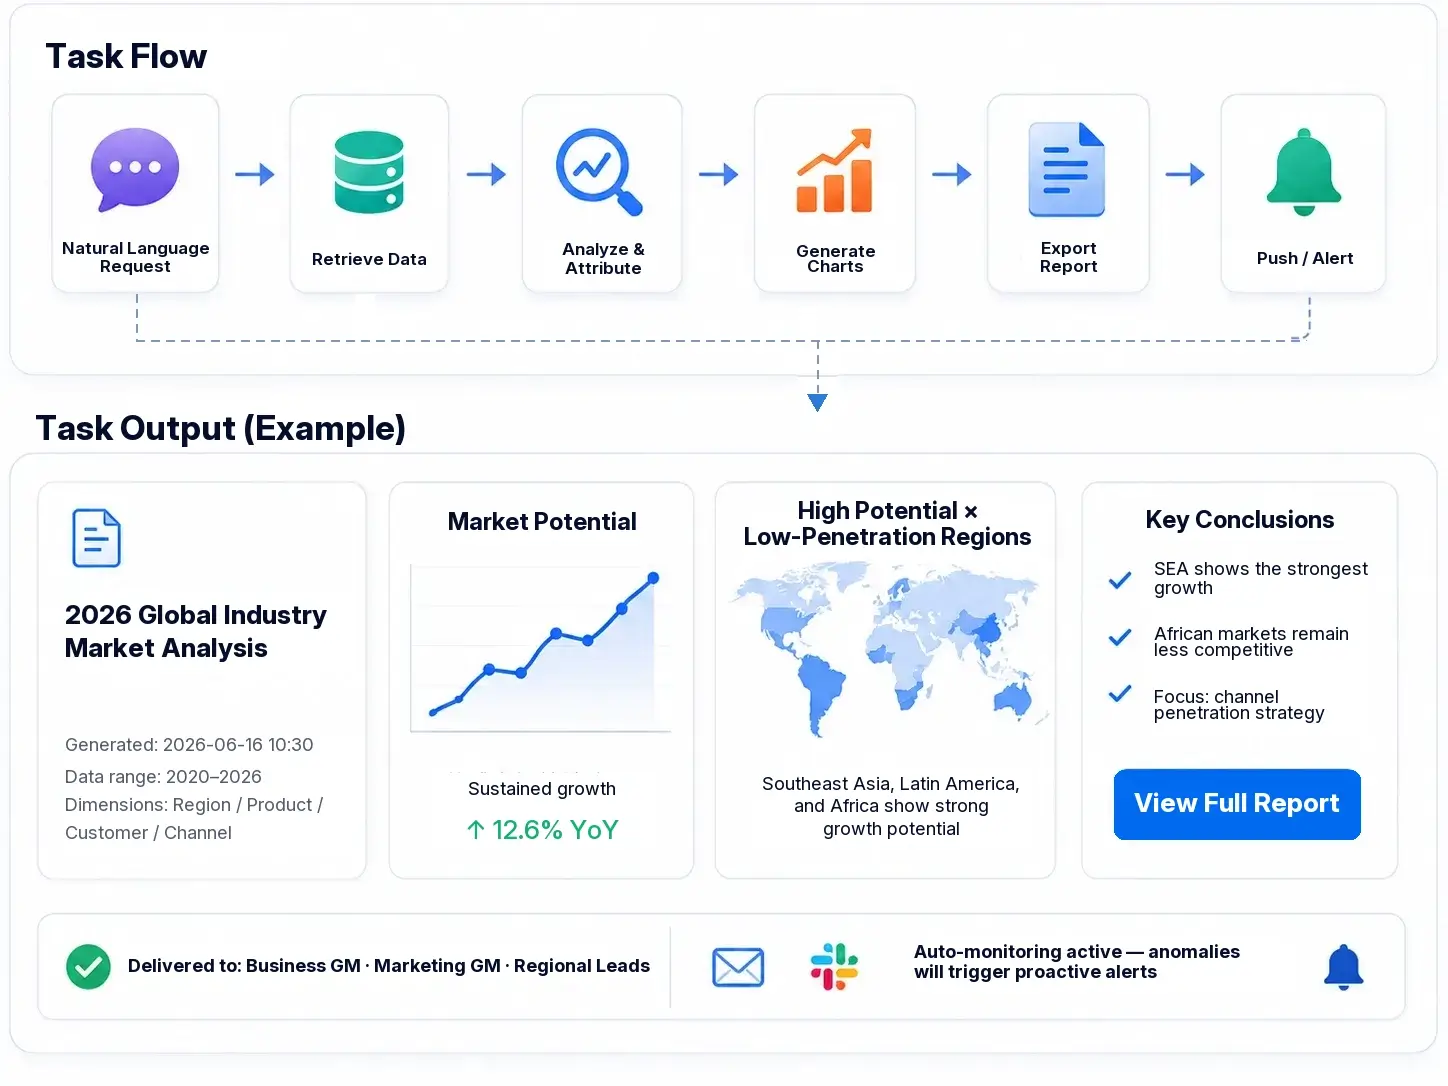 Workflow

Get Ready-to-Use Dashboard Templates in Fine Gallery
Final thoughts: which alternative to Supermetrics should you choose?
The best alternative to Supermetrics depends on what problem you are actually trying to solve.
- Choose Porter, Coupler.io, Power My Analytics, or Dataslayer if you want simpler reporting with low setup friction
- Choose Funnel, Adverity, or Improvado if you need broader marketing data management at scale
- Choose Fivetran or Airbyte if your team is technical and warehouse-first
- Choose FineBI + Dora if your bigger challenge is enabling business users with self-service dashboards and AI-assisted analytics after data has been centralized
A good buying decision is not just about replacing one connector. It is about building a reporting workflow your team will still trust and use a year from now.
FAQs
Focus on pricing structure, connector coverage, refresh reliability, data destinations, transformation capabilities, and whether the platform supports governance or self-service analytics. The right choice depends on whether you need simple reporting, warehouse pipelines, or a broader BI workflow.