Create Reports
Overview
How to create reports in FineReport?
With FineReport, you can craft a variety of report styles using three distinct design layouts: Normal Report Layout, Multi-Report Layout and Dashboard Layout.
- Normal Report Layout: The most popular design format in FineReport, this layout allows you to control template effects through cell expansion and parent/child relationships. Enhance your reports with dynamic features such as parameter queries, data entry functionalities, and chart controls.
- Multi-Report Layout: Effortlessly combine multiple reports or dashboards into a single view, enabling side-by-side comparisons and in-depth analysis of data from different sources—all on one screen.
- Dashboard Layout: Ideal for presenting a variety of components, this layout lets you design engaging dashboards by simply dragging and dropping elements. Your dashboards are fully responsive, displaying seamlessly on mobile phones, PCs, and tablets.
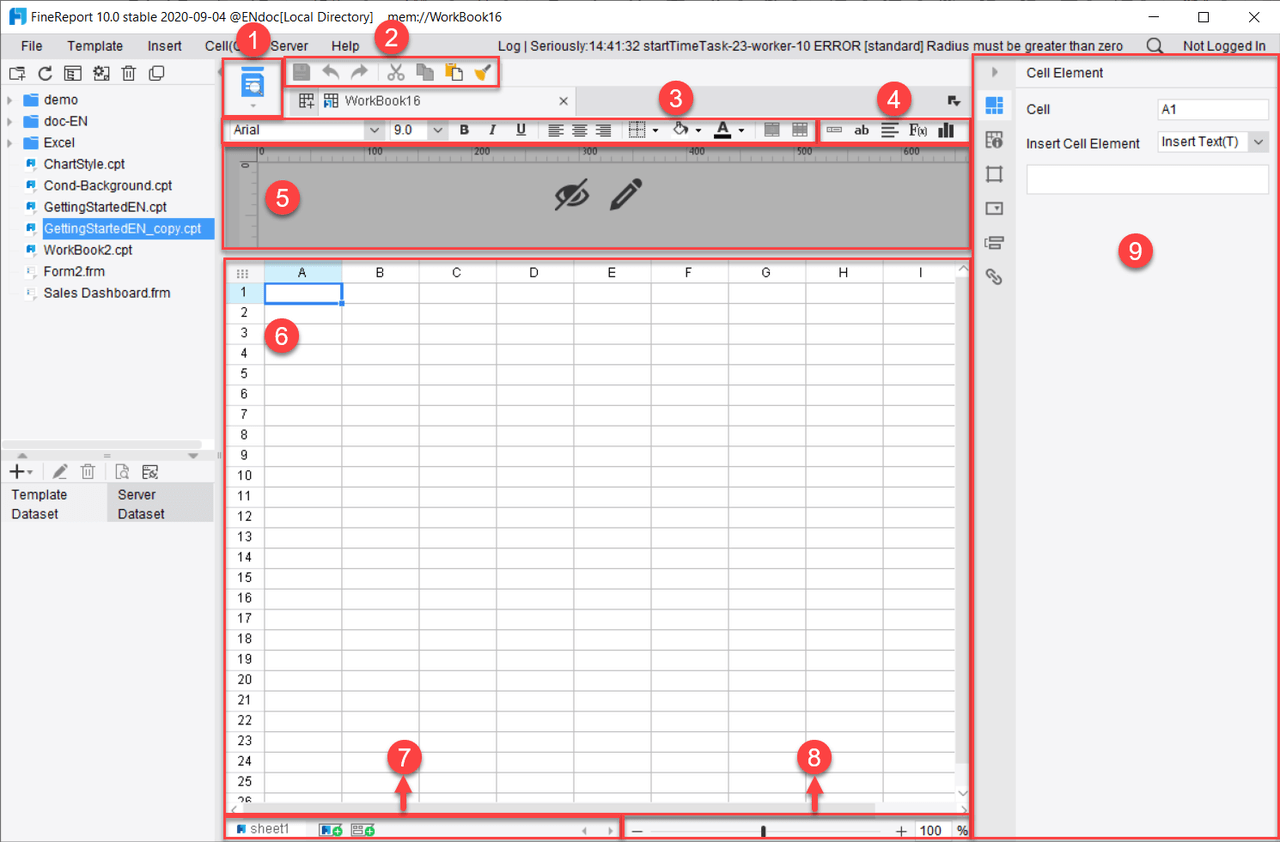
Normal Report Layout
Creating reports with FineReport’s Normal Report Layout is akin to working in Excel, but with a significant advantage: FineReport connects to and utilizes fields from database tables, allowing for a more robust data handling experience. This powerful approach enables users to generate over ten distinct types of reports, tailored to meet diverse business needs. Here’s a closer look at these specific report types:
- Row Reports: Present data in a straightforward row-based layout for clear visibility.
- Cross Reports: Showcase data in a cross-tab format for effortless comparison and analysis.
- Grouped Reports: Organize data by specified categories, facilitating structured analysis.
- Paged Reports: Break large datasets into multiple pages for improved readability.
- Columned Reports: Divide content into columns for compact and efficient data representation.
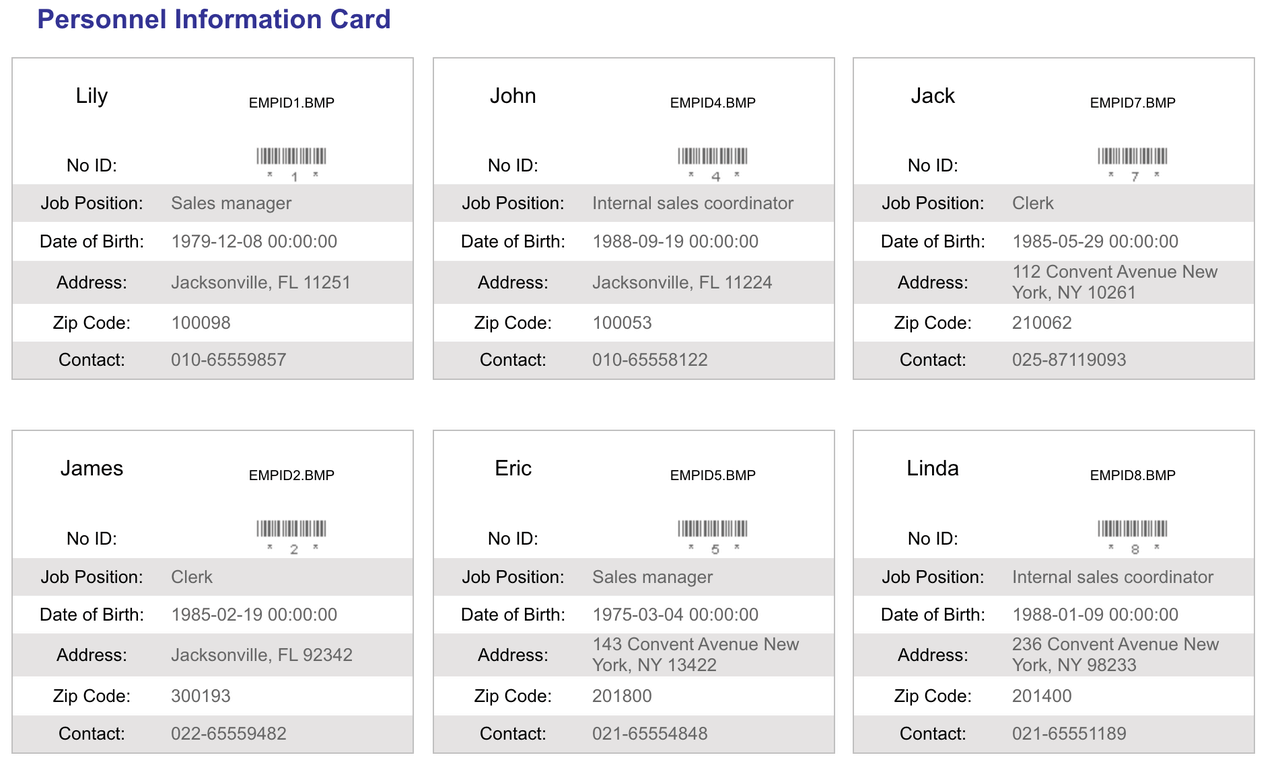
- Master-Detail Reports: Display detailed information for each entry in a master list, providing context and clarity.
- Word Reports: Export reports in Word format for easy sharing and documentation.
Multi-Report Layout
The Multi-Report Layout refers to a format that allows users to display multiple complex tables within a single report. This layout is particularly effective for presenting intricate datasets clearly and concisely. Here are some key aspects:
- Comprehensive Data Display: The Multi-Report Layout allows you to seamlessly integrate a variety of detailed tables—like financial statements, production reports, and order data—into a single view. This empowers users to present a wealth of information at a glance, enhancing clarity and facilitating informed decision-making.
- Structured Presentation: Each table can be organized to highlight specific information, such as revenue, expenses, production quantities, or order statuses. This structured presentation helps viewers quickly locate the information they need.
- Customizable Formats: Users can customize the layout of each table to fit their preferences, adjusting elements like size, style, and content. This flexibility ensures that the report meets specific presentation standards or audience needs.
- Clarity in Reporting: By displaying multiple complex tables together, the layout enhances the clarity of the report. For instance, showing a financial report alongside production data allows stakeholders to see relevant information side by side without needing to flip through multiple documents.
- Efficient Communication: This layout is ideal for communicating detailed information in a straightforward manner. It allows teams to present all necessary data at once, making it easier for stakeholders to understand the overall picture without additional context.
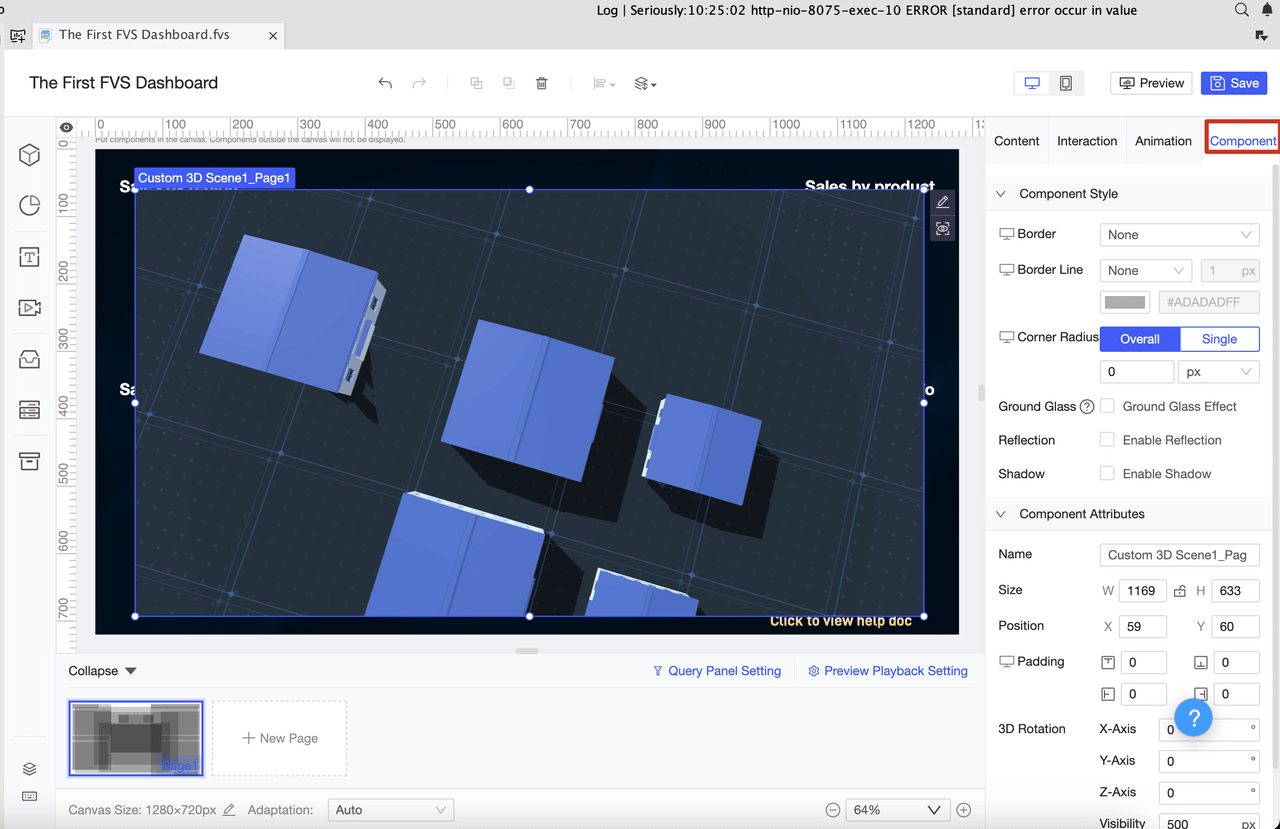
Dashboard Layout
The Dashboard Layout functions like a versatile canvas with multiple pages, akin to a PowerPoint presentation, allowing you to design each page for optimal data display. Enjoy the freedom to customize your dashboard’s appearance with layout options such as tiled, full vertical, full horizontal, or even full-screen views. This flexibility empowers you to create tailored dashboards that effectively communicate your insights.
Report Types
Multi-Data Source Report
As mentioned above, FineReport processes data sets when creating reports, naming them as ds1, ds2, ds3, and so on. When creating a report, you can define multiple data sets, which can come from different database tables or even from different databases.
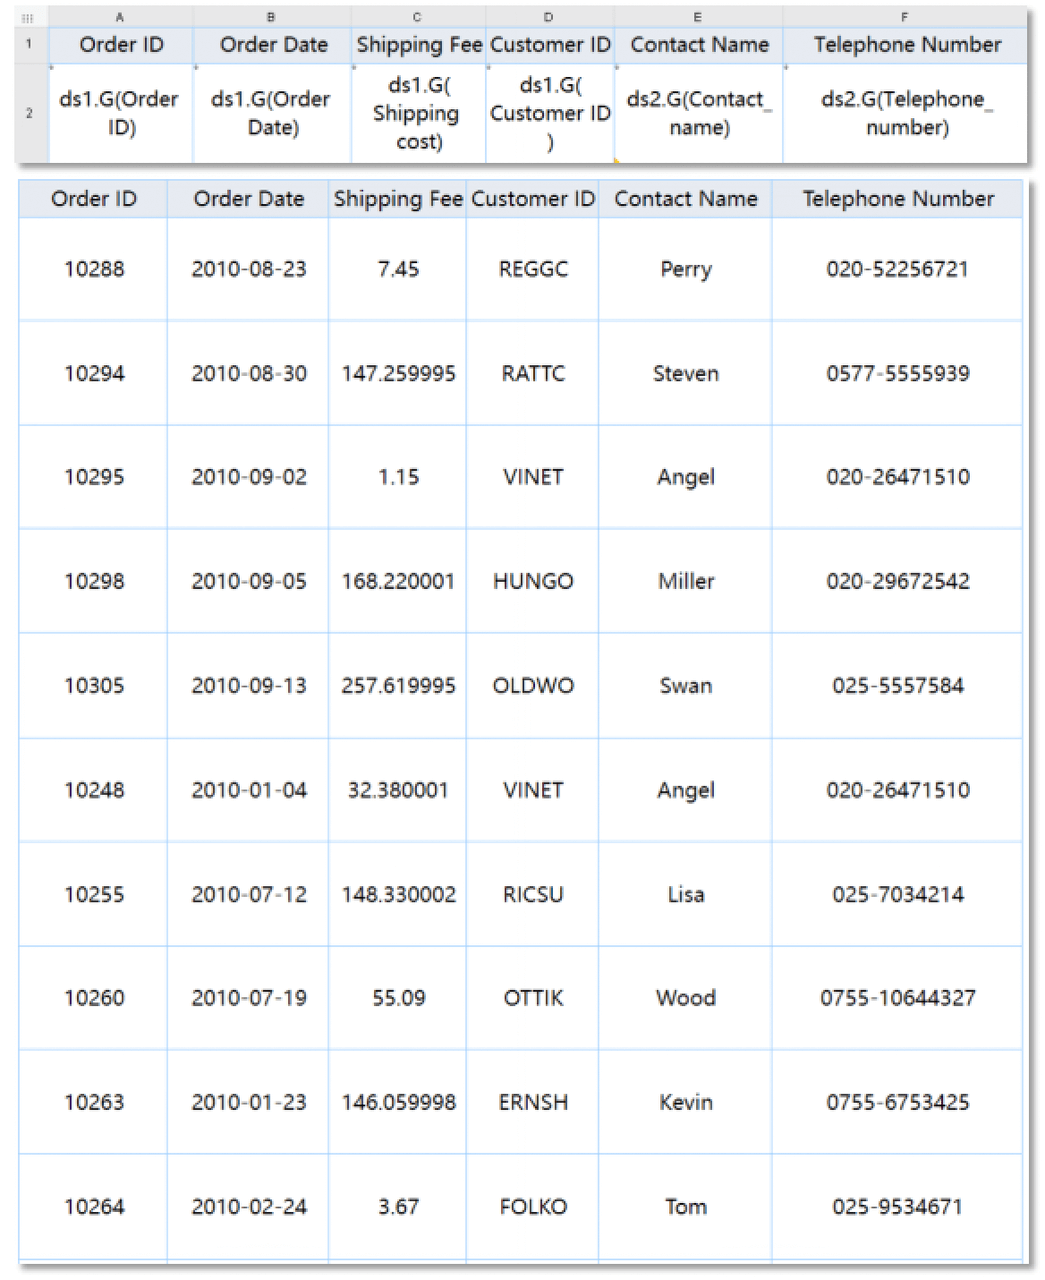
Table Report
Table reports are the cornerstone of data reporting, and FineReport excels at creating a diverse array of table styles and features. While Excel may appear convenient, FineReport offers a significant advantage: it seamlessly integrates data from multiple databases and tables, effortlessly managing larger datasets than Excel can handle. Plus, being web-based, FineReport facilitates easy sharing and collaboration, making it simple to work together on data insights.
Here are some examples of tabular reports:
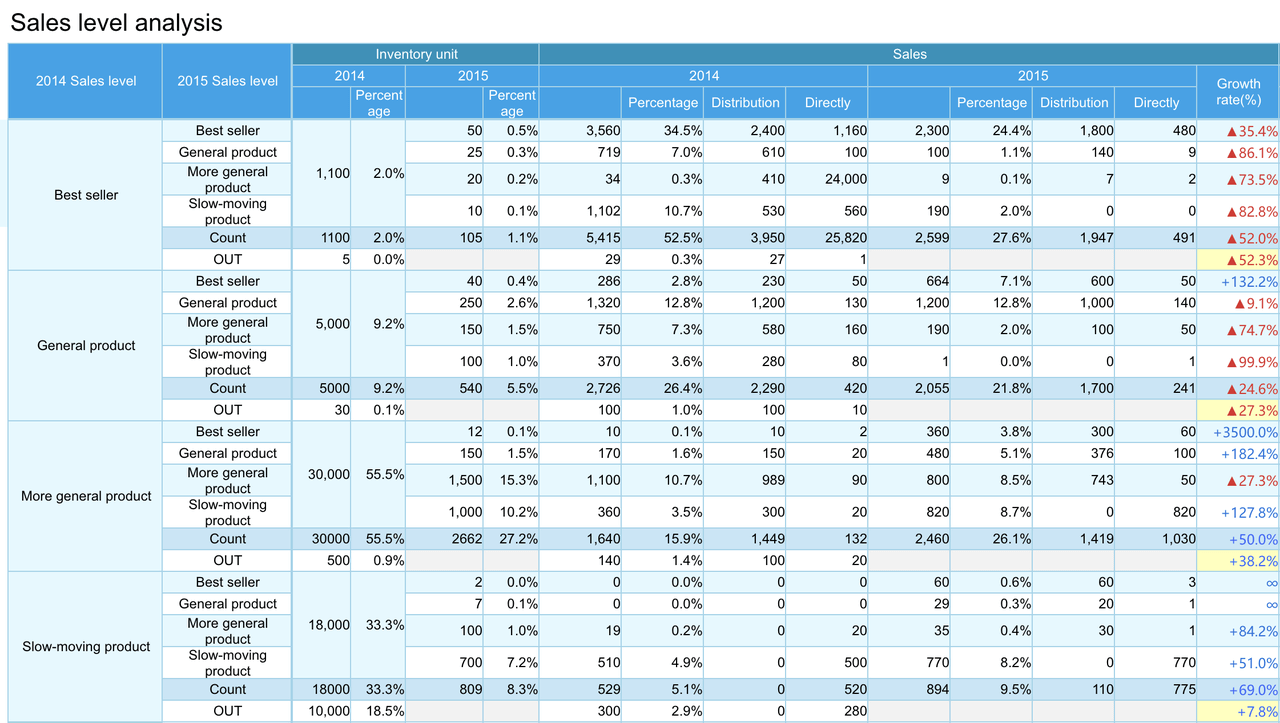
Cross Reports
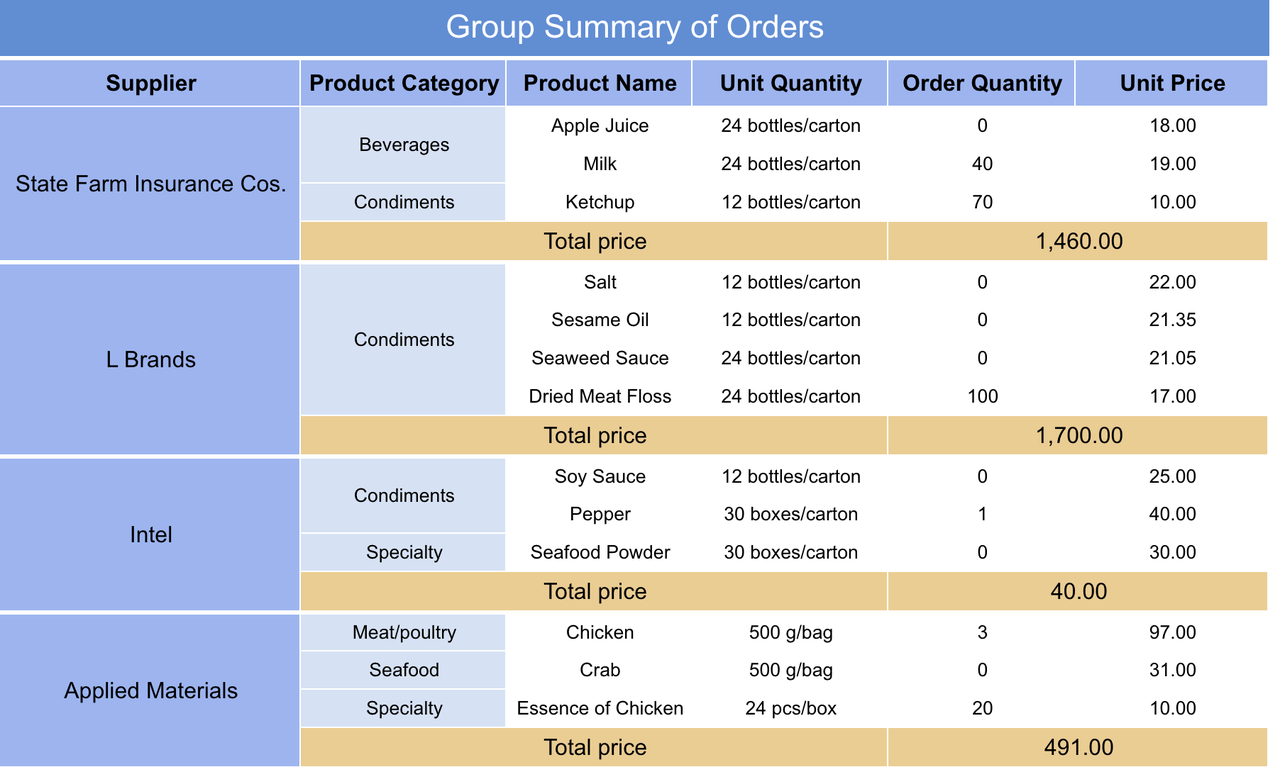
Grouped Reports

Paged Reports
Columned Reports
Inquery Report
A query report is a powerful feature that utilizes parameter controls to filter and refine your data. Below is an example of a straightforward query report, but the possibilities are endless—you can easily configure more complex functionalities to suit your specific needs.
Word Report
A Word report allows you to effortlessly create dynamic data reports directly within Microsoft Word. With FineReport, you can easily insert datasets, parameters, formulas, charts, and tables into your Word documents. Once integrated, you have the flexibility to adjust the layout and formatting right in Word, ensuring your final document meets your exact specifications before exporting.
This guide gives you a basic understanding of FineReport. For usage instructions, please refer to the technical documentation.
Need help with this topic?
Get faster answers in our Discord community.
