Cost per install, or CPI, tells you how much you pay each time a user installs your app through a paid campaign. This metric helps you see how efficiently you acquire new users. Many marketers rely on CPI because you only pay when someone actually installs your app, making your budget work harder.
You can compare CPI across platforms and regions, as shown below:
Marketers value CPI because you pay only for installs, can target the right users, and scale your app’s reach. FineBI helps you analyze these numbers and spot ways to improve your campaigns.
Cost Per Install Explained

What is Cost Per Install?
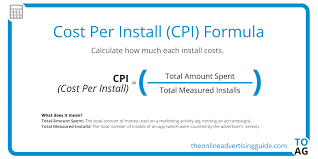
Cost per install CPI is a key metric in mobile app marketing. It measures how much you pay for each new user who installs your app through a paid advertisement. You calculate cost per install CPI by dividing your total ad spend by the number of installs generated from your campaign. For example, if you spend 10,000onadsandreceive5,000installs,yourCPIis2 per install. This pricing model is unique to mobile apps and ensures you only pay when someone actually installs your app, not just when they see or click your ad.
CPI marketing focuses on driving real results. You can track exactly how much you spend to acquire each new user. This helps you manage your budget and measure the effectiveness of your campaigns. The main components that determine your CPI include your ad spend, the number of installs, your targeting strategy, the performance of your ad creative, tap through rate, and your app store conversion rate. By understanding these factors, you can optimize your campaigns and improve your return on investment.
Note: CPI advertising gives you a clear view of your user acquisition costs. You can compare performance across different channels and platforms to find the most efficient way to grow your app.
Cost Per Install vs Other Metrics
When you run app marketing campaigns, you will see several metrics. Cost per install CPI stands out because it directly measures how much you pay for each new user who installs your app. Other common metrics include cost per click (CPC) and cost per mille (CPM).
- Cost per install CPI focuses on actual app installations. This makes it a direct measure of campaign effectiveness for app marketers.
- Cost per click (CPC) measures the cost for each ad click. However, a click does not guarantee a user will install your app.
- Cost per mille (CPM) is the cost for every thousand ad impressions. This metric emphasizes brand awareness rather than direct user actions.
You can see the differences in the table below:
CPI campaigns offer several advantages. You can target a niche audience and guarantee installs, which helps create buzz around your app quickly. However, you may face higher costs due to competition, and the process of creating a successful campaign can be complex. There is also a risk of attracting users who install your app but do not engage with it.
Tip: While cost per install CPI is a low-risk option for advertisers and a strong indicator of campaign performance, you should also monitor user engagement and retention to ensure long-term success.
CPI advertising remains popular among marketers who want maximum return on ad spend. You only pay for actual installations, making it easier to control your budget and measure results. However, installs do not always guarantee active users. For a complete view of your app’s growth, you should also consider metrics like customer acquisition cost (CAC) and cost per action (CPA), which focus on user engagement and long-term value.
How Cost Per Install Works
Cost Per Install Calculation
Cost per install CPI tells you how much you pay to get a new user to install your app through paid promotion. You calculate cost per install CPI by dividing your total ad spend by the number of installs your app receives from a specific campaign. For example, if you spend 2,000onacpicampaignandyourappgets1,000installs,yourcostperinstallCPIis2. This calculation helps you understand the efficiency of your cpi marketing efforts. You can use this metric to compare performance across different channels and time periods.
Knowing your average cpi gives you a benchmark for your app’s user acquisition costs. Marketers often track this number to see if their cpi advertising is working well. If your cost per install CPI is lower than industry averages, your campaigns are likely efficient. If it is higher, you may need to adjust your strategy.
Influencing Factors
Many factors can affect your cost per install CPI. The quality of your ad creatives and the precision of your targeting play a big role. High-quality ads can boost click-through and conversion rates, which lowers your cpi. More focused targeting can increase cpi, but it often brings in users who are more likely to engage with your app.
External factors also influence your cost per install CPI. Seasonality and market trends can cause your cpi to rise or fall. For example, during holidays or major events, competition for app installs increases, which can drive up costs. Recognizing these trends helps you plan your campaigns when competition is lower, which can decrease your cpi. Market trends and competition make it hard to predict costs, so you should monitor your campaigns regularly.
Tip: Track your cost per install CPI over time to spot patterns and adjust your strategy for better results.
Why Cost Per Install Matters
Understanding cost per install CPI is essential for every app marketer. This metric shows you exactly how much you spend to get a new user to install your app through paid promotion. When you track cost per install CPI, you gain a clear picture of your marketing efficiency. You can compare your spending to the number of installs and see if your campaigns deliver real value.
Cost per install CPI helps you make smarter decisions. You can measure the effectiveness of your user acquisition strategies and adjust your approach based on real data. This metric allows you to compare performance across platforms, countries, and time periods. By focusing on cost per install CPI, you ensure that your marketing budget works as hard as possible to grow your app.
Campaign Planning
When you plan a campaign, cost per install CPI gives you a reliable benchmark. You can set realistic goals for your user acquisition efforts by looking at average cost per install numbers in your target markets. For example, the table below shows how average CPI varies by country and platform:
You can use these benchmarks to estimate your budget and forecast the number of installs you can achieve. If your average cpi is higher than the global average, you may need to review your ad creative or targeting strategy. You can also compare your results to industry standards and identify areas for improvement.
Several factors influence your campaign planning:
- Competition: High competition in your market can increase cpi due to bidding wars.
- Ad creative performance: Engaging ads can lower cpi by improving conversion rates.
- Seasonality: Certain times of the year, like holidays, can raise cpi because of higher demand.
- Ad placement: Premium placements may cost more but can deliver better results.
- Ad platform algorithms: Changes in algorithms can affect your cpi and campaign performance.
You should monitor these factors closely. Adjust your campaign settings as needed to keep your cost per install within your target range. By doing so, you can maximize the impact of your cpi marketing and achieve better results for your app.
Tip: Always compare your cpi campaign results to the average cost per install in your industry. This helps you spot trends and make data-driven decisions.

User Acquisition
User acquisition is the foundation of app growth. Cost per install CPI plays a central role in shaping your user acquisition strategy. You want to attract high-quality users at a cost that makes sense for your business. To do this, you must understand the relationship between cpi and user lifetime value (LTV).
- CPI represents the cost to acquire a user, while LTV shows the revenue you earn from that user over time.
- The ideal scenario is for cpi to be less than LTV. This ensures your user acquisition efforts are profitable.
- If your cpi is higher than your LTV, you lose money on each new user.
- Maintaining LTV above cpi is essential for sustainable growth.
You should always track both metrics. When you keep your cpi below your LTV, you create a strong foundation for long-term success. This balance allows you to scale your user acquisition without risking your marketing budget.
The table below highlights key factors that affect user acquisition costs:
You can use cpi advertising to reach your target audience efficiently. By optimizing your campaigns and monitoring your results, you can lower your average cost per install and acquire more users for your app. Remember, a successful user acquisition strategy depends on keeping your cpi in check and focusing on long-term value.
Note: Regularly review your user acquisition data. Adjust your strategy to maintain a healthy balance between cpi and LTV. This approach leads to sustainable app growth.

When you compare cost per install CPI across platforms and networks, you gain valuable insights into your mobile app marketing strategy. Cost per install CPI tells you how much you pay each time a user installs your app through a paid campaign. This metric helps you measure user acquisition efficiency and optimize your budget for mobile growth.
iOS vs Android
The cost per install CPI often differs between iOS and Android platforms. You will notice that the average cost per install is higher for iOS than for Android. The table below shows the typical rates:
Several factors drive this difference. The iOS app store is more competitive, which raises costs for user acquisition. iOS users usually have higher purchasing power, making them more attractive to advertisers. Some app categories, such as gaming, also have higher CPI because users engage more and provide greater value. The table below summarizes these factors:
You should consider these factors when planning your mobile app campaigns. Understanding the differences helps you set realistic goals for user acquisition and manage your budget effectively.
Ad Networks
Ad networks play a major role in determining your cost per install CPI. Each network offers different targeting capabilities and pricing models for mobile app promotion. When you use advanced targeting, you can lower your CPI by reaching users who are more likely to install your app. However, if you target too narrowly, you may increase competition and drive up your average cpi.
Popular ad networks for mobile app marketing include Google Ads, Facebook Ads, and specialized mobile networks. These platforms allow you to reach large audiences and optimize your campaigns for user acquisition. The choice of ad network affects your results, so you should test different options to find the best fit for your app.
Tip: Monitor your campaigns across multiple ad networks. Compare performance to identify which channels deliver the lowest CPI and the highest-quality users for your mobile app.
Optimize Cost Per Install with FineBI
FineBI for CPI Analysis
Cost per install CPI measures how much you spend to acquire each new user for your app through paid campaigns. You use the cost per install formula to divide your total ad spend by the number of installs. This metric helps you understand your user acquisition efficiency and compare your average cost per install across different mobile platforms. In mobile app marketing, tracking cost per install CPI allows you to see which channels deliver the best results and where you can improve.
FineBI gives you the power to analyze cost per install CPI data from multiple sources. You can connect FineBI to your mobile ad networks, app store analytics, and campaign reports. The platform lets you process and visualize CPI data, so you can spot trends and compare performance across iOS and Android. You can build dashboards to track CPI over time, monitor mobile app success, and identify which campaigns deliver the highest ROI. FineBI’s self-service analytics help you filter data in real time and collaborate with your team to optimize user acquisition strategies.
For example, you can create a dashboard in FineBI that shows CPI trends by region, platform, and ad network. You can compare your average cost per install for each mobile channel and see which creative assets drive the lowest CPI. FineBI makes it easy to share insights with your team and adjust your campaigns for better results.
Tip: Use FineBI’s real-time filtering to drill down into specific campaigns and uncover opportunities to lower your CPI.
Tips to Lower Cost Per Install
You can lower your cost per install CPI by using proven strategies in mobile app marketing. Start by optimizing your app store listing. Make sure your app description, screenshots, and reviews are appealing and accurate. Focus on improving retention rates to encourage organic installs and reduce your overall CPI. Retarget users who showed interest but did not install your app. Target specific audiences who are more likely to install your app and engage with it.
Test different ad creatives to find the most engaging ads. Use social proof by featuring positive reviews or ratings in your ads. Monitor and adjust your bids based on campaign performance to improve ROI. Target geographic locations that offer better monetization and lower CPI. Avoid common mistakes such as improper budget allocation, ineffective creative strategies, and sloppy targeting. Integrate various marketing approaches to maximize mobile app success.
Note: Always know your metrics and optimize towards post-install events to ensure users engage with your app beyond the initial install.
Understanding and optimizing cost per install is essential for app marketers. You measure campaign efficiency, optimize your budget, and track user acquisition costs. When you use tools like FineBI, you gain data-driven insights that help you analyze customer behavior and campaign performance. Consistent monitoring of cpi lets you refine campaigns and focus on high-quality users. To make smarter decisions, you should:
- Refine your audience targeting
- Prioritize post-install engagement
- Align campaigns with monetization goals
- Optimize landing pages for conversion
- Monitor and iterate continuously
This approach helps you drive long-term app growth and improve marketing ROI.


